

Abstract
Objective
To determine the utility of longitudinal MRI measurements as potential biomarkers in the main genetic variants of frontotemporal dementia (FTD), including microtubule-associated protein tau (MAPT) and progranulin (GRN) mutations, and C9ORF72 repeat expansions, as well as sporadic FTD.
Methods
In this longitudinal study, 58 subjects were identified that had at least two MRI and MAPT mutations (n=21), GRN mutations (n=11), C9ORF72 repeat expansions (n=11) or sporadic FTD (n=15). A total of 198 serial MRI were analyzed. Rates of whole brain atrophy were calculated using the boundary-shift integral. Regional rates of atrophy were calculated using tensor-based morphometry. Sample size estimates were calculated.
Results
Progressive brain atrophy was observed in all groups, with fastest rates of whole brain atrophy in GRN, followed by sporadic FTD, C9ORF72 and MAPT. All variants showed greatest rates in frontal and temporal lobes, with parietal lobes also strikingly affected in GRN. Regional rates of atrophy across all lobes were greater in GRN compared to the other groups. C9ORF72 showed greater rates of atrophy in left cerebellum and right occipital lobe than MAPT, and sporadic FTD showed greater rates in anterior cingulate than C9ORF72 and MAPT. Sample size estimates were lowest using temporal lobe rates in GRN, ventricular rates in MAPT and C9ORF72, and whole brain rates in sporadic FTD.
Conclusion
These data support the utility of using rates of atrophy as outcome measures in future drug trials in FTD and show that different imaging biomarkers may offer advantages in the different variants of FTD.
Keywords: MRI, longitudinal, frontotemporal dementia, genetics, tensor-based morphometry
Introduction
Familial frontotemporal dementia (FTD) has become increasingly important as a number of major gene mutations have been discovered, including mutations in the microtubule-associated protein tau (MAPT)[1] and progranulin (GRN)[2, 3] genes, and repeat expansions in the C9ORF72 gene[4, 5]. These mutations are associated with specific pathologies making them ideal targets for future therapeutic trials in FTD[6]. Families with these genetic mutations can also be prospectively followed providing invaluable opportunities to assess, and potentially treat, the very earliest stages of the disease. However, if these subjects are to be included in treatment trials, outcome measures will be needed that provide biomarkers of disease progression. Longitudinal MRI measures can serve as excellent disease biomarkers, although little is known about how atrophy progresses over time in these genetic variants of FTD. Cross-sectional studies have shown that the different genetic mutations have specific focal neuroimaging signatures[7-11], suggesting that regional longitudinal MRI may prove to be the most useful biomarkers.
We aimed to assess whole brain and regional rates of atrophy in MAPT, GRN and C9ORF72, as well as sporadic FTD, using large cohorts of subjects with multiple longitudinal MRI. We hypothesized that regional MRI measures may provide smaller sample size estimates for treatment trials compared to global measures of atrophy. These findings will help characterize progression in these variants and determine whether longitudinal MRI measures could have utility as potential biomarkers in FTD. This study furthers our previous work on genetic FTD[10-12], by assessing for the first time regional rates of atrophy over time in MAPT, GRN, C9ORF72 and sporadic FTD, and providing sample size estimates.
Methods
Subjects
We identified all subjects that had been seen at Mayo Clinic, Rochester, MN, who had screened positive for mutations in MAPT, GRN or C9ORF72, were symptomatic and that had two or more volumetric MRI (n=43) between 01/1993 and 12/2012. Genetic analyses were performed as previously described[1, 2, 4, 13]. Twenty-one subjects were identified with MAPT mutations, representing 10 families and 9 different mutations (P301L, IVS10+16, IVS10+3, N279K, V337M, S305N, G389R, R406W, Q336H). Eleven subjects were identified with GRN mutations, representing 7 families and 7 different mutations. The remaining 11 subjects had repeat expansions in C9ORF72.
We also identified all subjects (n=15) with behavioral variant FTD (bvFTD)[14], with or without ALS, who did not have a family history of either FTD or amyotrophic lateral sclerosis (ALS) in a first or second degree relative, screened negative for MAPT, GRN and C9ORF72 mutations, and had two or more serial MRI. All 15 were considered to have sporadic FTD.
All subjects had been prospectively recruited and longitudinally followed in our Alzheimer's Disease Research Center with volumetric MRI performed annually. Clinical diagnoses were made according to consensus criteria for bvFTD[14], FTD with ALS[15], primary progressive aphasia[16], or Alzheimer's disease[17].
Informed consent was obtained from all subjects and/or their proxies for participation in the study, which was approved by the Mayo IRB.
MRI analysis
All subjects underwent a standardized protocol head MRI that included a T1-weighted 3-dimensional volumetric sequence[18]. While some subjects had been scanned at 1.5T and some at 3T, longitudinal scans for each subject were limited to those performed at the same field strength. A total of 198 serial MRI were analyzed. All images underwent pre-processing corrections for gradient non-linearity and intensity inhomogeneity. All scan-pairs for each subject underwent 9 degree-of-freedom rigid-body registration and differential bias correction[19].
Rates of atrophy were calculated at the global, lobar, regional and voxel-level. For the global analysis, rates of whole brain atrophy and ventricular expansion were calculated from all scan-pairs registered to baseline using the brain boundary shift integral[20, 21]. Rates of lobar and regional atrophy were assessed using all scan-pairs and an in-house modified version of tensor-based morphometry using symmetric normalization[22] (TBM-SyN) in SPM5[23]. The AAL[24] atlas was used to obtain regional volume estimates for every scan-pair. Specific regions-of-interest (ROIs) analyzed were based on cross-sectional findings in each mutation, and covered frontal, temporal, parietal and occipital lobes, and insula, cerebellum, thalamus, striatum and sensorimotor cortex. Left and right hemispheres were assessed separately. Voxel-level comparisons of annualized log Jacobians from TBM-SyN were performed across groups using SPM5 to allow visualization of group differences. T-tests were used to compare across the groups with results assessed at p<0.001 with an extent threshold of 200 voxels.
Statistical analysis
We used linear mixed effects models with subject-specific random intercepts and slopes to fit longitudinal models of log(volume) over time[25]. The timescale was time from baseline scan. We specified a time-by-group interaction to obtain group-specific slope coefficients. By estimating approximate percentage change via the log transformation, we are making a reasonable assumption of a constant rate of decay, i.e., x%/year, which is non-linear on the volume scale. We note that upon inspecting the data at the subject-level, trajectories tended to be approximately linear over the period of follow-up, providing empirical support for the model. While age differed across groups, we chose not to adjust for age because of intrinsic age differences across groups. To adjust our models for age, ignoring technical difficulties due to imbalance in the age distributions across the groups would essentially be “anchoring” groups at a common age. This would have the unintended consequence of comparing late-stage MAPT cases versus early stage cases from other groups. In order to assess the influence of field strength we reran the models including a field strength-by-time interaction. The interactions were not significant (p values > 0.12) and the interaction coefficient estimates were small and ambiguous in terms of direction of the effect across regions indicating that field strength was not associated with rates in our cohort.
We estimated sample sizes needed per arm to conduct a hypothetical 12 month parallel design two-arm clinical trial designed to detect a slowing of atrophy by 20% with 80% power and two-sided alpha of 5%. We first estimated the rate of change for each subject based on a least squares fit using all scans and treating log volume as the response with time in years as the predictor. The placebo rate was assumed to be equal to the observed mean while the treated rate was assumed to be 20% less. The effect size was calculated as the difference between the two rates divided by the observed standard deviation and this was plugged into the standard two-sample, two-sided t-test formula.
Our analyses were performed using all available subjects with the rationale that a clinical treatment trial will likely recruit all subjects with these mutations, regardless of clinical phenotype. We did, however, also perform a secondary analysis limited to subjects with bvFTD (n=46, 154 scans).
Results
Subject demographics
Subject groups did not differ in demographics, cognitive or functional performance, or follow-up time, but did differ in age, with the MAPT group younger than the other groups (Table 1).
Table 1. Subject characteristics at baseline MRI.
| Characteristic | GRN (n=11) | MAPT (n=21) | C9ORF72 (n=11) | Sporadic (n=15) | P |
|---|---|---|---|---|---|
| Women, n (%) | 6 (55%) | 9 (43%) | 5 (45%) | 8 (53%) | 0.89 |
| Age at baseline, years | 63 (58, 68) | 52 (45, 60) | 63 (52, 70) | 64 (58, 70) | 0.003a |
| Education, years | 14 (12, 16) | 14 (12, 16) | 14 (12, 16) | 15 (12, 16) | >0.99 |
| Clinical Dementia Rating sum of boxes score | 5 (3, 8) | 4 (2, 6) | 4 (3, 6) | 6 (5, 8) | 0.06b |
| Mini Mental State Exam score | 24 (16, 24) | 25 (23 29) | 24 (22, 26) | 22 (22, 25) | 0.12 |
| Age at disease onset, years | 60 (57, 65) | 44 (38, 52) | 56 (49, 66) | 59 (53, 65) | <0.001c |
| Disease duration, years | 2 (1, 3) | 4 (1, 8) | 4 (3, 4) | 3 (2, 6) | 0.33 |
| Number of MRI studies | 3 (2, 4) | 3 (2, 5) | 3 (2, 4) | 2 (2, 3) | 0.17 |
| Field strength d | 0.75 | ||||
| 1.5 T | 6 (55%) | 9 (43%) | 5 (45%) | 9 (60%) | |
| 3 T | 5 (45%) | 12 (57%) | 6 (55%) | 6 (40%) | |
| Time from baseline to last MRI, years | 1.9 (1.1, 3.6) | 2.6 (1.7, 4.5) | 1.6 (1.0, 3.2) | 1.1 (1.0, 2.4) | 0.29 |
| Time between scans, years | 1.0 (0.9, 1.3) | 1.0 (0.9, 1.1) | 1.0 (1.0, 1.1) | 1.1 (1.0, 1.2) | 0.29 |
| Clinical diagnoses | |||||
| bvFTD | 6 (55%) | 19 (90%) | 7 (64%) | 14 (93%) | |
| FTD-ALS | 0 (0%) | 1 (5%) | 3 (27%) | 1 (7%) | |
| PPA | 4 (36%) | 1 (5%) | 0 (0%) | 0 (0%) | |
| AD | 1 (9%) | 0 (0%) | 1 (9%) | 0 (0%) |
Values shown are number (%) or median (inter-quartile range).
P < 0.05 for pairwise comparisons between MAPT and other three groups
Sporadic patients higher than MAPT and C9 (P < 0.05)
MAPT younger at onset than other three groups (P < 0.01)
Subjects scanned at the same field strength for all MRI exams.
bvFTD = behavioral variant frontotemporal dementia; FTD-ALS = frontotemporal dementia with amyotrophic lateral sclerosis; PPA = primary progressive aphasia; AD = Alzheimer's disease
Global rates of atrophy
Annualized rates of whole brain atrophy were greatest in GRN, followed by sporadic FTD, C9ORF72, and lastly MAPT; with a trend for differences across groups (p=0.06) (Table 2). Similarly, rates of ventricular expansion were greatest in GRN, followed by sporadic FTD, and then C9ORF72 and MAPT, with no difference observed across groups (Table 2).
Table 2. Estimated annual percentage change (95% CI) in global and lobar volumes by group.
| Lobe | Hem | GRN | MAPT | C9ORF72 | Sporadic FTD | P value |
|---|---|---|---|---|---|---|
| Whole brain | Total | -2.9% (-3.5%, -2.3%) | -1.9% (-2.3%, -1.5%) | -2.1% (-2.9%, -1.3%) | -2.5% (-3.2%, -1.9%) | 0.06 |
| Ventricle | Total | 17% (13%, 20%) | 12% (10%, 15%) | 12% (7%, 17%) | 15% (11%, 19%) | 0.20 |
| Frontal | Total | -6.0% (-7.9%, -4.0%) | -3.6% (-4.9%, -2.3%) | -3.5% (-5.5%, -1.5%) | -5.4% (-7.2%, -3.6%) | 0.12 |
| L | -7.4% (-9.2%, -5.5%) | -3.4% (-4.7%, -2.2%) | -3.5% (-5.4%, -1.6%) | -5.2% (-6.9%, -3.5%) | 0.003a,b | |
| R | -4.8% (-6.9%, -2.7%) | -3.7% (-5.2%, -2.3%) | -3.5% (-5.7%, -1.3%) | -5.5% (-7.5%, -3.6%) | 0.40 | |
| Temporal | Total | -5.3% (-6.8%, -3.8%) | -3.3% (-4.4%, -2.3%) | -3.3% (-4.8%, -1.8%) | -3.8% (-5.1%, -2.4%) | 0.16 |
| L | -7.0% (-8.5%, -5.5%) | -3.3% (-4.4%, -2.3%) | -3.3% (-4.9%, -1.8%) | -3.7% (-5.0%, -2.3%) | <0.001a,b,c | |
| R | -4.4% (-6.1%, -2.7%) | -3.3% (-4.5%, -2.1%) | -3.2% (-5.0%, -1.5%) | -3.9% (-5.4%, -2.4%) | 0.71 | |
| Parietal | Total | -6.8% (-8.5%, -5.1%) | -2.1% (-3.3%, -1.0%) | -3.1% (-4.9%, -1.3%) | -3.4% (-5.0%, -1.8%) | <0.001a,b,c |
| L | -7.8% (-9.5%, -6.0%) | -2.2% (-3.3%, -1.0%) | -2.8% (-4.5%, -1.0%) | -3.1% (-4.7%, -1.5%) | <0.001a,b,c | |
| R | -6.2% (-8.1%, -4.3%) | -2.1% (-3.4%, -0.8%) | -3.5% (-5.4%, -1.5%) | -3.8% (-5.5%, -2.1%) | 0.007a,b | |
| Occipital | Total | -1.8% (-2.5%, -1.0%) | -0.3% (-0.8%, 0.2%) | -1.2% (-1.9%, -0.4%) | -1.1% (-1.8%, -0.4%) | 0.007a |
| L | -2.2% (-2.9%, -1.5%) | -0.4% (-0.9%, 0.1%) | -1.1% (-1.8%, -0.3%) | -1.1% (-1.8%, -0.4%) | 0.001a,b,c | |
| R | -1.5% (-2.3%, -0.6%) | -0.2% (-0.8%, 0.3%) | -1.4% (-2.2%, -0.5%) | -1.2% (-2.0%, -0.4%) | 0.03a,d |
Significant difference between GRN and MAPT at p<0.05
Significant difference between GRN and C9ORF72 at p<0.05
Significant difference between GRN and sporadic FTD at p<0.05
Significant difference between MAPT and C9ORF72 at p<0.05
Lobar rates of atrophy
Lobar rates of atrophy were greatest in frontal lobe, followed by temporal lobe, in MAPT, C9ORF72 and sporadic FTD (Table 2). In contrast, GRN showed greatest rates in parietal lobe. Lobar rates were highly asymmetric in GRN, with greatest rates in the left hemisphere, while rates in the other three groups were more symmetric. Rates of atrophy across all four lobes were greatest in GRN. Specifically, GRN showed greater rates of atrophy than all three other groups in the total temporal, total parietal, left parietal and left occipital lobe. Rates of left frontal and right parietal atrophy were greater in GRN compared to both MAPT and C9ORF72, but not sporadic FTD. Rates of total and right occipital atrophy in GRN were only greater than MAPT. In addition, rates of right occipital atrophy were greater in C9ORF72 compared to MAPT. The results remained largely the same when the analysis was limited to subjects with bvFTD (Table S1), except that rates in GRN were more symmetric.
Regional rates of atrophy
Regional rates of atrophy within each group are shown in Figure 1. Similar to the lobar-level analysis, rates of atrophy were asymmetric in GRN, with greater involvement of the left hemisphere, and GRN showed faster rates than the other groups across most ROIs. Some group differences were also observed between MAPT, C9ORF72 and sporadic FTD. First, sporadic FTD showed greater rates of left and right anterior cingulum atrophy compared to both MAPT and C9ORF72, and showed great rates of left thalamic atrophy than MAPT. Secondly, C9ORF72 and sporadic FTD both showed greater rates of atrophy in left cerebellum compared to MAPT. Regional rates of atrophy for the secondary analysis limited to bvFTD are shown in Figure S1.
Figure 1. Estimated annual percentage change (95% CI) in regional volumes within each group.
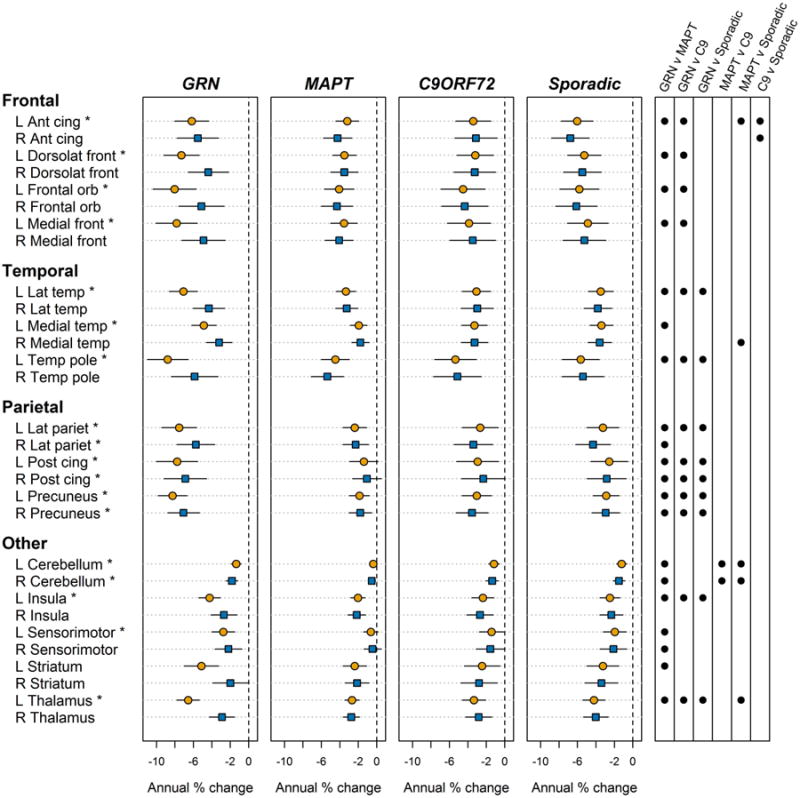
L = left; R = right; ant = anterior; post = posterior; dorsolat = dorsolateral; cing = cingulate
* Significant difference observed across the four groups at p<0.05. Significant (p<0.05) pairwise p values are shown as circles in the far right panel.
In the voxel-level comparisons, GRN showed greater rates of atrophy than C9ORF72, MAPT and sporadic FTD in precuneus, posterior cingulate, inferior parietal lobe and lateral temporal lobe, as well as prefrontal cortex (Figure 2). No other voxel-level differences in rates of atrophy were observed across groups.
Figure 2. Voxel-level maps showing regions of increased rates of atrophy in the GRN group compared to the MAPT, C9ORF72 and sporadic FTD groups.
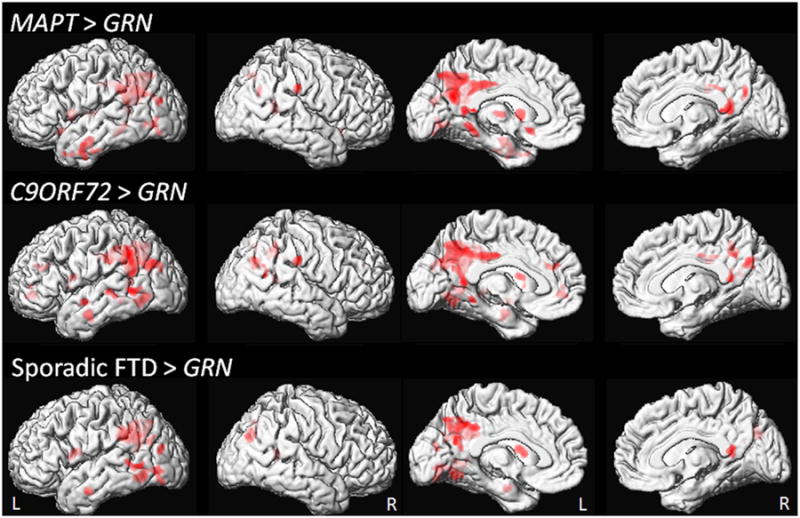
Results are shown on medial and lateral renderings of the brain at p<0.001 with an extent threshold of 200 voxels.
Sample size estimates
The smallest sample size estimates were obtained with rate of temporal lobe atrophy in GRN, followed by rate of ventricular expansion, where 51 and 61 subjects respectively would be required per treatment arm to detect a 20% treatment effect (Table 3). Rate of ventricular expansion provided the smallest sample size estimates in both MAPT and C9ORF72 groups providing sample size estimates of 191 subjects in MAPT and 56 subjects in C9ORF72. Rate of whole brain atrophy provided the smallest sample size in sporadic FTD, with 87 subjects required per treatment arm to detect a 20% treatment effect.
Table 3. Estimated sample size per arm needed to detect a 20% improvement in atrophy rate with 80% power assuming a two-sided alpha of 5% in a 12 month trial.
| Outcome measure | GRN | MAPT | C9ORF72 | Sporadic FTD |
|---|---|---|---|---|
| Whole brain BSI | 102 | 238 | 135 | 87 |
| Ventricular BSI | 61 | 191 | 56 | 119 |
| Frontal lobe | 112 | 462 | 274 | 140 |
| Temporal lobe | 51 | 343 | 123 | 197 |
| Parietal lobe | 89 | 723 | 190 | 249 |
| Occipital lobe | 180 | 3144 | 258 | 668 |
BSI = boundary shift integral
Discussion
In this detailed longitudinal study utilizing 198 serial MRI, we demonstrate that regional rates of atrophy differ across genetic and sporadic variants of FTD and show that different imaging biomarkers may offer advantages in the different variants of FTD.
Subjects with GRN mutations showed the fastest rates of atrophy, with particularly fast rates in parietal lobes. These results concur with previous studies that have found fast rates of whole brain atrophy [8, 12] and parietal loss on cross-sectional MRI[8, 10] in GRN; suggesting that change over time is occurring in the same set of regions that are affected cross-sectionally. Striking asymmetry is also a common finding in GRN[8, 11], and we did indeed observe asymmetric rates of atrophy in this group. The preference for the left hemisphere likely explains why a number of GRN subjects presented with primary progressive aphasia. However, when the analysis was limited to bvFTD, we no longer observed asymmetric rates which is at odds with our cross-sectional findings[11]. It is possible that while some asymmetry may exist early in these subjects, atrophy later in the disease occurs in a more symmetric fashion over time.
MAPT and C9ORF72 showed the slowest overall rates of atrophy, suggesting these are relatively slowly progressive variants of FTD. Both groups showed the fastest rates of atrophy in the frontotemporal lobes. Repeat expansions in C9ORF72 have previously been associated with small volumes of cerebellum and occipital lobe on cross-sectional studies[11], and we similarly found increased rates of atrophy in these regions compared to MAPT. However, we did not find any evidence that C9ORF72 was associated with increased rates of atrophy in the thalamus or sensorimotor cortex compared to the other FTD groups, even though small volumes have been reported in these structures in cross-sectional studies[7, 9]. The findings in MAPT concur with the fact that the frontal and temporal lobes are typically atrophic in subjects with MAPT. Cross-sectional data, however, identified the temporal lobes as having the greatest amount of atrophy[8, 26]. This discordance could suggest that the temporal lobes are already so atrophic at baseline in MAPT subjects that rates of atrophy have started to slow, with little tissue left to loose. Alternatively, temporal lobe atrophy could be an early feature of MAPT subjects, with the frontal lobes starting to become more involved as the disease progresses.
The sporadic FTD group showed disproportionately fast rates of atrophy in the frontal lobes, particularly the anterior cingulate gyrus. While these findings concord with the fact that the majority of these subjects presented with bvFTD, the findings were not confounded by clinical syndrome. We still observed greater rates of anterior cingulate atrophy in sporadic FTD compared to MAPT and C9ORF72 across the bvFTD subjects. Involvement of the anterior cingulate therefore seems to be particularly associated with sporadic forms of bvFTD and FTD with ALS.
Importantly, the sample size analysis allowed us to assess the potential utility of these MRI measures for clinical treatment trials. Regional rates of atrophy provided larger sample size estimates compared to whole brain and ventricular rates across all groups, except for GRN in which rate of temporal atrophy provided the smallest sample size estimates. The rate of temporal atrophy outperformed the rate of parietal atrophy in GRN due to a smaller degree of variance in this measure (standard deviation of 0.019 versus 0.033). Temporal rates of atrophy may therefore have utility for clinical treatment trials including subjects with GRN mutations. In general, however, rates of ventricular expansion appear to hold the most promise as a potential outcome measure across all variants of FTD, and hence should be the outcome measure of choice if a single metric is required. This may, in part, be driven by reduced disease-related variability and measurement error for ventricular volume which can be measured with a high degree of accuracy and may be less affected by variability in lobar patterns of atrophy.
One major advantage of our study was the fact that we analyzed a large number of serial MRI that had been collected over 20 years and therefore reflects a highly rare and valuable cohort. While variability may exist across specific mutations within the GRN and MAPT groups, cross-sectional studies have found relatively consistent imaging patterns across mutations[26]. We also confirmed the majority of our findings in the analysis limited to only bvFTD. Given the duration of study, the MRI were inevitably performed on a number of different scanners. However, all MRI were performed on GE Signa scanners with identical gradients and head coils and all scanners underwent a standardized quality control calibration procedure daily. A limitation of the study was the limited length of follow-up and relatively small number of subjects in each mutation group.
In summary, our data show that regional rates of atrophy differ subtly across genetic and sporadic FTD. Our findings support the utility of using regional and global volume measurements as longitudinal outcome measures in future experimental drug trials in sporadic and familial FTD. Future studies will be needed to determine whether they may also be good presymptomatic biomarkers of disease.
Supplementary Material
Acknowledgments
Funding: This study was funded by NIH grants P50-AG016574, R01-AG11378, P50 NS072187, R01 NS065782 and R01 NS080882.
Footnotes
Disclosure of Conflicts of Interest: None
References
- 1.Hutton M, Lendon CL, Rizzu P, et al. Association of missense and 5′-splice-site mutations in tau with the inherited dementia FTDP-17. Nature. 1998;393:702–705. doi: 10.1038/31508. [DOI] [PubMed] [Google Scholar]
- 2.Baker M, Mackenzie IR, Pickering-Brown SM, et al. Mutations in progranulin cause tau-negative frontotemporal dementia linked to chromosome 17. Nature. 2006;442:916–919. doi: 10.1038/nature05016. [DOI] [PubMed] [Google Scholar]
- 3.Cruts M, Gijselinck I, van der Zee J, et al. Null mutations in progranulin cause ubiquitin-positive frontotemporal dementia linked to chromosome 17q21. Nature. 2006;442:920–924. doi: 10.1038/nature05017. [DOI] [PubMed] [Google Scholar]
- 4.Dejesus-Hernandez M, Mackenzie IR, Boeve BF, et al. Expanded GGGGCC Hexanucleotide Repeat in Noncoding Region of C9ORF72 Causes Chromosome 9p-Linked FTD and ALS. Neuron. 2011 doi: 10.1016/j.neuron.2011.09.011. [DOI] [PMC free article] [PubMed] [Google Scholar]
- 5.Renton AE, Majounie E, Waite A, et al. A Hexanucleotide Repeat Expansion in C9ORF72 Is the Cause of Chromosome 9p21-Linked ALS-FTD. Neuron. 2011 doi: 10.1016/j.neuron.2011.09.010. [DOI] [PMC free article] [PubMed] [Google Scholar]
- 6.Boxer AL, Boeve BF. Frontotemporal dementia treatment: current symptomatic therapies and implications of recent genetic, biochemical, and neuroimaging studies. Alzheimer Dis Assoc Disord. 2007;21:S79–87. doi: 10.1097/WAD.0b013e31815c345e. [DOI] [PubMed] [Google Scholar]
- 7.Mahoney CJ, Beck J, Rohrer JD, et al. Frontotemporal dementia with the C9ORF72 hexanucleotide repeat expansion: clinical, neuroanatomical and neuropathological features. Brain. 2012;135:736–750. doi: 10.1093/brain/awr361. [DOI] [PMC free article] [PubMed] [Google Scholar]
- 8.Rohrer JD, Ridgway GR, Modat M, et al. Distinct profiles of brain atrophy in frontotemporal lobar degeneration caused by progranulin and tau mutations. Neuroimage. 2010;53:1070–1076. doi: 10.1016/j.neuroimage.2009.12.088. [DOI] [PMC free article] [PubMed] [Google Scholar]
- 9.Sha SJ, Takada LT, Rankin KP, et al. Frontotemporal dementia due to C9ORF72 mutations: clinical and imaging features. Neurology. 2012;79:1002–1011. doi: 10.1212/WNL.0b013e318268452e. [DOI] [PMC free article] [PubMed] [Google Scholar]
- 10.Whitwell JL, Jack CR, Jr, Boeve BF, et al. Voxel-based morphometry patterns of atrophy in FTLD with mutations in MAPT or PGRN. Neurology. 2009;72:813. doi: 10.1212/01.wnl.0000343851.46573.67. [DOI] [PMC free article] [PubMed] [Google Scholar]
- 11.Whitwell JL, Weigand SD, Boeve BF, et al. Neuroimaging signatures of frontotemporal dementia genetics: C9ORF72, tau, progranulin and sporadics. Brain. 2012;135:794–806. doi: 10.1093/brain/aws001. [DOI] [PMC free article] [PubMed] [Google Scholar]
- 12.Whitwell JL, Weigand SD, Gunter JL, et al. Trajectories of brain and hippocampal atrophy in FTD with mutations in MAPT or GRN. Neurology. 2011;77:393–398. doi: 10.1212/WNL.0b013e318227047f. [DOI] [PMC free article] [PubMed] [Google Scholar]
- 13.Gass J, Cannon A, Mackenzie IR, et al. Mutations in progranulin are a major cause of ubiquitin-positive frontotemporal lobar degeneration. Hum Mol Genet. 2006;15:2988–3001. doi: 10.1093/hmg/ddl241. [DOI] [PubMed] [Google Scholar]
- 14.Neary D, Snowden JS, Gustafson L, et al. Frontotemporal lobar degeneration: a consensus on clinical diagnostic criteria. Neurology. 1998;51:1546–1554. doi: 10.1212/wnl.51.6.1546. [DOI] [PubMed] [Google Scholar]
- 15.Josephs KA, Parisi JE, Knopman DS, Boeve BF, Petersen RC, Dickson DW. Clinically undetected motor neuron disease in pathologically proven frontotemporal lobar degeneration with motor neuron disease. Arch Neurol. 2006;63:506–512. doi: 10.1001/archneur.63.4.506. [DOI] [PubMed] [Google Scholar]
- 16.Gorno-Tempini ML, Hillis AE, Weintraub S, et al. Classification of primary progressive aphasia and its variants. Neurology. 2011;76:1006–1014. doi: 10.1212/WNL.0b013e31821103e6. [DOI] [PMC free article] [PubMed] [Google Scholar]
- 17.McKhann G, Drachman D, Folstein M, Katzman R, Price D, Stadlan EM. Clinical diagnosis of Alzheimer's disease: report of the NINCDS-ADRDA Work Group under the auspices of Department of Health and Human Services Task Force on Alzheimer's Disease. Neurology. 1984;34:939–944. doi: 10.1212/wnl.34.7.939. [DOI] [PubMed] [Google Scholar]
- 18.Jack CR, Jr, Lowe VJ, Senjem ML, et al. 11C PiB and structural MRI provide complementary information in imaging of Alzheimer's disease and amnestic mild cognitive impairment. Brain. 2008;131:665–680. doi: 10.1093/brain/awm336. [DOI] [PMC free article] [PubMed] [Google Scholar]
- 19.Lewis EB, Fox NC. Correction of differential intensity inhomogeneity in longitudinal MR images. Neuroimage. 2004;23:75–83. doi: 10.1016/j.neuroimage.2004.04.030. [DOI] [PubMed] [Google Scholar]
- 20.Freeborough PA, Fox NC. The boundary shift integral: an accurate and robust measure of cerebral volume changes from registered repeat MRI. IEEE Trans Med Imaging. 1997;16:623–629. doi: 10.1109/42.640753. [DOI] [PubMed] [Google Scholar]
- 21.Gunter JL, Shiung MM, Manduca A, Jack CR., Jr Methodological considerations for measuring rates of brain atrophy. J Magn Reson Imaging. 2003;18:16–24. doi: 10.1002/jmri.10325. [DOI] [PMC free article] [PubMed] [Google Scholar]
- 22.Avants BB, Epstein CL, Grossman M, Gee JC. Symmetric diffeomorphic image registration with cross-correlation: evaluating automated labeling of elderly and neurodegenerative brain. Med Image Anal. 2008;12:26–41. doi: 10.1016/j.media.2007.06.004. [DOI] [PMC free article] [PubMed] [Google Scholar]
- 23.Jack CR, Jr, Wiste HJ, Knopman DS, et al. Rates of beta-amyloid accumulation are independent of hippocampal neurodegeneration. Neurology. 2014;82:1605–1612. doi: 10.1212/WNL.0000000000000386. [DOI] [PMC free article] [PubMed] [Google Scholar]
- 24.Tzourio-Mazoyer N, Landeau B, Papathanassiou D, et al. Automated anatomical labeling of activations in SPM using a macroscopic anatomical parcellation of the MNI MRI single-subject brain. Neuroimage. 2002;15:273–289. doi: 10.1006/nimg.2001.0978. [DOI] [PubMed] [Google Scholar]
- 25.Pinheiro JC, Bates DM. Mixed-effects models in S and S-PLUS. New York: Springer; 2000. [Google Scholar]
- 26.Whitwell JL, Jack CR, Jr, Boeve BF, et al. Atrophy patterns in IVS10+16, IVS10+3, N279K, S305N, P301L, and V337M MAPT mutations. Neurology. 2009;73:1058–1065. doi: 10.1212/WNL.0b013e3181b9c8b9. [DOI] [PMC free article] [PubMed] [Google Scholar]
Associated Data
This section collects any data citations, data availability statements, or supplementary materials included in this article.