

Abstract
Background
Previous findings on the association of statins, plasma lipids, and Parkinson’s disease are confounded by the fact that statins also affect lipid profiles. We prospectively examined plasma lipids and statin use in relation to Parkinson’s disease in the Atherosclerosis Risk in Communities (ARIC) Study.
Methods
Statin use and plasma lipids were assessed at baseline (Visit 1, 1987–89) and at three triennial visits thereafter (Visits 2–4) until 1998. Potential Parkinson’s cases were identified from multiple sources and validated where possible. The primary analysis was limited to incident Parkinson’s cases diagnosed between 1998 and 2008. Odds ratios and 95% confidence intervals were derived from multivariate logistic regression models.
Results
Statin use was rare at baseline (0.57%) but increased to 11.2% at Visit 4. During this time frame, total-cholesterol levels decreased, particularly among statin users. Fifty-six Parkinson’s cases were identified after 1998. Statin use before 1998 was associated with significantly higher Parkinson’s risk after 1998 (Odds ratio = 2.39, 95% Confidence interval 1.11–5.13) after adjusting for total-cholesterol and other confounders. Conversely, higher total-cholesterol was associated with lower risk for Parkinson’s after adjustment for statin usage and confounders. Compared to the lowest tertile of average total-cholesterol, the odds ratios for Parkinson’s were 0.56 (0.30–1.04) for the second and 0.43 (0.22–0.87) for the third tertile (Ptrend=0.02).
Conclusions
Statin use may be associated with a higher Parkinson’s risk, whereas higher total cholesterol may be associated with lower risk. These data are inconsistent with the hypothesis that statins are protective against Parkinson’s disease.
Keywords: Parkinson’s disease, cholesterol, statin, cohort study
Introduction
Since FDA approval in 1987, statins have proved to be effective drugs for lowering cholesterol levels, and offer clear cardiovascular benefits in at-risk populations. Approximately 43 million adults in the US receive or are eligible for statin therapy, and this number is expected to increase to 56 million in the US and 920 million worldwide based on new heart disease and stroke prevention guidelines 1;2. Recently, preclinical data suggested that statins may have anti-inflammatory properties,3 and may reduce intraneuronal α-synuclein aggregation in in vitro and in vivo models 4;5.
The epidemiological evidence on statin use and Parkinson’s disease (PD) has been inconsistent, although several studies reported that statin use was associated with lower PD risk 6–10. The interpretation of these epidemiological data is, however, not straightforward. All but one 11 of these studies failed to account for an important potential confound, to wit, that higher total or LDL cholesterol may lead to statin treatment. Indeed, several case-control 12–14 and prospective studies 15;16 suggest that higher serum/plasma total- and/or LDL-cholesterol levels are related to lower PD occurrence. Therefore, statin usage may merely be a marker of higher total- and/or LDL-cholesterol levels, possibly the real factor related to a lower risk for PD. If so, long-term statin usage also may lead to a higher PD risk by lowering plasma cholesterol levels. Given the increasing use of statins and an aging society, addressing these competing hypotheses is both timely and critical. In this study, we investigated the relationship of statin use, plasma cholesterol, and PD in the ongoing, prospective Atherosclerosis Risk in Communities (ARIC) study.
Methods
Study Population
The ARIC study, originally designed to examine cardiovascular risk factors in four US communities, is an ongoing multi-center longitudinal study with over 25 years of follow-up 17. Between 1987 and 1989, the study recruited 15,792 participants aged 45–64 years by probability sampling. At baseline, all enrollees had blood drawn as part of a clinical examination and provided information on lifestyle and diet. In the next nine years, the cohort had three triennial clinical visits (Visits 2–4) with the last one in 1996–1998. At each visit, blood was drawn, and all medications used during the prior two weeks were recorded and electronically coded. At Visit 4, all participants were asked whether they had ever been diagnosed with PD, and, if yes, the year of diagnosis. In addition to these clinical visits, the cohort has also had annual follow-up calls (AFU) and community-wide surveillance on hospitalizations and death. At the 2006–2008 AFU, participants were asked again to report all medications used in the prior two weeks. The comprehensive community surveillance network involved all area hospitals. During follow-up, all hospitalizations were identified with discharge diagnoses coded according to the International Classification of Diseases (ICD). Deaths during follow-up were identified via annual search of the National Death Index, and causes of death were ICD coded. The hospitalization and death follow-up for this specific analysis was through December 31, 2007. Participants were excluded if: they had consented only to cardiovascular research; had a race other than black or white; used antipsychotic drugs; were unconfirmed for PD diagnosis; or had missing cholesterol measurements. This left 15,291 participants eligible for the current analysis. The ARIC study was approved by the institutional review boards from all study sites, and written informed consent was obtained from every participant.
PD case identification and confirmation
Potential PD cases in ARIC were ascertained in 2010 from the following sources: A) use of typical antiparkinsonian medication (carbidopa/levodopa, dopamine agonist, monoamine oxidase B inhibitor, amantadine, and/or anticholinergic drugs) at any of the four clinical visits between 1987 and 1998, or at the 2006–2008 AFU calls; B) self-reported PD in Visit 4; C) ICD code of PD (332.0 for ICD9 or G20 for ICD10) on hospitalization discharge; and D) PD noted on death certificate. After excluding 156 participants who took drugs that might induce parkinsonism (i.e., first-generation antipsychotics, metoclopramide, etc.), 293 possible PD cases were identified and underwent a confirmation process that is described in detail in Figure 1. Briefly, trained interviewers first called participants or their proxies to confirm or refute a diagnosis of PD. For those who were confirmed, we further administered a structured phone interview that asked for age at diagnosis, whether the diagnosis was made by a neurologist or movement disorder specialist, major complaints that led to the diagnosis, and the PD medications that were used and the subsequent therapeutic response. Of these 293 participants, 95 did not respond, 110 denied PD, and 88 confirmed PD diagnosis. We then contacted the treating physician of all 88 self-confirmed cases to fill out a short form on their PD signs and symptoms and diagnostic history, and asked them to provide a copy of relevant medical record. Fifty-one physicians responded.
Figure 1.

Schematic of PD identification and validation process in Atherosclerosis Risk in Community Study (ARIC).
The study movement disorder specialist (XH) reviewed all data from patients or their proxies, and the treating physicians. PD diagnosis was considered probable if: 1) patients self-confirmed the PD diagnosis which was further confirmed either by the treating physician or via medical record review by the study movement disorder specialist (n=42), or 2) patients self-confirmed the diagnosis but there was no information from a treating physician, the study movement disorder specialist reviewed medical history provided by patients or proxies and concurred with patients’ report (n=31). We considered these 73 as probable cases and described their characteristics in Supplemental Table 1. For the rest whose diagnoses were not denied by patients or their treating physicians, we further considered the following 33 individuals as possible cases: 1) two or more sources mentioned above indicated a PD diagnosis (n=21); or 2) two or more hospitalizations occurred with PD listed as a discharge diagnosis, or PD medication was used at any of the first four visits and also at the 2006–2008 AFU (n=12). This process resulted in a total of 106 PD cases. For the year of diagnosis, we used the earliest date from the self-report (n=72), medication history (n=13), or hospitalization record (n=21).
Measurement of statin usage, lipid profiles, and potential confounders
Use of statins and other cholesterol-lowering drugs (i.e., unspecified antihyperlipidemics, bile sequestrants, or fibrates) was determined from medication lists obtained from all four study visits. Among eligible participants at baseline, primarily due to loss in follow-up, statin use data were missing on 1,375 during Visit 2, 2,797 during Visit 3, and 3,997 during Visit 4.
Details on blood collection, handling, and storage have been published previously 18. Total plasma cholesterol and triglycerides were measured by enzymatic methods as previously described 19. HDL-cholesterol was measured following dextran-magnesium precipitation of non-HDL lipoproteins, and LDL-cholesterol was calculated using the Friedwald equation: .
Statins are often used for diabetes and coronary heart disease (CHD), and both diseases increase mortality that contributes to the patients who were lost in follow-up. Therefore, prevalent cases of both diseases were identified for each of the clinical visits. Diabetes was defined as a fasting glucose concentration of ≥ 126 mg/dL, a non-fasting glucose concentration of ≥ 200 mg/dL (measured during Visits 2–4), use of diabetes medication, or a self-reported physician’s diagnosis of diabetes. CHD was defined as a non-fatal myocardial infarct (MI), a silent MI identified from the electrocardiogram, coronary bypass or coronary angioplasty, or self-reported history. Other potential confounders were primarily obtained from baseline survey, including age, sex, race, smoking status, and caffeine intake 20.
Data analysis
Because statin usage was rare at baseline in 1987–1989 but increased dramatically with time, we defined statin use as any use during Visits 1–4. We categorized plasma lipids (total cholesterol, LDL, HDL, triglycerides) into tertiles. Odds ratios (OR) and 95% confidence intervals (CI) were derived from multivariate logistic regression models. We first examined the relationship between any statin use during Visits 1–4 and PD risk after 1998, adjusting for baseline age (years), gender, race (white vs. black), smoking status (never, past, current), and caffeine intake (tertile). To examine the potential confounding by cholesterol levels, we further adjusted for either baseline or average cholesterol levels of Visits 1–4. An additional model was further adjusted for diabetes and CHD as defined above. Finally, to account for missing observations on statin use, we conducted a conservative sensitivity analysis that defined these participants as non-users. In addition to statin use, we also evaluated associations of use of other cholesterol lowering drugs during Visits 1–4 in relation to PD risk after 1998.
In the analysis of total cholesterol and other plasma lipids, two sets of exposures of interest were defined as tertiles: 1) baseline levels which were mostly before any statin use and about nine years before identification of first PD cases; and 2) the average levels across four visits which may better represent long-term cholesterol exposure before PD diagnosis. The regression analyses were carried out with and without adjusting for statin use. In all analyses, Ptrend was estimated by including lipids levels as continuous variables.
We first conducted the analyses with all cases and then repeated primary analyses after excluding cases with possible PD. All statistical analyses were performed using SAS software (Version 9.3, The SAS Institute, Cary, NC). Statistical tests were considered significant with two sided α = 0.05.
Results
Demographic description
Overall, PD cases were older than controls, more likely to be male and white. Patterns were similar for cases diagnosed before or after 1998. At baseline, PD cases were less likely to smoke and had lower caffeine intake (Table 1). Using all PD cases identified after baseline, compared with baseline never smokers, the ORs were 0.58 (0.37–0.91) for past smokers, and 0.31 (0.16–0.59) for current smokers after adjustment for age, sex, and race. The patterns were similar for cases diagnosed before or after 1998. The ORs for baseline caffeine intake and all incident cases was 1.0 for the lowest tertile (reference), 0.60 (0.37–0.98) for the second tertile and 0.66 (0.39–1.08) for the highest tertile. The association, however, was observed mainly for cases diagnosed before 1998.
Table 1.
Population characteristics of the Atherosclerosis Risk in Communities study
| Characteristic* | PD before 1998 (n=42) | PD after 1998 (n=56) | No PD (n=15,193) | ||||
|---|---|---|---|---|---|---|---|
| % | Mean (SD) | % | Mean (SD) | % | Mean (SD) | ||
| Age | (year) | 57.5 (5.1) | 55.2 (6.1) | 54.2 (5.8) | |||
| Sex | Men | 69.0 | 62.5 | 44.8 | |||
| Race | White | 83.3 | 85.7 | 73.0 | |||
| Black | 16.7 | 14.3 | 27.0 | ||||
| Smoking status | Past smokers | 38.1 | 32.1 | 32.2 | |||
| Current smokers | 11.9 | 10.7 | 26.2 | ||||
| Caffeine intake (mg/day) | 209.1 (275.4) | 287.6 (294.6) | 286.9 (293.8) | ||||
| Plasma Lipid Levels (mM) | |||||||
| total cholesterol | Visit 1 | 5.6 (1.0) | 5.3 (1.1) | 5.6 (1.1) | |||
| triglycerides | Visit 1 | 1.6 (1.0) | 1.6 (0.7) | 1.5 (0.9) | |||
| HDL-cholesterol | Visit 1 | 1.3 (0.5) | 1.2 (0.4) | 1.3 (0.4) | |||
| LDL-cholesterol | Visit 1 | 3.6 (0.9) | 3.4 (1.0) | 3.6 (1.0) | |||
| Statins usage from Visits 1–4 | Yes | 19.0 | 17.9 | 10.3 | |||
| No | 57.1 | 66.1 | 73.8 | ||||
| Missing | 23.8 | 16.1 | 15.9 | ||||
| No statin cholesterol lower drug use from Visits 1–4 | Yes | 4.8 | 5.4 | 5.1 | |||
| No | 69.0 | 78.6 | 79.1 | ||||
| Missing | 26.2 | 16.1 | 15.9 | ||||
| Average Plasma Lipid Levels (mM) | |||||||
| total cholesterol | Visits 1–4 | 5.4 (0.9) | 5.1 (0.9) | 5.4 (0.9) | |||
| triglycerides | Visits 1–4 | 1.6 (0.8) | 1.6 (0.7) | 1.6 (0.9) | |||
| HDL-cholesterol | Visits 1–4 | 1.3 (0.4) | 1.2 (0.3) | 1.3 (0.4) | |||
| LDL-cholesterol | Visits 1–4 | 3.4 (0.8) | 3.2 (0.8) | 3.4 (0.8) | |||
| Diabetes identified from Visits 1–4 | Yes | 31.0 | 21.4 | 21.6 | |||
| No | 54.8 | 64.3 | 65.9 | ||||
| Missing | 14.3 | 14.3 | 12.4 | ||||
| Coronary Heart Disease (CHD) identified from Visits 1–4 | Yes | 11.9 | 10.7 | 9.2 | |||
| No | 57.1 | 75.0 | 75.2 | ||||
| Missing | 31.0 | 14.3 | 15.6 | ||||
All data are collected at baseline unless specified. Basic statistics (mean, SD) are presented for continuous variables, and proportions are presented for categorical variables
Statin usage and dynamic changes of plasma total cholesterol
Few participants (0.57%) reported statin use at baseline, but use steadily increased over time (2.4%, 5.5%, 11.2% for Visits 2–4, respectively, Figure 2A). The average total-cholesterol level decreased over time in the cohort, and statin users overall had higher baseline total cholesterol and experienced larger drop than non-statin users (Figure 2B). As a result, the cholesterol difference between statin and no-statin users narrowed during the course of the follow-up. PD cases identified after 1998 had lower baseline total-cholesterol levels compared either to cases identified before 1998 or non-PD participants (Figure 2C). The PD cases identified before 1998 seemed to have faster decrease in total-cholesterol compared to the other two groups.
Figure 2.
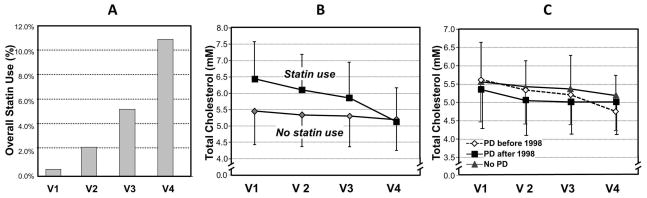
The changes of statin usage (Panel A) and plasma total-cholesterol levels in Atherosclerosis Risk in Community Study (ARIC) stratified by statin usage (Panel B) and Parkinson’s disease (Panel C) status.
The association of statin use with PD occurrence
After adjusting for age, sex, race, smoking, and caffeine intake, statin use was associated with a higher risk for PD after 1998 (Table 2) that was not statistically significant, but which was statistically significant when adjusted for average or baseline total cholesterol levels. This association persisted in a conservative sensitivity analysis that classified participants who were “unknown” for statin usage as non-statin users [OR=2.30 (1.09–4.86) in the fully adjusted model]. The association appears to be even stronger among participants who were in the highest tertile of total-cholesterol in at least one of the four clinical visits [OR = 3.12 (1.20–8.13) in the fully adjusted model]. These associations also persisted in the sensitivity analyses that excluded cases with a definition of “possible PD” (Supplemental Table 2).
Table 2.
The association between statin usage during clinical visits 1–4 (1987–1998) and PD risk after 1998
| Model | PD | Non-PD | OR (95%C.I.) | P value | |
|---|---|---|---|---|---|
| Basic model* | No | 37 | 11208 | 1.00 | |
| Yes | 10 | 1564 | 1.81 (0.89–3.67) | 0.10 | |
| Don’t know | 9 | 2421 | 1.46 (0.69–3.10) | 0.32 | |
| Further adjusted for baseline total cholesterol | No | 37 | 11208 | 1.00 | |
| Yes | 10 | 1564 | 2.32 (1.11–4.87) | 0.03 | |
| Don’t know | 9 | 2421 | 1.47 (0.69–3.11) | 0.32 | |
| Further adjusted for average total cholesterol across Visits 1–4 | No | 37 | 11208 | 1.00 | |
| Yes | 10 | 1564 | 2.21 (1.07–4.58) | 0.03 | |
| Don’t know | 9 | 2421 | 1.54 (0.73–3.26) | 0.26 | |
| Further adjusted for average total cholesterol, diabetes, and coronary heart disease | No | 37 | 11208 | 1.00 | |
| Yes | 10 | 1564 | 2.39 (1.11–5.13) | 0.03 | |
| Don’t know | 9 | 2421 | 1.51 (0.27–8.63) | 0.64 | |
Adjusted for age, gender, race, smoking and caffeine intake
In contrast to statin use, the use of non-statin cholesterol lowering drugs (6.0% of the cohort) during Visits 1–4 was not related to PD risk after 1998 [OR users vs. non-users = 0.81 (0.23–2.80)] after adjusting for all potential confounders and statin use]. After adjusting for age, sex, race, smoking, and caffeine intake, statin use was not associated with PD [OR: 1.82 (0.78–4.26)] for cases identified before 1998, and this number did not significantly change after further adjusting the average or baseline total cholesterol levels.
Associations between plasma lipids and PD risk
Higher level of average total cholesterol was associated with lower risk for PD (Table 3). After adjusting for statin usage and other potential confounders, the OR comparing the highest versus the lowest tertile was 0.43 (0.22–0.87, Ptrend=0.02). Similar results were also observed for baseline total-cholesterol level, although the Ptrend was only of borderline statistical significance (p=0.06). Similar results were also observed for LDL cholesterol, but not for HDL or triglyceride (Table 2). The same direction was found in the sensitivity analyses that excluded cases with a definition of “possible PD” (Supplemental Table 3). There are no significant associations between average lipid and PD cases identified prior to 1998 (data not shown).
Table 3.
Association between average lipid levels of clinical visits 1–4 (1987–1998) and PD risk after 1998
| Plasma lipids | PD | No PD | Basic model* | Further adjusted for statin usage | |||
|---|---|---|---|---|---|---|---|
| OR (95% CI) | ptrend | OR (95% CI). | ptrend | ||||
| Total cholesterol | Tertile 1 | 27 | 4993 | 1.00 | 0.05 | 1.00 | 0.02 |
| Tertile 2 | 16 | 5023 | 0.59 ( 0.31–1.09) | 0.56 (0.30–1.04) | |||
| Tertile 3 | 13 | 5177 | 0.50 (0.25–0.98) | 0.43 (0.22–0.87) | |||
| Triglycerides | Tertile 1 | 14 | 4995 | 1.00 | 0.75 | 1.00 | 0.98 |
| Tertile 2 | 19 | 5035 | 1.25 (0.62–2.50) | 1.21 (0.60–1.44) | |||
| Tertile 3 | 23 | 5163 | 1.37 (0.70–2.71) | 1.27 (0.64–2.53) | |||
| HDL-cholesterol | Tertile 1 | 26 | 4993 | 1.00 | 0.07 | 1.00 | 0.11 |
| Tertile 2 | 18 | 5016 | 0.80 (0.43–1.50) | 0.83 (0.44–1.55) | |||
| Tertile 3 | 12 | 5184 | 0.60 (0.28–1.28) | 0.64 (0.30–1.38) | |||
| LDL-cholesterol | Tertile 1 | 23 | 4992 | 1.00 | 0.11 | 1.00 | 0.05 |
| Tertile 2 | 21 | 4995 | 0.84 (0.46–1.52) | 0.79 (0.43–1.44) | |||
| Tertile 3 | 12 | 5158 | 0.49 (0.24–0.99) | 0.43 (0.21–0.88) | |||
Adjusted for age, gender, race, smoking and caffeine intake
Discussion
This study evaluated the complex relationship of statin, cholesterol and PD risk. The main strengths of this analysis are the availability of cholesterol data before the wide use of statins, and the repeated measurements of cholesterol levels over a nine-year period. Overall, we found that statin use was associated with a higher PD risk, and higher plasma levels of total or LDL cholesterol tended to be associated with a lower PD risk.
Past epidemiological studies on the statin-PD link have, on the surface, been inconsistent. Several reported a lower PD risk among statin users 6–8;11 and a higher PD risk among discontinued users 9, whereas others found a null association 21–24. These inconsistencies may, in part, be due to the dynamic relationship between lipid levels and statin use and a long prodromal period of PD before diagnosis. Prior studies were largely conducted after 2000 when statins had begun to be used widely to control plasma cholesterol. Most prior studies were cross-sectional or retrospective 7;9;11;21;23;24, although a few were prospective 6;8;22. Interestingly, one study 23 showed significant lower PD risk only among short-term statin users, indicating confounding by indication that statin usage maybe merely a marker of higher baseline cholesterol. Further, Becker et al. 21 found that current statin use was not associated with lower risk for PD (OR 1.06, 95% CI 0.75–1.51, p=0 75), and even suggested that past users who had 30 or more statin prescriptions (equaling five or more years) had a higher PD risk (OR 5.02, 95% CI 0.53–47.38, p=0 16).
In aggregate, the current literature indicates that the association between statins and PD is not straightforward. When evaluating the role of statins in PD, one must take into account that high cholesterol levels may lead to statin use. Only one previous study attempted to account for pre-statin lipid levels and reported an association of statin use with lower PD risk, but not an association between LDL-cholesterol and PD risk 11. This study was, however, limited in that PD cases were identified only through electronic records, and the identified cases were not associated with history of smoking, a widely-replicable factor associated with PD.
To our knowledge, the current study is the first to investigate the statin-PD relationship while accounting for cholesterol levels before statin use (baseline level) and during treatment (average levels between V1–V4). Interestingly, statin use was not statistically associated with PD cases identified before 1998 in the cross-sectional analysis, and its association with cases after 1998 became stronger and statistically significant after taking into account cholesterol levels. This relationship persisted in several sensitivity analyses.
Our findings of an inverse association between total/LDL cholesterol levels and PD are consistent with some 16;25, but not all 26, prior studies. Our data further suggest that statins may even increase PD risk. If these findings are confirmed, they will be of clinical importance and may spur efforts to delineate underlying mechanisms. Cholesterol is rich and important in the CNS, yet it is believed that brain cholesterol is made de novo 27 making the plasma cholesterol-PD link paradoxical. PD is, however, increasingly recognized as a systemic disease that may start in the periphery such as the gut 28. Thus, higher plasma cholesterol may be protective in early PD development via peripheral mechanisms. Alternatively, high plasma cholesterol could merely be a marker of potential neuroprotective substrates such as coenzyme Q10 29,30. Statins were designed as HMG-CoA reductase inhibitors and therefore reduce the biosynthesis of coenzyme Q10 as well as cholesterol. Consistent with this hypothesis, there is anecdotal clinical evidence that statin can induce myopathy and encephalopathy, suggesting adverse effects in both the peripheral and central nervous systems31.
The current study has several limitations. First, PD cases were identified from multiple sources at various time points without a systematic clinical examination. The date of PD diagnosis was imprecise because of the way PD patients were identified. Some cases were likely missed or misdiagnosed, despite our efforts at case confirmation. About one-third of potential cases did not respond to our confirmation request, not surprising for a study with a 20-year span. Despite these limitations, we were able to replicate the known associations for PD with age, gender, and smoking which indirectly support the internal validity of case identification. Further, we obtained similar results when we limited the analysis to probable cases whose diagnoses were either confirmed by the treating physicians or via review of medical record by the study movement disorder specialist. Finally, due to the prospective nature of the study design, outcome misclassification was likely independent of exposure assessment. Second, some 8;9, but not all 21–23 prior studies suggested that the observed inverse association with PD was limited to lipophilic statins. It would be interesting to examine whether the type of statins and duration of use affect PD risk. In our study, however, only ten PD cases reported statin use prior to visit 4, and we did not have information on statin use thereafter, thus preventing meaningful inferences based on available data. Finally, we cannot exclude the possibility of residual confounding despite our adjustment for a number of known PD risk factors along with chronic diseases such as diabetes and cardiovascular heart disease
In summary, the current analysis of PD with repeated cholesterol assays and long follow-up support that higher cholesterol predicts lower risk of PD. Furthermore, our data argue against the hypothesis that statin use confers protection against PD 6–10. Due to the increasing popularity of statin use to decrease cardiovascular risks, these findings of the potential adverse influence of statins on PD incidence/prevalence should be carefully evaluated
Supplementary Material
Acknowledgments
Role of the Funding Sources
This research was in part supported by the Intramural Research Program of the NIH, National Institute of Environmental Health Sciences (Z01-ES-101986). The Atherosclerosis Risk in Communities Study is carried out as a collaborative study supported by National Heart, Lung, and Blood Institute contracts HHSN268201100005C, HHSN268201100006C, HHSN268201100007C, HHSN268201100008C, HHSN268201100009C, HHSN268201100010C, HHSN268201100011C, and HHSN268201100012C. Dr. Xuemei Huang has been currently supported by NIH grants R01 NS060722, R01 ES019672, and U01 NS082151, and a former award (K23 AG21491) provided support at the conception of this research. The authors thank the staff and participants of the ARIC study for their important contributions.
Footnotes
AUTHOR CONTRIBUTIONS
| Author | Study Design | Study Supervision | Acquisition of Data | Analysis & Interpretation | Critical revision & intellectual input to manuscript |
|---|---|---|---|---|---|
| Xuemei Huang | X | X | X | ||
| Alvaro Alonso | X | X | X | X | |
| Xuguang Guo | X | ||||
| David M. Umbach | X | X | |||
| Maya L. Lichtenstein | X | X | |||
| Christie M. Ballantyne | X | X | |||
| Richard B Mailman | X | X | X | ||
| Thomas H. Mosley | X | X | X | X | |
| Honglei Chen | X | X | X |
Declaration of Interests
Dr Huang is currently supported by NIH grants NS060722, ES019672, and NS082151, and by institutional research funds. She treats movement disorders patients (25%), and was a consultant in an unrelated medical case. She has received travel expenses from Medtronics Inc.
Dr Alonso received funding from the National Institutes of Health.
Dr Guo reports no disclosures.
Dr Umbach reports no disclosures.
Dr Lichtenstein reports no disclosures.
Dr. Ballantyne has grant or research support from Abbott, Amarin, Amgen, Eli Lilly, GlaxoSmithKline, Genentech, Merck, Novartis, Pfizer, Regeneron, Roche, Sanofi-Synthelabo, the NIH, and AHA. He has been a consultant for Abbott, Aegerion, Amarin, Amgen, Arena, Cerenis, Esperion, Genentech, Genzyme, Kowa, Merck, Novartis, Pfizer, Resverlogix, Regeneron, Roche, and Sanofi-Synthelabo, and is on the speakers bureau for Abbott.
Dr. Mailman serves on the editorial boards of the Journal of Clinical Investigation, F1000 Research, and the Journal of Biochemical and Molecular Toxicology, and has intellectual property interest related to dopamine receptor ligands and function. Within the past three years, he has received consulting funds from Pfizer Inc. and is or has been a consultant or expert witness on unrelated matters for several law firms.
Dr. Mosley reports no disclosures.
Dr. Chen receives NIH intramural funding (Z01-ES-101986) and serves on the editorial boards of the American Journal of Epidemiology, International Journal of Molecular Epidemiology and Genetics, and American Journal of Neurodegenerative Disease.
References
- 1.Pencina MJ, Navar-Boggan AM, D’Agostino RB, Sr, Williams K, Neely B, Sniderman AD, et al. Application of new cholesterol guidelines to a population-based sample. N Engl J Med. 2014;370(15):1422–1431. doi: 10.1056/NEJMoa1315665. [DOI] [PubMed] [Google Scholar]
- 2.Ioannidis JP. More than a billion people taking statins?: Potential implications of the new cardiovascular guidelines. JAMA. 2014;311(5):463–464. doi: 10.1001/jama.2013.284657. [DOI] [PubMed] [Google Scholar]
- 3.Yan J, Xu Y, Zhu C, Zhang L, Wu A, Yang Y, et al. Simvastatin prevents dopaminergic neurodegeneration in experimental parkinsonian models: the association with anti-inflammatory responses. PLoS One. 2011;6(6):e20945. doi: 10.1371/journal.pone.0020945. [DOI] [PMC free article] [PubMed] [Google Scholar]
- 4.Bar-On P, Crews L, Koob AO, Mizuno H, Adame A, Spencer B, et al. Statins reduce neuronal alpha-synuclein aggregation in in vitro models of Parkinson’s disease. J Neurochem. 2008;105(5):1656–1667. doi: 10.1111/j.1471-4159.2008.05254.x. [DOI] [PMC free article] [PubMed] [Google Scholar]
- 5.Koob AO, Ubhi K, Paulsson JF, Kelly J, Rockenstein E, Mante M, et al. Lovastatin ameliorates alpha-synuclein accumulation and oxidation in transgenic mouse models of alpha-synucleinopathies. Exp Neurol. 2010;221(2):267–274. doi: 10.1016/j.expneurol.2009.11.015. [DOI] [PMC free article] [PubMed] [Google Scholar]
- 6.Gao X, Simon KC, Schwarzschild MA, Ascherio A. Prospective study of statin use and risk of Parkinson disease. Arch Neurol. 2012;69(3):380–384. doi: 10.1001/archneurol.2011.1060. [DOI] [PMC free article] [PubMed] [Google Scholar]
- 7.Wahner AD, Bronstein JM, Bordelon YM, Ritz B. Statin use and the risk of Parkinson disease. Neurology. 2008;70(16 Pt 2):1418–1422. doi: 10.1212/01.wnl.0000286942.14552.51. [DOI] [PMC free article] [PubMed] [Google Scholar]
- 8.Wolozin B, Wang SW, Li NC, Lee A, Lee TA, Kazis LE. Simvastatin is associated with a reduced incidence of dementia and Parkinson’s disease. BMC Med. 2007;5(1):20. doi: 10.1186/1741-7015-5-20. [DOI] [PMC free article] [PubMed] [Google Scholar]
- 9.Lee YC, Lin CH, Wu RM, Lin MS, Lin JW, Chang CH, et al. Discontinuation of statin therapy associates with Parkinson disease: a population-based study. Neurology. 2013;81(5):410–416. doi: 10.1212/WNL.0b013e31829d873c. [DOI] [PubMed] [Google Scholar]
- 10.Tan EK, Tan LC. Holding on to statins in Parkinson disease. Neurology. 2013;81(5):406–407. doi: 10.1212/WNL.0b013e31829d87bb. [DOI] [PubMed] [Google Scholar]
- 11.Friedman B, Lahad A, Dresner Y, Vinker S. Long-term statin use and the risk of Parkinson’s disease. Am J Manag Care. 2013;19(8):626–632. [PubMed] [Google Scholar]
- 12.Huang X, Chen H, Miller WC, Mailman R, Woodard JL, Chen P, et al. Lower LDL cholesterol levels are associated with Parkinson’s disease: a case control study. Movement Disorders. 2007;22(3):377–381. doi: 10.1002/mds.21290. [DOI] [PMC free article] [PubMed] [Google Scholar]
- 13.Scigliano G, Musicco M, Soliveri P, Piccolo I, Ronchetti G, Girotti F. Reduced risk factors for vascular disorders in Parkinson disease patients: a case-control study. Stroke. 2006;37(5):1184–1188. doi: 10.1161/01.STR.0000217384.03237.9c. [DOI] [PubMed] [Google Scholar]
- 14.Miyake Y, Tanaka K, Fukushima W, Sasaki S, Kiyohara C, Tsuboi Y, et al. Case-control study of risk of Parkinson’s disease in relation to hypertension, hypercholesterolemia, and diabetes in Japan. J Neurol Sci. 2010;293(1–2):82–86. doi: 10.1016/j.jns.2010.03.002. [DOI] [PubMed] [Google Scholar]
- 15.Huang X, Abbott RD, Petrovitch H, Mailman RB, Ross GW. Low LDL cholesterol and increased risk of Parkinson’s disease: prospective results from Honolulu-Asia Aging Study. Mov Disord. 2008;23(7):1013–1018. doi: 10.1002/mds.22013. [DOI] [PubMed] [Google Scholar]
- 16.de Lau LM, Koudstaal PJ, Hofman A, Breteler MM. Serum Cholesterol Levels and the Risk of Parkinson’s Disease. Am J Epidemiol. 2006;164(10):998–1002. doi: 10.1093/aje/kwj283. [DOI] [PubMed] [Google Scholar]
- 17.The Atherosclerosis Risk in Communities (ARIC) Study: design and objectives. The ARIC investigators. Am J Epidemiol. 1989;129(4):687–702. [PubMed] [Google Scholar]
- 18.Iribarren C, Sempos CT, Eckfeldt JH, Folsom AR. Lack of association between ferritin level and measures of LDL oxidation: the ARIC study. Atherosclerosis Risk in Communities. Atherosclerosis. 1998;139(1):189–195. doi: 10.1016/s0021-9150(98)00070-7. [DOI] [PubMed] [Google Scholar]
- 19.Sharrett AR, Patsch W, Sorlie PD, Heiss G, Bond MG, Davis CE. Associations of lipoprotein cholesterols, apolipoproteins A-I and B, and triglycerides with carotid atherosclerosis and coronary heart disease. The Atherosclerosis Risk in Communities (ARIC) Study. Arterioscler Thromb. 1994;14(7):1098–1104. doi: 10.1161/01.atv.14.7.1098. [DOI] [PubMed] [Google Scholar]
- 20.Paynter NP, Yeh HC, Voutilainen S, Schmidt MI, Heiss G, Folsom AR, et al. Coffee and sweetened beverage consumption and the risk of type 2 diabetes mellitus: the atherosclerosis risk in communities study. Am J Epidemiol. 2006;164(11):1075–1084. doi: 10.1093/aje/kwj323. [DOI] [PubMed] [Google Scholar]
- 21.Becker C, Jick SS, Meier CR. Use of statins and the risk of Parkinson’s disease: a retrospective case-control study in the UK. Drug Saf. 2008;31(5):399–407. doi: 10.2165/00002018-200831050-00004. [DOI] [PubMed] [Google Scholar]
- 22.Hippisley-Cox J, Coupland C. Unintended effects of statins in men and women in England and Wales: population based cohort study using the QResearch database. BMJ. 2010;340:c2197. doi: 10.1136/bmj.c2197. [DOI] [PMC free article] [PubMed] [Google Scholar]
- 23.Ritz B, Manthripragada AD, Qian L, Schernhammer E, Wermuth L, Olsen J, et al. Statin use and Parkinson’s disease in Denmark. Mov Disord. 2010;25(9):1210–1216. doi: 10.1002/mds.23102. [DOI] [PMC free article] [PubMed] [Google Scholar]
- 24.Samii A, Carleton BC, Etminan M. Statin use and the risk of Parkinson disease: a nested case control study. J Clin Neurosci. 2008;15(11):1272–1273. doi: 10.1016/j.jocn.2008.01.016. [DOI] [PubMed] [Google Scholar]
- 25.Huang X, Chen H, Miller WC, Mailman RB, Woodard JL, Chen PC, et al. Lower low-density lipoprotein cholesterol levels are associated with Parkinson’s disease. Mov Disord. 2007;22(3):377–381. doi: 10.1002/mds.21290. [DOI] [PMC free article] [PubMed] [Google Scholar]
- 26.Hu G, Antikainen R, Jousilahti P, Kivipelto M, Tuomilehto J. Total cholesterol and the risk of Parkinson disease. Neurology. 2008;70(21):1972–1979. doi: 10.1212/01.wnl.0000312511.62699.a8. [DOI] [PubMed] [Google Scholar]
- 27.Pfrieger FW, Ungerer N. Cholesterol metabolism in neurons and astrocytes. Prog Lipid Res. 2011;50(4):357–371. doi: 10.1016/j.plipres.2011.06.002. [DOI] [PubMed] [Google Scholar]
- 28.Chen H, Burton EA, Ross GW, Huang X, Savica R, Abbott RD, et al. Research on the Pre-Motor Symptoms of Parkinson’s Disease: Clinical and Etiological Implications. Environ Health Perspect. 2013 doi: 10.1289/ehp.1306967. [DOI] [PMC free article] [PubMed] [Google Scholar]
- 29.Kaikkonen J, Nyyssonen K, Tuomainen TP, Ristonmaa U, Salonen JT. Determinants of plasma coenzyme Q10 in humans. FEBS Lett. 1999;443(2):163–166. doi: 10.1016/s0014-5793(98)01712-8. [DOI] [PubMed] [Google Scholar]
- 30.Beal MF. Mitochondrial dysfunction and oxidative damage in Alzheimer’s and Parkinson’s diseases and coenzyme Q10 as a potential treatment. J Bioenerg Biomembr. 2004;36(4):381–386. doi: 10.1023/B:JOBB.0000041772.74810.92. [DOI] [PubMed] [Google Scholar]
- 31.Golomb BA, Evans MA. Statin adverse effects : a review of the literature and evidence for a mitochondrial mechanism. Am J Cardiovasc Drugs. 2008;8(6):373–418. doi: 10.2165/0129784-200808060-00004. [DOI] [PMC free article] [PubMed] [Google Scholar]
- 32.Tanner CM, Kamel F, Ross GW, Hoppin JA, Goldman SM, Korell M, et al. Rotenone, paraquat, and Parkinson’s disease. Environ Health Perspect. 2011;119(6):866–872. doi: 10.1289/ehp.1002839. [DOI] [PMC free article] [PubMed] [Google Scholar]
- 33.Chen H, Zhang SM, Hernan MA, Schwarzschild MA, Willett WC, Colditz GA, et al. Nonsteroidal anti-inflammatory drugs and the risk of Parkinson disease. Arch Neurol. 2003;60(8):1059–1064. doi: 10.1001/archneur.60.8.1059. [DOI] [PubMed] [Google Scholar]
Associated Data
This section collects any data citations, data availability statements, or supplementary materials included in this article.