

Abstract
Though immune responses correlate with prognosis in primary colorectal cancer, the role of tumor immunity in metastatic disease is less clear. We hypothesized that patient survival and tumor recurrence correlate with transcriptional evidence of lymphocyte proliferation/activation in resected colorectal cancer liver metastases (CRLM). Microarray gene analysis was performed on liver tumor specimens from 96 patients who underwent resection for CRLM. A Cox proportional hazards model identified genes associated with overall (OS) and recurrence-free survival (RFS). Conventional gene ontology (GO) enrichment analysis ranked biologically relevant processes. Survival probabilities of prioritized processes were assessed. Protein expression was validated with immunohistochemistry in an independent set of patients. GO analysis identified and ranked unique biologic processes that correlated with survival. Genes that specifically functioned in the biologic process of “T-cell proliferation” were significant predictors of OS (p = 0.01) and both “T-cell proliferation” and “activation” were highly associated with RFS (p≤ 0.01). Analysis of genes in these GO categories identified increased TNFSF14/LIGHT expression to be most associated with improved OS and RFS (p ≤ 0.0006). Immunohistochemistry of an independent validation set of CRLM confirmed that both increased tumor-infiltrating lymphocytes (TIL) and higher LIGHT expression on TILs were associated with improved OS and RFS. Differential expression of genes involved in T-cell proliferation/activation was associated with survival outcomes in a large number of surgical patients who underwent resection of CRLM. These biologic functions determined by GO analysis of the tumor microenvironment have identified specific immune-related genes that may be involved in an antitumor immune response.
Introduction
Colorectal cancer is the third leading site of new cancer cases and the second leading source of cancer-related deaths in the United States (1). Metastases to the liver are present in 15-25% of patients at the time of diagnosis and will occur in up to 50% of all patients (2, 3). Only a minority of patients will have resectable tumors, and even when metastases can be excised, the majority of patients will develop recurrent disease (4, 5). For these patients with colorectal liver metastases (CRLM), new therapeutic strategies are needed, and immunotherapeutic approaches may play a significant role.
In clinical practice, the prognosis of primary colorectal cancer is currently predicted by the TNM (Tumor, Node, Metastasis) staging system, though it has been suggested that patient survival and tumor biology are more accurately governed by the type, number and location of lymphocytes invading the primary tumor rather than tumor depth or the number of involved locoregional lymph nodes (6-10). Therefore, the role of the immune system and tumor- infiltrating lymphocytes (TIL) in determining the prognosis of patients with resectable CRLM is also of interest. Our previous studies similarly suggested an association between increased CD4 and CD8 T-cell infiltrates and improved survival in patients with CRLM using immunohistochemical (IHC) analysis of tissue microarrays (11, 12). In primary colon tumors, it is not the density of intratumoral T cells that is critical, but the type, function, and location of TILs that have a greater association with prognosis (7). Specifically, the presence of phenotypically activated and proliferating T cells within the primary tumor appears to be associated with improved survival. Tumors from patients without recurrence had higher immune-cell densities of CD3, CD8, granzyme B (GZMB), and CD45RO on IHC (7, 11). In these experiments, disease recurrence correlated with increased expression of co-modulated genes for Th1 adaptive immunity. Therefore, it appears that cytokines and ligands, including TNFSF14 (LIGHT), in the tumor microenvironment may reflect or contribute to an antitumor immune response (13, 14). LIGHT in particular has shown promise as an immunomodulator that can enhance T-cell and natural killer (NK)-cell proliferation, function, and antitumor responses. Therefore, we sought to further evaluate the nature of the immune response occurring within the tumor microenvironment of CRLM at the transcript level.
In order to develop disease-specific immunologic therapies, further characterization of the immune milieu in metastatic tumors is needed to identify targets that can stimulate an antitumor response. We hypothesized that an environment reflective of an antitumor immune response is prognostic of survival and tested this hypothesis by interrogating resectable CRLM tumors for transcriptional evidence of an immune response in the tumor microenvironment. Our aim was to determine if T-cell proliferation and activation were associated with survival and to identify specific genes governing immune function for future validation and potential therapeutic targeting (15).
Materials and Methods
Patient selection and characteristics
With the approval of the Institutional Review Board, a prospectively maintained hepatobiliary database was used to retrospectively identify patients who underwent complete resection of CRLM at Memorial Sloan-Kettering Cancer Center between 1/2000 and 10/2007 and had fresh frozen tissue procured at the time of resection. Guidelines for resectability were medical fitness for major laparotomy and a resection encompassing all intrahepatic disease with an adequate remnant liver for recovery. All patients underwent liver resection with microscopic negative margins. Patients with extra-hepatic disease were excluded. A clinical-risk score (CRS) from 0-5 was calculated for each patient based on the presence of a node-positive primary colon tumor, >1 liver metastasis, a liver metastasis >5 cm, serum carcinoembryonic antigen (CEA) level >200 ng/mL, and a disease-free interval of <12 months (16). Patients with CRS ≤ 2 have been found to have a more favorable prognosis and improved overall survival (OS) compared to those with CRS ≥ 3 (5, 16). Recurrence-free (RFS) and OS were calculated from the time of resection to first disease recurrence or death, respectively. RFS was assessed by routine radiologic follow-up every 3 to 6 months. OS was ascertained by the clinical follow-up that was documented in the medical record. Each patient's preoperative and postoperative course of chemotherapy was reviewed.
Tumor handling and RNA analysis
Macro-dissection of resected tumors with hematoxylin-eosin (H&E) staining confirmation was used to isolate viable hepatic tumor and minimize stromal and necrotic elements. Specifically, the tumor cells were macrodissected from a selected tumor-rich area of the OCT-embedded tissue block and the area for dissection was selected by the dedicated GI pathologist (J.S.) by histologic examination with (H&E) staining to ensure that more than 70% of tumor cells were viable and the stromal and necrotic elements were minimally included. This technique was used for RNA analysis and in separate specimens for the microarray. Total RNA was extracted from the isolated tissue using TRIzol reagent (Invitrogen, California, USA) according to the manufacturer's protocol. RNA quality was assessed by direct visual inspection of the gel electrophoresis image and by RNA integrity number (RIN) (2100 Bioanalyzer, Agilent Technology, Palo Alto, CA) (17). Ninety-six of 187 samples contained RNA of sufficient quantity and quality for further analysis with RNA integrity number (RIN) ≥ 7. RNA was reverse transcribed to cDNA for hybridization.
Gene array and statistical analysis
Gene array was performed using an Illumina HumanHT-12 expression gene chip containing a total of 47,231 annotated gene probe sets as we have previously reported (Illumina, San Diego, CA) (18). Microarray data were entered in the ArrayExpress database (www.ebi.ac.uk/arrayexpress, E-MTAB-1951). The microarray gene expression data were normalized by the quantile method (19). A Cox proportional hazards model was created to examine the association between the expression value of each gene and patient OS or RFS. Adjusting for multiple hypotheses testing, individual genes associated with survival with p- values ≤ 0.001 were used for gene ontology (GO) enrichment analysis (20). Individual genes are annotated to specific biologic processes and GO enrichment analysis was used to organize the data obtained from gene array analysis in order to determine patterns of gene expression that correlate with specific biologic processes. The biologic process ontology included terms that represented collections of processes as well as terms that represented a specific, entire process. The genetic Expression Analysis Systematic Explorer (EASE) software was utilized for the process of biologic process determination, as previously described and validated (21). The reference genes in the analysis were all the gene symbols in the microarray. Biologic processes with an adjusted EASE score (Jackknife Fisher exact probability) of p ≤ 0.01 were considered statistically significant and multiple comparisons were corrected with the Benjamini false- discovery rate control (FDR) (22). For these biologic themes, the contributing genes to the theme were identified and a binary variable was created by dichotomizing the gene expression values at the 25%, 50% and 75% quantiles. Survival probabilities were estimated using the Kaplan-Meier method, and the Log-Rank test was used to compare the survival curves.
Immunohistochemistry
Ninety-one additional patients who underwent liver resection with the same indications as the test set for isolated CRLM between the period of 1997-2000 that had tissue blocks with minimal necrosis and fibrosis were identified for the validation set. Tissue microarrays (TMA) were constructed following pathologic review and diagnostic confirmation as previously described (12). Tumor-tissue cores measuring 0.6 mm in diameter were made in triplicate from paraffin blocks and processed using the ATA-27 automated arrayer (Beecher Instruments, Sun Prairie, WI). TMA blocks were cut to 5 μm sections and deparaffinized, rehydrated in graded alcohol, and processed. H&E staining was performed using standard protocols for TIL analysis. LIGHT immunostaining was performed with an anti-LIGHT antibody (Abcam, Cambridge, MA, ab57901) that was tested, optimized, and validated on positive controls and human tumor samples by two independent gastroenterology pathologists. TMA sections were stained for LIGHT using the Ventana platform (Tucson, AZ) with slow pH cell conditioning for 60 min and an antibody dilution of 3 ul/mL. Incubation time was 32 minutes at 37 degrees using ultra DAB. Each patient's tumor sample was prepared in triplicates. Amounts of tissue and tumor in each core were quantified by the pathologist. Staining for LIGHT was quantified by the pathologist and graded on a scale of 0-100. The total number of TILs and the number of TILs staining for LIGHT expression were individually counted. Triplicate samples were individually read by a dedicated pathologist blinded to the information regarding replicates, location on the TMA, and clinical data. Every effort was made to reduce variability and to improve comparisons between patient samples. In order to account for slight differences in tissue processing, staining, tumor heterogeneity, and proportions of tumor represented in the microdots, the pathologist quantified the amount of tumor in the microdot. For each microdot, the number of TILs in tumor tissue expressing LIGHT were counted and adjusted for the % of tumor in the microdot. Similarly, LIGHT expression in the whole microdot was quantified by the pathologist, and adjusted for the % of tumor present in the microdot. Optimal cutoff points for cell staining were determined using the significance of correlation method (23) that fits Cox proportional hazard models to the dichotomized variable and the survival variable (R version 2.15.0, www.r-project.org in Cutoff Finder software http://molpath.charite.de/cutoff). The optimal cutoff was defined as the point with the most significant (Fischer's exact test) split as has been previously validated (23). Survival probabilities were estimated using the Kaplan-Meier method, and the Log-Rank test was used to compare the survival curves (SPSS, IBM Corp.,Version 21.0. Armonk, NY), and those with a value of p ≤ 0.05 considered as statistically significant.
Results
Patient Demographics
Ninety-six patients with resected CRLM were included in the study. Sixty-three of 96 patients (66%) were men. The median number of resected liver metastases was two with an average tumor size of the largest tumor measuring 4.2cm. Bilobar liver resections were performed in 46 patients (48%) and the median number of liver segments resected was four. The median disease-free interval from the time of presentation of the primary colorectal tumor to hepatic resection was seven months with synchronous disease present in 44 patients (46%).
Neoadjuvant chemotherapy was administered to 69 patients (72%), and 79 patients (82%) were treated with adjuvant chemotherapy, of which 34 (35%) also received locoregional hepatic intra-arterial chemotherapy. Disease recurrence occurred in 66/96 (69%) patients, and the median RFS was 13 months. Thirty-nine patients (41%) died of the disease. Median follow-up was 30 months for all patients and 39 months for survivors. Additional patient and tumor characteristics are outlined in table 1.
Table 1.
| Patient Characteristics | |
|---|---|
| Total Number of patients | 96 |
| Age (mean) | 60 |
| Primary tumor location | |
| Colon | 73 (76%) |
| Rectum | 23 (24%) |
| Metastatic liver tumor characteristics (resected) | |
| Number (median) | 2 (1-11) |
| Size of largest tumor (mean ± SEM) | 4.2 ± 0.3 |
| Number of segments resected (median, range) | 4 (1-6) |
| Bilobar resection | 46 |
| Disease presentation | |
| Synchronous | 44 (46%) |
| Metachronous | 52 (54%) |
| Disease free interval (median months, range) | 7 (0-81) |
| Clinical Risk Score characteristics | |
| Score (median, range) | 2 (0-5) |
| Lymph node + primary | 56 (58%) |
| Size > 5cm | 22 (23%) |
| metastases > 1 tumor | 58 (60%) |
| CEA> 500 | 8 (8%) |
| Disease free inerval < 12mo. | 51 (53%) |
| Liver condition | |
| steatosis | 47 (49%) |
Gene array and Gene Ontology (GO) analysis
Of 47,231 annotated gene probe sets studied, 393 genes were significantly associated with OS (p<0.001). GO analysis of these genes was performed to calculate expression statistics for every GO term with respect to all genes represented in the dataset to identify biologic themes that were over-represented in patients who experienced improved survival. Using the EASE software, 553 unique biologic processes/themes were ranked of which 10 processes were significantly correlated with OS (Table 2). One of the 10/553 processes was reflective of an antitumor immune response within the metastatic tumors. The process of “T-cell proliferation” was a significant predictor of OS (#10 of 553 biologic processes, p=0.01). The category “T-cell proliferation” comprised three specific genes -- TNFSF14/LIGHT, IL10, and IL18 (table 2). Kaplan-Meier survival probabilities confirmed that high tumor expression of LIGHT (p=0.0002), IL10 (p=0.0003), and IL18 (p=0.0005) were associated with improved OS (Figure 1). LIGHT expression was further assessed based on expression quartiles, e.g. ≥ 25% expression, median expression, and ≥75% expression, and in all instances, increased LIGHT expression was associated with improved OS (p=0.0047, 0.0024, 0.02; respectively). Proportional hazards regression similarly reflected that increased LIGHT expression tracked with survival with a HR of 0.43(0.28-0.65), p=8.55e-5 (Table 2).
Table 2. Gene Ontology Analysis of Resected Colorectal Liver Metastases.
| Gene Ontology Analysis of Biological Processes Associated with Survival | ||
|---|---|---|
|
| ||
| Biological process (no. of genes) | p-value (≤ 0.01) | |
|
|
||
| Overall Survival | 1. biosynthesis (36) | 0.0001 |
| 2. steroid metabolism (11) | 0.0002 | |
| 3. metabolism (133) | 0.0004 | |
| 4. macromolecule biosynthesis (30) | 0.0004 | |
| 5. lipid metabolism (21) | 0.0008 | |
| 6. cell proliferation (31) | 0.006 | |
| 7. steroid biosynthesis (6) | 0.009 | |
| 8. lipid biosynthesis (9) | 0.01 | |
| 9. alcohol metabolism (11) | 0.01 | |
| 10. T-cell proliferation (3) | 0.01 | |
| Recurrence Free Survival | 1. T-cell proliferation (3) | 0.002 |
| 2. lymphocyte proliferation (3) | 0.003 | |
| 3. T-cell activation (3) | 0.01 | |
| Individual Genes Identified by Gene Ontology to be Involved in T-cell Proliferation in Resected Colorectal Liver Metastases | |||
|---|---|---|---|
|
| |||
| Genes associated with survival | Proportional Hazards Model | ||
|
|
|||
| Cox | |||
|
|
|||
| HR | p-value | ||
|
|
|||
| Overall Survival | TNFSF14 (LIGHT) | 0.4 | 0.00009 |
| IL10 | 0.4 | 0.0001 | |
| IL18 | 0.25 | 0.0006 | |
| Recurrence Free Survival | TNFSF14 (LIGHT) | 0.47 | 0.00002 |
| IL10 | 0.48 | 0.0003 | |
| NCK1 | 2.7 | 0.0002 | |
Figure 1.
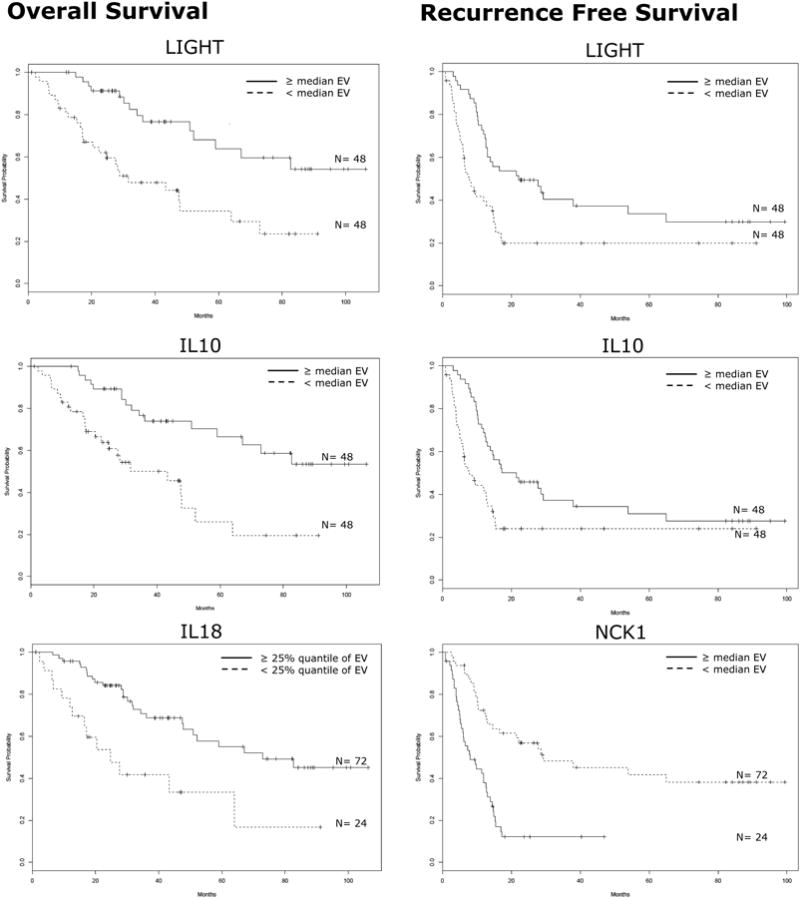
Expression of Specific Immunologic Genes are Associated with Survival.
Kaplan-Meier survival curves for patients with colorectal liver metastases based on the expression value (EV) of individual genes identified through gene ontology analysis that are involved in T-cell proliferation/activation. Left panel: Overall survival. Right panel: Recurrence-free survival. All p-values ≤0.007, log-rank test.
Whereas 393 unique genes were associated with OS by a Cox proportional hazards model, 178 genes were significantly associated with RFS. GO analysis of these genes identified and ranked 309 unique biologic processes, of which only 3 processes significantly correlated with RFS (Table 2). The processes were “T-cell proliferation” (p=0.002), “lymphocyte proliferation” (p=0.003), and “T-cell activation” (p=0.01). Each of these processes comprised the same group of three specific genes -- TNFSF14/LIGHT, IL10, and NCK1 (Table 2). LIGHT expression was further assessed based on expression quartiles, e.g. ≥ 25% expression, median expression, and ≥75% expression, and in all instances, increased LIGHT expression was associated with improved RFS (p=0.0043, 0.0017, 0.0179; respectively). Proportional hazards regression similarly reflected that increased LIGHT expression tracked with recurrence with a HR of 0.47(0.33-0.67), p=2.42e-5 (Table 2).
Kaplan-Meier survival probabilities confirmed that high tumor expression of TNFSF14/LIGHT and IL10, and low expression of NCK1, were associated with improved RFS (all p≤ 0.007) (Table 2) (Figure 1).
Expression of these immune-related genes associated with both OS and RFS was further evaluated and not found to be significantly associated with the clinically utilized predictors of survival (size of primary, primary tumor node status, CEA level, disease free interval, or number of CRLM, e.g. clinical risk score; ref. 16), or the administration of chemotherapy (p=NS).
Immunohistochemistry
Of the 91 patients included in an independent set of resected CRLM represented in the TMA, 76 patients had complete clinical data and analyzable tissue cores. Patient, tumor, and treatment characteristics are displayed in table 3. Since we have identified LIGHT as the immune-related gene most likely to be associated with both OS and RFS on cox-regression analysis, an antibody to LIGHT was optimized for tissue staining. The amount of LIGHT expression in the total tissue core, in the core adjusted for the amount of tumor tissue present, and on TILs were quantified and analyzed for associations with OS and RFS. Survival analysis was controlled for the presence of extra-hepatic disease, disease-free interval, node status of the primary tumor, the number of liver metastases, the size of the metastases, and the serum CEA levels (Table 4).
Table 3.
| Characteristics of Patients Evaluated with Immunohistochemistry Analysis | |
|---|---|
| Total Number of patients | 76 |
| Primary tumor location | |
| Colon | 49 (64%) |
| Rectum | 27 (36%) |
| Metastatic liver tumor characteristics (resected) | |
| Number (median) | 1 (1-17) |
| Size of largest tumor (mean ± SEM) | 4.9 ± 0.4 |
| >3 segments resected (median, range) | 44 |
| Disease presentation | |
| Synchronous | 11(14%) |
| Metachronous | 65 (86%) |
| Disease free interval (median months, range) | 13.5 (0-122) |
| Chemotherapy administration | |
| Neoadjuvant | 17(22%) |
| Adjuvant | 65 (86%) |
| + Hepatic arterial infusion | 18 (24%) |
| Clinical Risk Score characteristics | |
| Score (median, range) | 2 (0-4) |
| Lymph node + primary | 49 (64%) |
| Size > 5cm | 29 (38%) |
| metastases > 1 tumor | 34 (45%) |
| CEA> 200 | 12 (18%)* |
| Disease free inerval < 12mo. | 36 (47%) |
n=65
Table 4. Immunohistochemistry Analysis of Lymphocyte Populations and LIGHT Expression.
| RFS | OS | |||
|---|---|---|---|---|
|
|
|
|||
| Univariate | Multivariate | Univariate | Multivariate | |
|
|
|
|||
| ↑LIGHT+ expression† | .060 (.3-1.0) | 0.02 | .096 (.32-1.096) | |
| Number of TIL | .044 (.34-.99) | 0.038 | .058 (.36-1.0) | 0.019 |
| Number of LIGHT+ TIL | .047 (.35-.99) | 0.12 | .041 (.34-.98) | 0.018 |
|
| ||||
| EHD | .37 (.71-2.47) | .068 (.96-3.32) | ||
|
| ||||
| Synchronous Disease | .30 (. 27-1.49) | .91 (.45-2.46) | ||
|
| ||||
| CRS≥3 | .13 (. 89-2.58) | <.001 (1.43-4.17) | <.001 | |
| DFI<12mo. | .82 (.57-1.57) | 0.037 (1.03-2.9) | ||
| Node+ primary | .67 (. 64-1.97) | .082 (.94-2.88) | ||
| >1 Liver lesion | .60 (.69-1.9) | .039 (1.027-2.89) | ||
| size of liver lesion>5cm | .004 (1.3-4.02) | 0.003 | .19 (1.107-3.175) | |
| CEA>200 | .41 (.68-2.54) | 0.036 (1.048-3.89) | ||
p-value (HR)
adjusted for % of tumor tissue in microdot
TIL=tumor infiltrating lymphocytes, EHD= extrahepatic disease, DFI= disease-free interval, CRS=clinical risk score
LIGHT expression in tissue cores
LIGHT expression was quantified in the total tissue core (Figure 2). Increased LIGHT was associated with improved OS (p=0.03, HR 0.22-0.94) on univariate analysis. This relationship with OS persisted independent of the clinical-risk score on multivariate analysis (p=0.002).
Figure 2. Immunohistochemical staining for LIGHT expression.
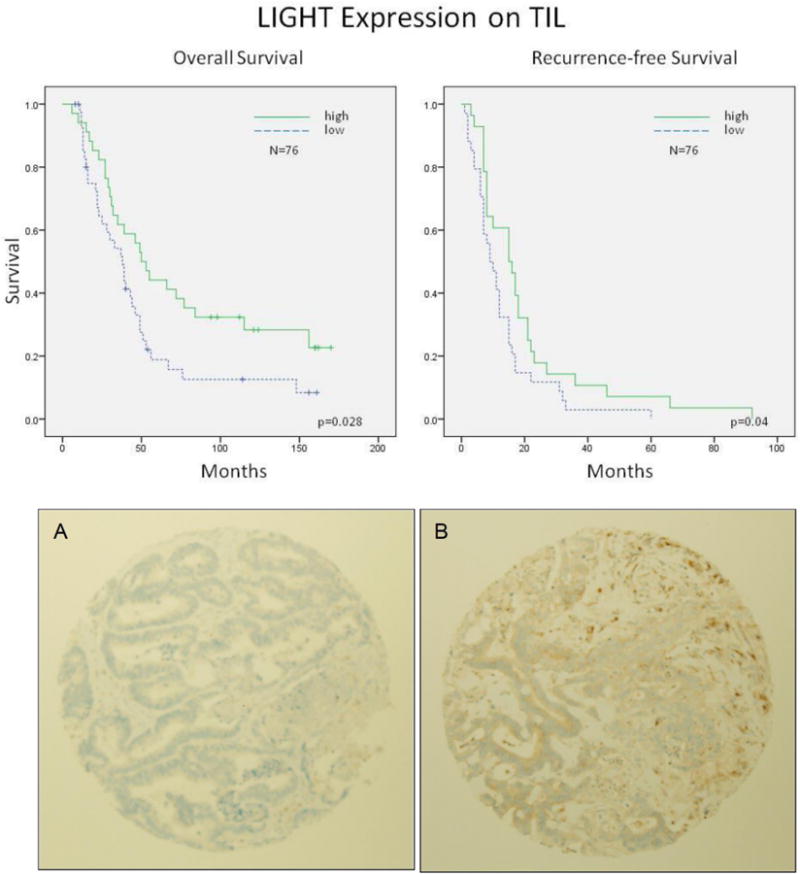
Survival curves for patients with colorectal liver metastases based on the protein expression of LIGHT on tumor-infiltrating lymphocytes (TIL). Patients whose tumors had higher numbers of LIGHT-expressing TILs per tumor area experienced improved overall and recurrence-free survival (upper panel). Representative images of low (A) and high (B) staining for LIGHT in tumor tissue cores from resected colorectal liver metastases (lower panel).
LIGHT expression adjusted for the amount of tumor in the core
In order to determine the effect the amount of tumor tissue in the core had on LIGHT expression, the results were adjusted based on the percent of tumor tissue in the core. When expression of LIGHT was adjusted for the amount of tumor tissue in the core, there was a trend towards improved RFS (p=0.06, 0.3-1.0) and OS (p=0.096, 0.32-1.096) with increased LIGHT expression on univariate analysis. On multivariate analysis increased LIGHT expression maintained an association with improved RFS (p=0.02) (Table 4).
LIGHT expression on TILs
The number of TILs was quantified in the tumor cores. Increased numbers of TILs in the CRLM was associated with improved survival on univariate analysis and this trend persisted on multivariate analysis (p<0.05) (Table 4). Since our animal models of colorectal liver metastases have characterized the importance of LIGHT expression specifically on T cells and T-cell activation status (24), we specifically quantified the number of TILs expressing LIGHT. Patients whose tumors had higher numbers of LIGHT-expressing TILs per tumor area experienced improved OS (HR=0.56 (0.33-0.94), p=0.028) and RFS (HR=0.59 (0.35-0.98), p=0.04) (Figure 2). The association with improved OS persisted on multivariate analysis (Table 4).
Discussion
In the last decade, a combination of advances in surgical technique, perioperative care, and chemotherapy have been associated with increased 5-year survival of patients with resectable CRLM to up to 60% (25). However, 10-year survival is relatively uncommon even in these highly selected patients (5). The best current chemotherapy regimens are not curative and provide a median OS of approximately 20 months (26-28). New strategies are needed to improve outcomes for these patients. Our previous studies, along with those from other groups, showed an association between increased T-cell infiltration in resected tumors and long-term survival (6, 7, 9-11, 29-32). Specifically, we determined that an increase in CD4+ TILs and a high number of CD8 T cells relative to total T cells (CD8:CD3 ratio) in CRLM predicted longer OS, while among a separate cohort of10-year survivors, there was a correlation between increased CD3+, CD8+, and CD8+highCD4+low cells and long-term disease-specific survival after resection (11, 12, 33). In that cohort, the number of CD45RO+ cells did not correlate with improved long-term survival. Therefore, we sought to characterize further the immune environment of CRLM by defining their immunologic gene expression profiles (15) in order to evaluate potential targets for immunotherapy.
Microarray analysis of gene expression is a powerful tool to accomplish this since it is a direct representation of transcriptional and post-transcriptional regulation occurring in the tumor microenvironment and accurately measures RNA levels in the cells (34, 35). The ways in which these transcripts are connected in regulatory networks is complex and the breadth of data generated must be organized into defined biologic processes in order to accurately identify patterns of gene expression that correlate with outcomes (36, 37). Therefore, we utilized gene ontology analysis to identify these patterns to organize and rank biologic processes associated with OS and RFS (20, 38). It was determined that an intra-tumoral environment reflective of “T- cell proliferation” and “activation” significantly correlated with survival in patients with resected CRLM. Further, genetic pathway analysis ranked “T-cell proliferation” as the most significant biologic function to correlate with recurrence, a finding consistent with those from other groups that patient prognosis and tumor biology were associated with increased infiltration of CD4 and CD8 lymphocytes in primary colon tumors (7, 10).
Immunohistochemical analysis of an independent set of similar tumors confirmed at the protein level that increased TILs per tumor area was associated with increased RFS and a trend towards improved OS. This correlated with the gene expression data in which “T-cell and lymphocyte proliferation” were the GO categories most likely to be associated with RFS. From both the gene analysis data and immunohistochemistry it can be inferred that overall survival may be a function of multiple host and tumor variables, including T-cell infiltration, but that tumor recurrence may be predominantly determined by the ability of the host to mount, and the tumor to support, lymphocyte proliferation, activation, and cytotoxicity.
We also identified specific and interdependent immune genes that were differentially expressed and significantly associated with improved survival in CRLM. Of the genes that defined the biologic processes identified through gene ontology analysis, LIGHT expression was found to be most likely to be associated with both OS and RFS. LIGHT, or TNFSF-14, is a member of the tumor necrosis factor (TNF) ligand family and plays a key role in T-cell homeostasis and proliferation. It is a transmembrane protein produced by activated T cells that mediates T-cell activation, survival, and death (39-41). Though normally only transiently expressed on T cells after activation, when constitutively expressed on T cells in transgenic mice, there are increased circulating populations of CD4 and CD8 lymphocytes and systemic inflammatory infiltrates (42, 43). Though it can support the expansion of CD4+CD25+ T regulatory (Treg) cells, when highly expressed, LIGHT stimulates effector T-cell proliferation and differentiation, overcoming Treg suppression and triggering T cell-mediated autoimmunity and antitumor immunity (44). Increased expression of LIGHT on TILs in CRLM may represent effector T-cell proliferation and an antitumor response, which could slow the progression of disease and account, in part, for increased patient survival and a prolonged disease-free interval (24). We were therefore very interested in determining if LIGHT expression, specifically in TILs, was associated with survival. That increased presence of LIGHT+ TILs per tumor area correlated with both improved OS and RFS supports a role for LIGHT in the antitumor immune response. Further study of the genes responsible for lymphocyte proliferation and activation in CRLM, including IL10, IL18, and NCK1, will better define the immunologic milieu and potentially identify additional targets that may be manipulated to increase the antitumor immune response. For example, NCK1, recruits cytoskeletal proteins to the T-cell receptor (TCR) that allow T-cell activation and effector function. Though this adapter protein has many potential interactions in the tumor environment, its overexpression in CRLM may be related to TCR interactions with tumor antigens, as was implied by gene ontology analysis in these patients. NCK1 may play a key role in modulating T- cell affinity to tumor antigens by controlling the number of TCRs on the cell surface, so that higher expression of the gene may lead to less TCRs on the T-cell surface (45). This could account for a decreased antitumor response with high NCK1 expression and would be consistent with our findings. Further studies and validation are needed to clarify the complex roles inflammation and these cytokines play in the tumor microenvironment, as many of them have dual functionality.
In addition, it is possible that chemotherapy administration could affect gene expression. Though this is difficult to assess in patients of a heterogenous population, when we assessed chemotherapy administration as a covariate, no association was found with LIGHT expression. Further, it is possible that chemotherapy may alter immunocyte function, exposure of tumor antigens, or influence sensitivity to chemotherapy. Increased TIL densities at the invasive margin of CRLM were found to predict response to chemotherapy in a retrospective study, therefore, it is also possible that increased TILs and LIGHT+TILs may be associated with chemotherapy sensitivity (46).
This study has several limitations. Due to tumor heterogeneity, the tissue fragments harvested for RNA extraction may not have been representative of the entire tumor. For this reason we carefully macro-dissected the tumor and utilized viable tumor-rich areas. Also, we were careful to minimize the stromal elements by analyzing tumor samples with H&E staining after macro-dissection. In addition, analysis of gene expression in the tissues is representative of the tumor microenvironment, but does not identify the cell or cells responsible for the epigenetic changes. Further characterization and functional studies on TILs extracted from the tumors will help clarify the cell types responsible for the identified gene associations. We have begun many of these studies in a preclinical model of CRLM and preliminary data have identified specific TIL populations and quantified LIGHT expression on these lymphocytes (24). Furthermore, that some of the specific cytokines reflective of T-cell proliferation and activation (e.g., IL2, IFNγ) were not differentially expressed genetically in the tumors studied may be a reflection of the picogram concentrations (and the gene expression equivalents) present in the microenvironment, or a limitation of gene expression technology to capture chemical signals expressed by such a small number of TILs. LIGHT was chosen to evaluate for protein expression as it was the most significantly expressed gene associated with both OS and RFS, and that it also was able to be assessed with immunohistochemistry. That LIGHT protein expression correlated with the gene array transcript data in an independent validation set supports its potential as an immunotherapeutic target. Importantly, we have identified other targets, e.g. NCK1, which will require further validation.
Multiple trials have investigated nonspecific, passive, active, and adoptive immunotherapy for CRLM (47-52), however, further definition of the immune milieu in the tumor microenvironment is needed to design more effective therapies (53). We have identified an immune network of genes that function in T-cell proliferation/activation and that are associated with survival and disease recurrence in patients who underwent resection of CRLM for further studies. This study suggests that intratumoral T-cell proliferation and activation may be an important process in tumor progression within colorectal liver metastases, and it introduces specific genes governing immune function for potential therapeutic targeting.
Acknowledgments
Support: This study has been supported, in part, by the Warren and Clara Cole Career Development Award and NCI K08CA190855 (AVM)
Footnotes
Disclaimers: The authors have no disclaimers
References
- 1.Jemal A, Siegel R, Ward E, Hao Y, Xu J, Thun MJ. Cancer statistics, 2009. CA Cancer J Clin. 2009;59:225–49. doi: 10.3322/caac.20006. [DOI] [PubMed] [Google Scholar]
- 2.Leonard GD, Brenner B, Kemeny NE. Neoadjuvant chemotherapy before liver resection for patients with unresectable liver metastases from colorectal carcinoma. J Clin Oncol. 2005;23:2038–48. doi: 10.1200/JCO.2005.00.349. [DOI] [PubMed] [Google Scholar]
- 3.Steele G, Jr, Ravikumar TS. Resection of hepatic metastases from colorectal cancer: Biologic perspectives. Ann Surg. 1989;210:127–38. doi: 10.1097/00000658-198908000-00001. [DOI] [PMC free article] [PubMed] [Google Scholar]
- 4.Bismuth H, Adam R, Levi F, et al. Resection of nonresectable liver metastases from colorectal cancer after neoadjuvant chemotherapy. Ann Surg. 1996;224:509–22. doi: 10.1097/00000658-199610000-00009. [DOI] [PMC free article] [PubMed] [Google Scholar]
- 5.Tomlinson JS, Jarnagin WR, DeMatteo RP, Fong Y, Kornprat P, Gonen M, et al. Actual 10-year survival after resection of colorectal liver metastases defines cure. J Clin Oncol. 2007;25:4575–80. doi: 10.1200/JCO.2007.11.0833. [DOI] [PubMed] [Google Scholar]
- 6.Chiba T, Ohtani H, Mizoi T, Naito Y, Sato E, Nagura H, et al. Intraepithelial CD8+ T-cell-count becomes a prognostic factor after a longer follow-up period in human colorectal carcinoma: possible association with suppression of micrometastasis. Br J Cancer. 2004;91:1711–7. doi: 10.1038/sj.bjc.6602201. [DOI] [PMC free article] [PubMed] [Google Scholar]
- 7.Galon J, Costes A, Sanchez-Cabo F, Kirilovsky A, Mlecnik B, Lagorce-Pagès C, et al. Type, density, and location of immune cells within human colorectal tumors predict clinical outcome. Science. 2006;313:1960–4. doi: 10.1126/science.1129139. [DOI] [PubMed] [Google Scholar]
- 8.Pagès F, Berger A, Camus M, Sanchez-Cabo F, Costes A, Molidor R, et al. Effector memory T cells, early metastasis, and survival in colorectal cancer. N Engl J Med. 2005;353:2654–66. doi: 10.1056/NEJMoa051424. [DOI] [PubMed] [Google Scholar]
- 9.Prall F, Duhrkop T, Weirich V, Ostwald C, Lenz P, Nizze H, Barten M. Prognostic role of CD8+ tumor-infiltrating lymphocytes in stage III colorectal cancer with and without microsatellite instability. Hum Pathol. 2004;35:808–16. doi: 10.1016/j.humpath.2004.01.022. [DOI] [PubMed] [Google Scholar]
- 10.Naito Y, Saito K, Shiiba K, Ohuchi A, Saigenji K, Nagura H, Ohtani H. CD8+ T cells infiltrated within cancer cell nests as a prognostic factor in human colorectal cancer. Cancer Res. 1998;58:3491–4. [PubMed] [Google Scholar]
- 11.Katz SC, Pillarisetty V, Bamboat ZM, Shia J, Hedvat C, Gonen M, et al. T cell infiltrate predicts long-term survival following resection of colorectal cancer liver metastases. Ann Surg Oncol. 2009;16:2524–30. doi: 10.1245/s10434-009-0585-3. [DOI] [PubMed] [Google Scholar]
- 12.Katz SC, Bamboat ZM, Maker AV, Shia J, Pillarisetty VG, Yopp AC, et al. Regulatory T cell infiltration predicts outcome following resection of colorectal cancer liver metastases. Ann Surg Oncol. 2013;20:946–55. doi: 10.1245/s10434-012-2668-9. [DOI] [PMC free article] [PubMed] [Google Scholar]
- 13.Yu P, Fu YX. Targeting tumors with LIGHT to generate metastasis-clearing immunity. Cytokine Growth Factor Rev. 2008;19:285–94. doi: 10.1016/j.cytogfr.2008.04.004. [DOI] [PMC free article] [PubMed] [Google Scholar]
- 14.Yu P, Lee Y, Liu W, Chin RK, Wang J, Wang Y, et al. Priming of naive T cells inside tumors leads to eradication of established tumors. Nat Immunol. 2004;5:141–9. doi: 10.1038/ni1029. [DOI] [PubMed] [Google Scholar]
- 15.Hyatt G, Melamed R, Park R, Seguritan R, Laplace C, Poirot L, et al. Gene expression microarrays: glimpses of the immunological genome. Nat Immunol. 2006;7:686–91. doi: 10.1038/ni0706-686. [DOI] [PubMed] [Google Scholar]
- 16.Fong Y, Fortner J, Sun RL, Brennan MF, Blumgart LH. Clinical score for predicting recurrence after hepatic resection for metastatic colorectal cancer: Analysis of 1001 consecutive cases. Ann Surg. 1999;230:309–21. doi: 10.1097/00000658-199909000-00004. [DOI] [PMC free article] [PubMed] [Google Scholar]
- 17.Schroeder A, Mueller O, Stocker S, Salowsky R, Leiber M, Gassmann M, et al. The RIN: an RNA integrity number for assigning integrity values to RNA measurements. BMC Mol Biol. 2006;7:3. doi: 10.1186/1471-2199-7-3. [DOI] [PMC free article] [PubMed] [Google Scholar]
- 18.Ito H, Mo Q, Qin LX, Viale A, Maithel SK, Maker AV, et al. Gene expression profiles accurately predict outcome following liver resection in patients with metastatic colorectal cancer. PLoS One. 2013;8:e81680. doi: 10.1371/journal.pone.0081680. [DOI] [PMC free article] [PubMed] [Google Scholar]
- 19.Bolstad BM, Irizarry RA, Astrand M, Speed TP. A comparison of normalization methods for high density oligonucleotide array data based on variance and bias. Bioinformatics. 2003;19:185–93. doi: 10.1093/bioinformatics/19.2.185. [DOI] [PubMed] [Google Scholar]
- 20.Ashburner M, Ball CA, Blake JA, Botstein D, Butler H, Cherry JM, et al. Gene ontology: tool for the unification of biology. The Gene Ontology Consortium. Nat Genet. 2000;25:25–9. doi: 10.1038/75556. [DOI] [PMC free article] [PubMed] [Google Scholar]
- 21.Hosack DA, Dennis G, Jr, Sherman BT, Lane HC, Lempicki RA. Identifying biological themes within lists of genes with EASE. Genome Biol. 2003;4:R70. doi: 10.1186/gb-2003-4-10-r70. [DOI] [PMC free article] [PubMed] [Google Scholar]
- 22.Cui X, Churchill GA. Statistical tests for differential expression in cDNA microarray experiments. Genome Biol. 2003;4:210. doi: 10.1186/gb-2003-4-4-210. [DOI] [PMC free article] [PubMed] [Google Scholar]
- 23.Budczies J, Klauschen F, Sinn BV, Győrffy B, Schmitt WD, Darb-Esfahani S, Denkert C. Cutoff Finder: a comprehensive and straightforward Web application enabling rapid biomarker cutoff optimization. PLoS One. 2012;7:e51862. doi: 10.1371/journal.pone.0051862. [DOI] [PMC free article] [PubMed] [Google Scholar]
- 24.Qin JZ, Upadhyay V, Prabhakar B, Maker AV. Shedding LIGHT (TNFSF14) on the tumor microenvironment of colorectal cancer liver metastases. J Transl Med. 2013;11:70. doi: 10.1186/1479-5876-11-70. [DOI] [PMC free article] [PubMed] [Google Scholar]
- 25.Abdalla EK, Vauthey JN, Ellis LM, Ellis V, Pollock R, Broglio KR, et al. Recurrence and outcomes following hepatic resection, radiofrequency ablation, and combined resection/ablation for colorectal liver metastases. Ann Surg. 2004;239:818–27. doi: 10.1097/01.sla.0000128305.90650.71. [DOI] [PMC free article] [PubMed] [Google Scholar]
- 26.Hurwitz H, Fehrenbacher L, Novotny W, Cartwright T, Hainsworth J, Heim W, et al. Bevacizumab plus irinotecan, fluorouracil, and leucovorin for metastatic colorectal cancer. N Engl J Med. 2004;350:2335–42. doi: 10.1056/NEJMoa032691. [DOI] [PubMed] [Google Scholar]
- 27.Saltz LB, Clarke S, Diaz-Rubio E, Scheithauer W, Figer A, Wong R, et al. Bevacizumab in combination with oxaliplatin-based chemotherapy as first-line therapy in metastatic colorectal cancer: a randomized phase III study. J Clin Oncol. 2008;26:2013–9. doi: 10.1200/JCO.2007.14.9930. [DOI] [PubMed] [Google Scholar]
- 28.Van Cutsem E, Kohne CH, Hitre E, Zaluski J, Chang Chien CR, et al. Cetuximab and chemotherapy as initial treatment for metastatic colorectal cancer. N Engl J Med. 2009;360:1408–17. doi: 10.1056/NEJMoa0805019. [DOI] [PubMed] [Google Scholar]
- 29.Clemente CG, Mihm MC, Jr, Bufalino R, Zurrida S, Collini P, Cascinelli N. Prognostic value of tumor infiltrating lymphocytes in the vertical growth phase of primary cutaneous melanoma. Cancer. 1996;77:1303–10. doi: 10.1002/(SICI)1097-0142(19960401)77:7<1303::AID-CNCR12>3.0.CO;2-5. [DOI] [PubMed] [Google Scholar]
- 30.Diederichsen ACP, Hjelmborg JVB, Christensen PB, Zeuthen J, Fenge C. Prognostic value of the CD4+/CD8+ ratio of tumour infiltrating lymphocytes in colorectal cancer and HLA-DR expression on tumour cells. Cancer Immunol Immunother. 2003;52:423–8. doi: 10.1007/s00262-003-0388-5. [DOI] [PMC free article] [PubMed] [Google Scholar]
- 31.Sato E, Olson SH, Ahn J, Bundy B, Nishikawa H, Qian F, et al. Intraepithelial CD8+ tumor-infiltrating lymphocytes and a high CD8+/regulatory T cell ratio are associated with favorable prognosis in ovarian cancer. Proc Natl Acad Sci U S A. 2005;102:18538–43. doi: 10.1073/pnas.0509182102. [DOI] [PMC free article] [PubMed] [Google Scholar]
- 32.Zhang L. Intratumoral T cells, recurrence, and survival in epithelial ovarian cancer. N Engl J Med. 2003;348:203–13. doi: 10.1056/NEJMoa020177. [DOI] [PubMed] [Google Scholar]
- 33.Katz S, Maker AV, Pillarisetty V, et al. Colorectal cancer liver metastases T cell subset counts and ratios are independent predictors of outcome. Ann Surg Oncol. 2011;18:S13. [Google Scholar]
- 34.Marrack P, Mitchell T, Hildeman D, Kedl R, Teague TK, Bender J, et al. Genomic-scale analysis of gene expression in resting and activated T cells. Curr Opin Immunol. 2000;12:206–9. doi: 10.1016/s0952-7915(99)00075-8. [DOI] [PubMed] [Google Scholar]
- 35.Teague TK, Hildeman D, Kedl RM, Mitchell T, Rees W, Schaefer BC, et al. Activation changes the spectrum but not the diversity of genes expressed by T cells. Proc Natl Acad Sci U S A. 1999;96:12691–6. doi: 10.1073/pnas.96.22.12691. [DOI] [PMC free article] [PubMed] [Google Scholar]
- 36.Ochs MF, Peterson AJ, Kossenkov A, Bidaut G. Incorporation of gene ontology annotations to enhance microarray data analysis. Methods Mol Biol. 2007;377:243–54. doi: 10.1007/978-1-59745-390-5_15. [DOI] [PubMed] [Google Scholar]
- 37.Werner T. Bioinformatics applications for pathway analysis of microarray data. Curr Opin Biotechnol. 2008;19:50–4. doi: 10.1016/j.copbio.2007.11.005. [DOI] [PubMed] [Google Scholar]
- 38.Bard JB, Rhee SY. Ontologies in biology: design, applications and future challenges. Nat Rev Genet. 2004;5:213–22. doi: 10.1038/nrg1295. [DOI] [PubMed] [Google Scholar]
- 39.Granger SW, Ware CF. Turning on LIGHT. J Clin Invest. 2001;108:1741–2. doi: 10.1172/JCI14651. [DOI] [PMC free article] [PubMed] [Google Scholar]
- 40.Harrop JA, McDonnell PC, Brigham-Burke M, Lyn SD, Minton J, Tan KB, et al. Herpesvirus entry mediator ligand (HVEM-L), a novel ligand for HVEM/TR2, stimulates proliferation of T cells and inhibits HT29 cell growth. J Biol Chem. 1998;273:27548–56. doi: 10.1074/jbc.273.42.27548. [DOI] [PubMed] [Google Scholar]
- 41.Tamada K, Shimozaki K, Chapoval AI, Zhai Y, Su J, Chen SF, et al. LIGHT, a TNF-like molecule, costimulates T cell proliferation and is required for dendritic cell-mediated allogeneic T cell response. J Immunol. 2000;164:4105–10. doi: 10.4049/jimmunol.164.8.4105. [DOI] [PubMed] [Google Scholar]
- 42.Shaikh RB, Santee S, Granger SW, Butrovich K, Cheung T, Kronenberg M, et al. Constitutive expression of LIGHT on T cells leads to lymphocyte activation, inflammation, and tissue destruction. J Immunol. 2001;167:6330–7. doi: 10.4049/jimmunol.167.11.6330. [DOI] [PubMed] [Google Scholar]
- 43.Wang J, Lo JC, Foster A, Yu P, Chen HM, Wang Y, et al. The regulation of T cell homeostasis and autoimmunity by T cell-derived LIGHT. J Clin Invest. 2001;108:1771–80. doi: 10.1172/JCI13827. [DOI] [PMC free article] [PubMed] [Google Scholar]
- 44.Wang Y, Zhu M, Yu P, Fu YX. Promoting immune responses by LIGHT in the face of abundant regulatory T cell inhibition. J Immunol. 2010;184:1589–95. doi: 10.4049/jimmunol.0901582. [DOI] [PubMed] [Google Scholar]
- 45.Mingueneau M, Sansoni A, Gregoire C, Roncagalli R, Aguado E, Weiss A, et al. The proline-rich sequence of CD3epsilon controls T cell antigen receptor expression on and signaling potency in preselection CD4+CD8+ thymocytes. Nat Immunol. 2008;9:522–32. doi: 10.1038/ni.1608. [DOI] [PubMed] [Google Scholar]
- 46.Halama N, Michel S, Kloor M, Zoernig I, Benner A, Spille A, et al. Localization and density of immune cells in the invasive margin of human colorectal cancer liver metastases are prognostic for response to chemotherapy. Cancer Res. 2011;71:5670–7. doi: 10.1158/0008-5472.CAN-11-0268. [DOI] [PubMed] [Google Scholar]
- 47.Gardini A, Ercolani G, Riccobon A, Ravaioli M, Ridolfi L, Flamini E, et al. Adjuvant, adoptive immunotherapy with tumor infiltrating lymphocytes plus interleukin-2 after radical hepatic resection for colorectal liver metastases: 5-year analysis. J Surg Oncol. 2004;87:46–52. doi: 10.1002/jso.20066. [DOI] [PubMed] [Google Scholar]
- 48.Grem JL, Jordan E, Robson ME, Binder RA, Hamilton JM, Steinberg SM, et al. Phase II study of fluorouracil, leucovorin, and interferon alfa-2a in metastatic colorectal carcinoma. J Clin Oncol. 1993;11:1737–45. doi: 10.1200/JCO.1993.11.9.1737. [DOI] [PubMed] [Google Scholar]
- 49.Koda K, Glassy MC, McKnight ME, Yasutomi J, Saito N, Dan M, Nakajima N. Immunotherapy for recurrent colorectal cancers with human monoclonal antibody SK-1. Anticancer Res. 2001;21:621–7. [PubMed] [Google Scholar]
- 50.Lygidakis NJ, Sgourakis G, Vlachos L, Raptis S, Safioleas M, Boura P, et al. Metastatic liver disease of colorectal origin: the value of locoregional immunochemotherapy combined with systemic chemotherapy following liver resection. Results of a prospective randomized study Hepatogastroenterology. 2001;48:1685–91. [PubMed] [Google Scholar]
- 51.Speetjens FM, Kuppen PJ, Welters MJ, Essahsah F, Voet van den Brink AM, Lantrua MG, et al. Induction of p53-specific immunity by a p53 synthetic long peptide vaccine in patients treated for metastatic colorectal cancer. Clin Cancer Res. 2009;15:1086–95. doi: 10.1158/1078-0432.CCR-08-2227. [DOI] [PubMed] [Google Scholar]
- 52.Van Cutsem E, Siena S, Humblet Y, Canon JL, Maurel J, Bajetta E, et al. An open-label, single-arm study assessing safety and efficacy of panitumumab in patients with metastatic colorectal cancer refractory to standard chemotherapy. Ann Oncol. 2008;19:92–8. doi: 10.1093/annonc/mdm399. [DOI] [PubMed] [Google Scholar]
- 53.Maker AV, Attia P, Rosenberg SA. Analysis of the cellular mechanism of antitumor responses and autoimmunity in patients treated with CTLA-4 blockade. J Immunol. 2005;175:7746–54. doi: 10.4049/jimmunol.175.11.7746. [DOI] [PMC free article] [PubMed] [Google Scholar]