

Abstract
The Sanfilippo Behavior Rating Scale (SBRS), a 68 item questionnaire, has been developed to assess the behavioral phenotype of children with Sanfilippo syndrome and its progression over time. Fifteen scales rate orality, movement/activity, attention/self-control, emotional function including anger and fear, and social interaction. Items within scales intercorrelate; measures of internal consistency are adequate. Twelve scales are grouped into 4 abnormality clusters: Movement, Lack of fear, Social/emotional and Executive Dysfunction.
A Loess age-trajectory analysis showed that Lack of Fear, Social/Emotional and Executive Dysfunction increased steadily with age; Orality and Mood/Anger/Aggression leveled off. Movement peaked around 6 years, then declined as children’s excessive/purposeless actions stopped. Compared with standard scales, SBRS Movement was appropriately associated with the Vineland Motor scale; SBRS Lack of Fear had significant associations with the Autism Diagnostic Observation Schedule (ADOS), indicating a symptom overlap between Sanfilippo syndrome and autism. This suggests that reduced fearfulness may be the most salient/sensitive SBRS marker of disease progression. Volumetric MRI showed that increased Lack of Fear was significantly associated with reduced amygdala volume, consistent with our hypothesis that the behavior seen in Sanfilippo syndrome is a variant of Klüver-Bucy syndrome. Hippocampal volume loss had twice the effect on Social-Emotional Dysfunction as amygdala loss, consistent with a hippocampal role in attachment and social emotions.
In conclusion, the SBRS assesses the Sanfilippo behavioral phenotype; it can measure behavior change that accompanies disease progression and/or results from treatment.
Introduction
Sanfilippo syndrome (Mucopolysaccharidosis Type IIIA) is a lysosomal storage disorder caused by an inherited deficit in the activity of sulfamidase, an enzyme that metabolizes heparan sulfate. The progression of Sanfilippo syndrome involves central nervous system dysfunction, neurocognitive decline, behavioral abnormalities that are highly salient and distressing, and early death. Although the behavioral abnormalities are not yet fully characterized, their pattern of association with Sanfilippo syndrome suggests that they may hold the key to understanding the neurobehavioral pathology of this disease. Here we describe the development of a quantitative scale to assess the unusual behavioral phenotype of Sanfilippo syndrome and its progression.
There are 4 variants of the syndrome with type A being the most numerous. Sanfilippo A can present in the typical early form, manifesting symptoms salient enough to be diagnosed before 6 years of age or an atypical form with later onset and slower disease progression that is diagnosed after age 6 [1,2]. Cleary and Wraith [3] proposed that the typical form progresses in three stages: 1) developmental delays, especially in language; 2) behavioral and sleep abnormalities; 3) loss of mobility, feeding difficulties, and seizures. Among the problematic behaviors of Stage 2 reported by parents is “orality”; the children tend to mouth things although they do not eat non-food objects. As previously described [4] the children’s heedlessness of danger is of greater concern. Parents must often “child-proof” the home extensively; outside the home these children require constant attention to keep them safe. Empathic capacity and social affiliation are often severely diminished compared to same age peers. These children are frequently oppositional and unresponsive to discipline; they can also be aggressive. These characteristics distinguish them from children with some other MPS diseases who are equally cognitively impaired [5,6].
Prompted by this array of abnormal behaviors, our previous work [4] assessed the social interactions, fearlessness, and startle reactions of affected children through a staged encounter with people, objects and loud noises in a ‘Risk room’ situation modified from the Laboratory-Temperament Assessment Battery [7]. Results showed that the behavior associated with Sanfilippo syndrome Type A appears to be a variant of Klüver-Bucy syndrome (K-Bs) [4].
The signs of K-Bs, such as orality (repeated mouthing of objects) and dampening of emotional expression, including diminished fear, have been consistently shown to be associated with amygdala dysfunction in many species including non-human primates [8]. In human clinical cases, when similar changes occur secondary to herpes encephalitis, anoxic-ischemic encephalopathy and other conditions, MRIs confirm anterior temporal lobe damage. Children with such damage are emotionally unattached to, and markedly indifferent to, caretakers; they also show hyperorality and increased masturbation.
Consistent with the K-Bs hypothesis, we found measurable volume loss in these children’s cortical and subcortical gray matter over a 6 month period which was proportionately greater in the amygdala than in other structures [4].
The progressive loss of language and impaired social interactions characteristic of Sanfilippo syndrome Type A also resemble that occurring in autism. Indeed, after these children have reached 46 months of age, their social and affective dysfunctions are severe enough to meet criteria for autism spectrum disorder as assessed by the Autism Diagnostic Observational Schedule. However, restricted or repetitive behaviors are largely absent [9]. Amygdala dysfunction has been implicated in some of the behavioral deficits that characterize autism [10,11].
For both clinical and research purposes, it is important to have quantitative, disease-specific measures of behavioral function that can track the progression of Sanfilippo syndrome Type A through its several stages. Knowing the pattern of behavioral change can help clinicians guide and support the families of these children. Such knowledge would also provide disease markers useful for evaluating therapeutic intervention. However, none of the standard instruments for assessing child development cover the full range of abnormal behaviors we found in Sanfilippo syndrome. We therefore undertook construction of a formal scale, the Sanfilippo Behavior Rating Scale (SBRS), to tap parents’ detailed knowledge of their children’s specific and unique behaviors. Based on our previous exploration of fearlessness in an experimental setting and its relationship to amygdala atrophy [4], we hypothesized that these associations would also hold with SBRS-measured fearlessness and not with other behavioral domains.
Methods: Scale construction
To initiate scale construction, we conducted exploratory open-ended telephone interviews with parents of 10 of these children. Clinical reports were collected and observations were made by the authors that confirmed and extended parents’ commentaries. For example, we observed the children’s almost non-stop locomotion in novel situations interspersed with brief and repeated object handling. Thus, the scale needed to cover areas of motor activity as well as orality and social/emotional function. The coverage included both current behaviors and parents’ recall of the onset of each behavior. A follow-up form with the same items was devised to track changes since the last visit. Knowledge of K-Bs and its hypothesized presence in MPS IIIA also guided SBRS item development.
In an initial anonymous survey assisted by the National Mucopolysaccharidosis Society, 44 families completed the first, 73 item version of the instrument. Guided by the frequency with which items were endorsed, the scale was then revised and reduced to 68 items covering 15 domains of behaviors that might be affected by the disease (see Table 1, left column). To test the revised version of the SBRS, we asked the parents of a group of children who were recruited for a natural history study at the University of Minnesota to complete the form at each visit.
Table 1.
| Domains | Sample item | Cronbach’s alpha | Clusters and domains |
|---|---|---|---|
| Body movements | Makes large complex movements of her/his body, such as spinning, twirling or repeatedly bouncing up and down. | 0.706 | Movement |
| Object interaction | Examines or manipulates some novel or unfamiliar objects repeatedly | 0.706 | |
| Activity/routines | Never plays with one object or engages in one activity for very long | 0.652 | |
| Emotional Function | Expresses emotions inappropriate to the situation | 0.439 | Social/emotional function |
| Eye contact | Makes efforts to avoid other people’s gaze (keeps head down, looks away, or turns away) | 0.618 | |
| Social interaction | Participates in group activities | 0.501 | |
| Emotional engagement | Doesn’t seem to recognize or respond to other people’s emotion | 0.706 | |
| Comfort seeking | Actively seeks comfort from familiar people | 0.471 | |
| Safety consciousness | Is less aware of danger around the house (e.g., would touch hot oven), on the street or in the playground than other children his/her age. | 0.722 | Lack of fear |
| Fearfulness | Is less fearful of new, strange or scary things than other children his/her age | 0.743 | |
| Attention | Is easily distracted | 0.806 | Executive function |
| Self control/compliance | Is impulsive; can’t stop self | 0.708 | |
| Orality | Puts everything in her/his mouth; eats inedible things | 0.750 | |
| Mood/Anger/Aggression | Mood is irritable and cranky | 0.832 | |
| Self-gratification | Rubs his/her genitals with hands, inside or outside clothing | 0.396 |
We expected that the patterns of parental responses would allow the 15 domains to be grouped into a manageably smaller number of behaviorally meaningful functions, such as movement, social function and emotional functions like fearlessness and anger. To validate the SBRS, we tested the associations between the SBRS scale and measures of adaptive behavior, of autism and of brain volumes.
The observation that there are stages in disease progression suggests that various behavioral functions are affected at different rates. To evaluate this possibility, we determined the trajectory over time of each domain by calculating Loess curves across all time points for all subjects. This technique smoothes data using locally weighted polynomial regression, thereby eliminating forced fitting to some pre-determined mathematical function [12]. Loess curves have proven useful in various areas of psychological research [13,14].
Methods: reliability and validity
Subjects
25 children with MPS IIIA, age 2 to 18 years, were recruited from a study sponsored by Shire at the University of Minnesota: a 24-month Longitudinal, Prospective, Natural History (NH) Study of Patients with Sanfilippo syndrome type A (MPS IIIA, Clinicaltrials.gov reference number, NCT01047306). Patients in this study met the following criteria: 1) MPS IIIA diagnosis confirmed by enzyme or genetic assay, 2) minimum chronological age of one year, 3) developmental age ≥ 12 months on the Vineland Adaptive Behavior Scales-2nd Edition [15].
The Institutional Review Board of The University of Minnesota’s Medical School approved the main NH project and the associated study of neurobehavioral phenotypes that included this questionnaire and other procedures described above.
Children were classified as presenting with the typical early form of the disease if initially diagnosed before 6 years of age, or had known mutations, or with a more slowly progressive form if diagnosed after age 6 [1,2]. The present analysis includes only the 19 children (13 boys, 6 girls) with the classic early onset, and rapidly progressing form of the disease.
Procedures
Children’s ages at first visit ranged from 12 to 102 months (mean was 52 months). Their parents completed the SBRS or follow-up form at baseline, 6 and 12 months following the first visit. Three SBRS forms were not completed; this analysis is based on a total of 54 completed forms.
Sanfilippo Behavior Rating Scale (SBRS)
The SBRS contains 68 items, each of which describes some type of action, either a specific behavior or an easily understood concept like “mood” or “attention.” Parents rated the frequency of each item on a 7 point scale. An explanatory example at the top of the first page indicated the following ordinal equivalences: 0 = Never, 1 = Occasionally (5–10% of the time), 2 = Sometimes (25% of time), 3 = About half the time, 4 = Often (75% of time), 5 = Almost always (90% of time), 6 = Always. For the initial visit, each item also contains a space for age at onset; parents were asked to note the age at which they first noticed the behavior, to the nearest half year. The items were grouped into 15 functional domains with 3–7 behavioral items each; the name of the domain headed its items. The domains are listed in Table 1 along with a sample item from each.
Higher scores on items generally indicated increasing abnormality. Lack of fear is an important behavioral characteristic of Sanfilippo syndrome. However, fear is more understandably evaluated by listing things a child might be afraid of, so items 29–34 were reverse scored to produce a measure of fearlessness. Several other items were also reverse scored: Items 16 (Activity and Routines), 35 (Social Interaction), 44 (Emotional Engagement) and 47 (Comfort seeking).
Vineland Adaptive Behavior Scales Second Edition
The Vineland-II, administered at every visit, measures adaptive functioning along four scales. The interview format was used at baseline; caregivers completed the parent-caregiver Vineland form at subsequent visits. Communication measures verbal skills and language development. Daily Living Skills measures practical skills of self-care and community participation. Socialization measures interpersonal, coping, and play skills. Motor skills measures gross and fine motor development. Vineland scores can be used to estimate overall cognitive ability [16].
Autism Diagnostic Observation Schedule (ADOS)
The ADOS is the “gold standard” measure for autism diagnosis. This semi-structured instrument assesses social communication and play as well as any intense interests or repetitive behaviors through direct interaction and observation. The ADOS yields total scores for social communication and restricted and repetitive behaviors. The ADOS has 4 different modules to match different language levels. Only Module I, for children who are nonverbal or communicate primarily in single words, was used with this sample. The revised ADOS algorithms were used [17]. The ADOS was administered by two research reliable examiners (“research reliable” indicates a proven level of inter-rater reliability in coding). It was administered only once, at the baseline visit or at the first visit when the child was at least 2 years of age.
Brain imaging
Head MRI was acquired under anesthesia at every visit by a 3-T Siemens Trio scanner (Siemens, AG, Erlangen, Germany) with 12-channel RF head coils. The MRI protocol included an 11-minute 3-dimensional, T1-weighted, magnetization-prepared rapid acquisition with gradient-echo (MP RAGE) sequence (TR/TE = 2,530/3.65; TI = 1,100 ms; voxel size = 1.0 × 1.0 × 1.0 mm; flip angle = 7°; FoV = 256). Cortical gray matter volume was obtained by automated brain segmentation carried out with FreeSurfer software version 5.3.0 (www.surfer.nmr.mgh.harvard.edu; [18]. Each subject’s data were visually inspected by a trained technician to ensure accuracy of segmentation. Because automated parcellations of amygdala and hippocampus are unreliable in the dysmorphic brains of those with mucopolysaccharidoses [19], volumes were assessed by manual tracing using Brains2, which allows three dimensional representation for accurate measurement [20] . The tracing was done by coauthor A.A whose intrarater reliability was 0.99; interrater reliability assessed by coauthor I.N. was 0.87 [19]. We examined each subject serially, hence did not correct for total brain volume [21].
Statistical Analysis
Loess curves
For each domain, a Loess curve fitted by local polynomial regression was used to estimate the trajectory of mean scores for each domain across the age range of children in the study. The score calculated for each observation at its age of occurrence, tn,, was the resultant of all scores for that domain weighted by how close their age at observation was to tn [12].
Vineland Analysis
The association of Vineland scaled scores with each SBRS cluster was estimated using generalized estimating equations with an exchangeable correlation structure to account for possible correlation between the multiple observations for each child [22].
ADOS Analysis
A simple linear regression estimated the association between each SBRS domain at baseline and the ADOS Total Score, which was assessed at the first visit only. Confidence intervals and P-values were based on the t-distribution with corresponding model degrees of freedom.
MRI Analysis
The associations of percent change from baseline volume with changes in each SBRS cluster for three brain areas: amygdala, hippocampus, and cortical gray matter (left and right hemispheres combined) were estimated by generalized estimating equations, as with the Vineland analysis.
For the adaptive behavior and brain volume analyses, the measures of association are the changes in SBRS per 10 point change in the Vineland score or per 10% change in MRI volume. For autism, the measure of association is the difference in SBRS per 10 point difference in the ADOS. These respective units yielded comparable changes in SBRS scores.
Results
SBRS: Out of the seven point scale (0–6), parents reported most of the behaviors to occur at frequencies of “never” (0) to “often” (4).
The items within each behavior set were reasonably intercorrelated as shown by their Cronbach alpha values in Table 1; all but 3 were > 0.50. There were no significant relationships between the Cronbach alpha values and either the number or reported frequency of the constituent items, suggesting that these variables did not influence consistency within behavior sets.
Based on a combination of time course characteristics and similarities in function, we grouped the behavior sets into 4 clusters (Table 1, rightmost column). Orality and Mood/anger/aggression were analyzed separately because there was no cluster to which they could be reasonably assigned. Self-gratification behaviors were reported rarely and Cronbach’s alpha for this domain was low. It was excluded from further analysis.
Many entries for onset times were missing and there was little difference in onsets across domains. No further analysis of onset data was undertaken.
The reported frequency of behaviors in three clusters tended to increase over the entire age range (Figure 1). The upward trends in Social/Emotional Dysfunction, Lack of Fear, and Executive Dysfunction indicate generally increasing problems in these areas. The Movement cluster and the Orality and Mood/Anger/Aggression domains tended to decelerate at the older ages, particularly Movement, which reached a peak around 6 years of age and declined thereafter. There was also a trend for domains to remain in roughly the same order of relative frequency with age, suggesting some longitudinal stability.
Figure 1. Loess curves for 4 SBRS clusters and 2 domains.
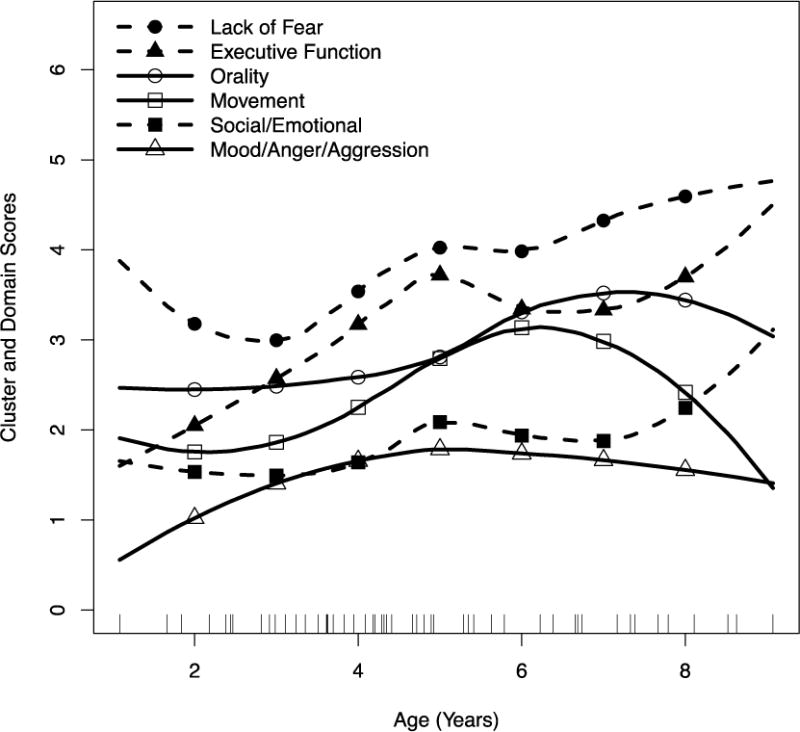
Each short vertical line on the abscissa is a single observation (completed form) for a single child. Dashed lines with filled markers indicate clusters/domains that continue to increase across age. Solid lines with empty markers indicate clusters/domains that plateau or decline with increasing age. Markers are placed at 1 year intervals between ages 2 and 8.
Table 2 shows highly significant cross-sectional associations of the ADOS Total Score with the SBRS Movement and Lack of Fear clusters, while associations with the Social/Emotional Dysfunction and Orality clusters were more modest. Change over time in all SBRS clusters and two domains were associated with change in one or more Vineland scales. Among these, associations of change in SBRS Lack of Fear, Executive Dysfunction and Mood/Anger/Aggression with change in Vineland Communication were highly significant. SBRS Mood/Anger/Aggression was modestly associated with Vineland Daily Living Skills; so was SBRS Social/Emotional Dysfunction with Vineland Socialization. Change in SBRS Movement was modestly associated with change in the Vineland Motor scale.
Table 2.
Association of SBRS clusters and domains with ADOS and Vineland scales
| SBRS domains and domain clusters | ADOS* | Vineland** | |||
|---|---|---|---|---|---|
| Total Score | Communication | Daily Living Skills | Socialization | Motor | |
| Movement | 0.695 (0.009) | −0.360 (0.360) | 0.107 (0.465) | 0.094 (0.478) | 0.408 (0.020) |
| Social/Emotional Dysfunction | 0.397 (0.048) | −0.659 (0.020) | −0.136 (0.312) | −0.242 (0.041) | −0.064 (0.735) |
| Lack of Fear | 0.712 (0.006) | −0.690 (0.002) | −0.224 (0.079) | −0.067 (0.586) | −0.077 (0.660) |
| Executive Dysfunction | 0.416 (0.238) | −0.746 (0.000) | −0.068 (0.625) | −0.128 (0.311) | 0.037 (0.857) |
| Orality | 0.725 (0.063) | −0.974 (0.044) | −0.356 (0.068) | −0.303 (0.082) | −0.264 (0.347) |
| Mood/Anger/Aggression | 0.172 (0.618) | 0.851 (0.001) | 0.249 (0.033) | 0.087 (0.454) | 0.198 (0.222) |
For the ADOS column, the first number in each cell is the difference in SBRS score associated with a 10 point difference in ADOS scores across children.
For the Vineland columns, the first number is the change over time in SBRS score associated with a 10 point change in Vineland score. The parenthesized number is the associated p value in all columns.
0.05 > p > .005 italicized, .001 > p italicized, bolded
A 10% reduction in amygdala volume is significantly associated with an average increase of 0.28 in SBRS Lack of Fear score (Table 3). A comparable increase in Social Emotional Dysfunction was associated with a 10% reduction in hippocampal volume.
Table 3.
Association of SBRS clusters and domains with brain structure volumes
| Amygdala | Hippocampus | Cortical Gray Matter | |
|---|---|---|---|
| Movement | 0.10 (0.42) | −0.06 (0.79) | 0.22 (0.37) |
| Social/Emotional Dysunction | 0.14 (0.11) | 0.31 (0.05) | 0.06 (0.74) |
| Lack of Fear | 0.28 (0.03) | 0.22 (0.37) | 0.41 (0.11) |
| Executive Dysfunction | 0.16 (0.30) | 0.37 (0.18) | 0.27 (0.37) |
| Orality | 0.08 (0.60) | 0.01 (0.97) | 0.21 (0.49) |
| Mood/Anger/Aggression | −0.12 (0.38) | 0.18 (0.45) | −0.23 (0.38) |
The first number in each cell is the average change in the SBRS score per 10% reduction brain structure volume over time; associated p-values are parenthesized
Discussion
The Sanfilippo Behavior Rating Scale (SBRS) assesses the behavioral phenotype of children with Sanfilippo syndrome and its progression over time. This scale incorporates elements of the Klüver-Bucy-like syndrome we have previously described [4] as well as behaviors described by parents and those noted in the literature and observed in clinical settings. We have validated deficiences in fear, social emotional response, executive function as well as abnormal activity as part of the Sanfilippo behavioral phenotype. Narrower behavioral domains including orality and mood/anger/aggression were also described and have moderately significant relationships to other behavioral measures.
Loess trajectory analysis showed increasing problems with Social/Emotional Dysfunction, Lack of Fear, and Executive Dysfunction with age. Movement, Orality and Mood/Anger/Aggression decelerated at older ages, particularly Movement, which reached a peak around 6 years and then declined.
Each SBRS behavior group has a different profile of associations with the ADOS, Vineland and brain volume change, suggesting that the SBRS scales measure distinctly different aspects of neurobehavioral function. Lack of Fear had a significant association with reductions in amygdala volumes across visits, consistent with our previous findings and hypothesized specific relationship. This result complements the recent finding that larger amygdalae are correlated with greater fearfulness in normal girls [23] and is consistent with the hypothesis that the behaviors associated with Sanfilippo syndrome are a variant of Klüver-Bucy syndrome [4].
Lack of Fear also had more significant associations with the ADOS and Vineland scales than did other SBRS behavior group, suggesting it may be the most salient and/or sensitive marker of disease progression in the SBRS.
The SBRS Movement cluster was appropriately associated with the Vineland motor scale and was the only SBRS scale to have such association, providing discriminant validity. This cluster is also distinguished from other SBRS measures by its inverted ‘U’ Loess trajectory. The decline in this cluster may reflect the reduction in the children’s purposeless locomotion and object handling that comes with age.
An additional, exploratory finding was that declines in hippocampal volume were associated with twice the effect on the Social-Emotional cluster as declines in amygdala volume (0.31 versus 0.14, respectively). This finding is consistent with studies implicating the hippocampus in attachment processes [24,25] and in social emotions (e.g., joy and sadness) but not in non-social emotions (e.g., appetite and disgust [26]). However, because this observation is exploratory, replication in future studies is needed.
Considering the validity measures, the Vineland Communication scale is associated with 5 of the SBRS measures; three of these associations were highly significant. This suggests that among measures used in this study, Vineland Communication was the most sensitive to disease progression. The VABS is an estimator of cognitive ability in this population [16], which is the primary and strongest measure of disease progression and decline in MPS III.
The major limitation of this study is the small sample size, an unavoidable consequence of studying a rare disease. In addition, test-retest and interobserver reliability were not performed in this investigation. The SBRS was developed from a theoretical perspective combined with empirical observations. As such, it provides a window into the unique behavioral phenotype of MPS III. With additional validation and honing, it can be used to measure the behavior change that accompanies disease progression and/or results from treatment.
Support.
Shire supported this study through an investigator initiated research grant “Characterizing the neurobehavioral phenotype of MPS IIIA , E. Shapiro, P.I.” and through a natural history clinical trial “A Longitudinal, Prospective, Natural History Study of Patients with Sanfilippo Syndrome Type A (MPS IIIA)” NCT01047306. (Baseline data from the Vineland Adaptive Behavior Scales and cortical gray matter volumes were contributed by Shire for these children). C.Whitley, P.I.
The Lysosomal Disease Network (U54NS065768) supported this study through a pilot study called “Characterizing the neurobehavioral phenotype of MPS III , M. Potegal, P.I.” The Lysosomal Disease Network (U54NS065768) is a part of the NCATS Rare Diseases Clinical Research Network (RDCRN). RDCRN is an initiative of the Office of Rare Diseases Research (ORDR), NCATS, funded through a collaboration between NCATS and the National Institute of Neurological Disorders and Stroke (NINDS), and the National Institute of Diabetes and Digestive and Kidney Diseases (NIDDK).” The content is solely the responsibility of the authors and does not necessarily represent the official views of the NIH.
This project was supported in part by the National Center for Advancing Translational Sciences, National Institutes of Health, UMN-CTSI (UL1TR000114 Drs. Rudser and Wey). The contents of this paper are solely the responsibility of the authors and do not necessarily represent the official views of the NIH.
Highlights.
A 68 item disease-specific behavior rating scale for Sanfilippo syndrome was developed to be used for clinical and treatment monitoring.
Scales include: Movement, Lack of fear, Social/emotional and Executive Dysfunction each showing a unique trajectory over time.
Reduced fearfulness may be the most salient/sensitive behavioral marker of disease progression.
Acknowledgments
We thank the participants for their cooperation in this project as well as Victor Kovac and Brianna Yund for their assistance with this research. We also thank the Center for Neurobehavioral Development, the Center for Magnetic Resonance Research, and the Minnesota Supercomputer Center for the provision of infrastructure for this research. We also thank the MPS Society for their help in the anonymous distribution of the initial SBRS to Sanfilippo patients in their database.
Footnotes
Publisher's Disclaimer: This is a PDF file of an unedited manuscript that has been accepted for publication. As a service to our customers we are providing this early version of the manuscript. The manuscript will undergo copyediting, typesetting, and review of the resulting proof before it is published in its final citable form. Please note that during the production process errors may be discovered which could affect the content, and all legal disclaimers that apply to the journal pertain.
The scales and the manual of administration can be obtained from the University of Minnesota web site at the following link: z.umn.edu/sbrs
References
- 1.Hopwood J. Sanfilippo Syndrome: Clinical genetic diagnosis and therapies. In: Barranger J, editor. Lysosomal storage disorders. Springer; New York: 2007. pp. 415–432. [Google Scholar]
- 2.Héron B, Mikaeloff Y, Froissart R, Caridade G, Maire I, Caillaud C, et al. Incidence and natural history of mucopolysaccharidosis type III in France and comparison with United Kingdom and Greece. Am J Med Genetics Part A. 2011;155(1):58–68. doi: 10.1002/ajmg.a.33779. [DOI] [PubMed] [Google Scholar]
- 3.Cleary MA, Wraith JE. Management of mucopolysaccharidosis type III. Arch Dis Childhood. 1993;69(3):403–406. doi: 10.1136/adc.69.3.403. [DOI] [PMC free article] [PubMed] [Google Scholar]
- 4.Potegal M, Yund B, Rudser K, Ahmed A, Delaney K, Nestrasil I, Whitley CB, Shapiro EG. Mucopolysaccharidosis Type IIIA presents as a variant of Klüver–Bucy Syndrome. J of Clin Exp Neuropsych. 2013;35(6):608–616. doi: 10.1080/13803395.2013.804035. [DOI] [PMC free article] [PubMed] [Google Scholar]
- 5.Colville GA, Bax MA. Early presentation in the mucopolysaccharide disorders. Child Care Hlth Dev. 1996;22(1):31–36. [PubMed] [Google Scholar]
- 6.Robertson SP, Klug GL, Rogers JG. Cerebrospinal fluid shunts in the management of behavioural problems in Sanfilippo syndrome (MPS III) Eur J Pediatr. 1998;157(8):653–655. doi: 10.1007/s004310050904. [DOI] [PubMed] [Google Scholar]
- 7.Buss KA, Goldsmith HH. Manual and normative data for the Laboratory Temperament Assessment Battery—Toddler Version (Tech Rep) Department of Psychology, University of Wisconsin; Madison, WI: 2000. [Google Scholar]
- 8.Neylan T. Temporal lobe and behavior: Klüver and Bucy’s classic. J Neuropsychiatry. 1997;9:606–620. doi: 10.1176/jnp.9.4.606. [DOI] [PubMed] [Google Scholar]
- 9.Rumsey RK, Rudser K, Delaney K, Potegal M, Whitley CB, Shapiro E. Acquired Autistic Behaviors in Children with Mucopolysaccharidosis Type IIIA. J Pediatr. 2014;164(5):1147–1151. doi: 10.1016/j.jpeds.2014.01.007. [DOI] [PMC free article] [PubMed] [Google Scholar]
- 10.Mosconi MW, Cody-Hazlett H, Poe MD, Gerig G, Gimpel-Smith R, Piven J. Longitudinal study of amygdala volume and joint attention in 2-to 4-year-old children with autism. Arch Gen Psychiat. 2009;66(5):509–516. doi: 10.1001/archgenpsychiatry.2009.19. [DOI] [PMC free article] [PubMed] [Google Scholar]
- 11.Schumann CM, Bauman MD, Amaral DG. Abnormal structure or function of the amygdala is a common component of neurodevelopmental disorders. Neuropsychologia. 2011;49(4):745–759. doi: 10.1016/j.neuropsychologia.2010.09.028. [DOI] [PMC free article] [PubMed] [Google Scholar]
- 12.Ruppert D, Wand MP, Carroll RJ. Semiparametric regression (No. 12) Cambridge University Press; 2003. [Google Scholar]
- 13.Buchanan TW, Etzel JA, Adolphs R, Tranel D. The influence of autonomic arousal and semantic relatedness on memory for emotional words. Int J Psychophysiol. 2006;61(1):26–33. doi: 10.1016/j.ijpsycho.2005.10.022. [DOI] [PubMed] [Google Scholar]
- 14.Mond JM, Hay PJ, Rodgers B, Owen C. Comparing the health burden of eating-disordered behavior and overweight in women. J Women’s Health. 2009;18(7):1081–1089. doi: 10.1089/jwh.2008.1174. [DOI] [PubMed] [Google Scholar]
- 15.Sparrow SS, Cicchetti DV, Balla DA. Vineland adaptive behavior scales. 2. Psychological Corporation; San Antonio TX: 2005. [Google Scholar]
- 16.Delaney K, Rudser K, Yund B, Whitley CB, Haslett P, Shapiro E. Methods in neuropsychological assessment in children with neurodegenerative disease: Sanfilippo syndrome. J Inherit Metab Dis Reports. 2013 doi: 10.1007/8904_2013_269. [DOI] [PMC free article] [PubMed] [Google Scholar]
- 17.Gotham K, Risi S, Pickles A, Lord C. The Autism Diagnostic Observation Schedule: Revised algorithms for improved diagnostic validity. J Autism Dev Disord. 2007;37(4):613–627. doi: 10.1007/s10803-006-0280-1. [DOI] [PubMed] [Google Scholar]
- 18.Fischl B, Salat DH, Busa E, Albert M, Dieterich M, Haselgrove C, et al. Whole brain segmentation: automated labeling of neuroanatomical structures in the human brain. Neuron. 2002;33(3):341–55. doi: 10.1016/s0896-6273(02)00569-x. [DOI] [PubMed] [Google Scholar]
- 19.Ahmed A, Nestrasil I, Rudser K, Shapiro EG. Reliability of manual and automated tracing of hippocampal volumes in MPS patients and normal controls: A report of the neuroimaging core of the lysosomal disease network. Mol Genet Metab. 2010;99(2):S9. [Google Scholar]
- 20.Magnotta VA, Harris G, Andrease NC, O’Leary DS, Yuh WT, Heckel D. Structural MR image processing using the BRAINS2 toolbox. Comput Med Imag Grap. 2002;26:251–264. doi: 10.1016/s0895-6111(02)00011-3. [DOI] [PubMed] [Google Scholar]
- 21.Buss C, Davis EP, Shahbaba B, Pruessner JC, Head K, Sandman CA. Maternal cortisol over the course of pregnancy and subsequent child amygdala and hippocampus volumes and affective problems. P Natl Acad Sci. 2012;109(20):E1312–E1319. doi: 10.1073/pnas.1201295109. [DOI] [PMC free article] [PubMed] [Google Scholar]
- 22.Diggle P, Heagerty P, Liang KY, Zeger S. Analysis of longitudinal data. 2. Oxford University Press; 2002. [Google Scholar]
- 23.van der Plas EA, Boes AD, Wemmie JA, Tranel D, Nopoulos P. Amygdala volume correlates positively with fearfulness in normal healthy girls. Soc Cogn Affect Neur. 2010;5(4):424–431. doi: 10.1093/scan/nsq009. [DOI] [PMC free article] [PubMed] [Google Scholar]
- 24.Buchheim A, Erk S, George C, Kachele H, Kircheret T, Martius P, et al. Neural correlates of attachment trauma in borderline personality disorder: a functional magnetic resonance imaging study. Psychiat Res-Neuroim. 2008;163(3):223–235. doi: 10.1016/j.pscychresns.2007.07.001. [DOI] [PubMed] [Google Scholar]
- 25.Quirin M, Gillath O, Pruessner JC, Eggert LD. Adult attachment insecurity and hippocampal cell density. Soc Cogn Affect Neur. 2010;5(1):39–47. doi: 10.1093/scan/nsp042. [DOI] [PMC free article] [PubMed] [Google Scholar]
- 26.Britton JC, Phan KL, Taylor SF, Welsh RC, Berridge KC, Liberzon I. Neural correlates of social and nonsocial emotions: An fMRI study. Neuroimage. 2006;31(1):397–409. doi: 10.1016/j.neuroimage.2005.11.027. [DOI] [PubMed] [Google Scholar]