

Abstract
The clusters of the influenza envelope protein, hemagglutinin, within the plasma membrane are hypothesized to be enriched with cholesterol and sphingolipids. Here, we directly tested this hypothesis by using high-resolution secondary ion mass spectrometry to image the distributions of antibody-labeled hemagglutinin and isotope-labeled cholesterol and sphingolipids in the plasma membranes of fibroblast cells that stably express hemagglutinin. We found that the hemagglutinin clusters were neither enriched with cholesterol nor colocalized with sphingolipid domains. Thus, hemagglutinin clustering and localization in the plasma membrane is not controlled by cohesive interactions between hemagglutinin and liquid-ordered domains enriched with cholesterol and sphingolipids, or from specific binding interactions between hemagglutinin, cholesterol, and/or the majority of sphingolipid species in the plasma membrane.
Introduction
Decades of research have revealed that proteins are nonrandomly distributed within the plasma membranes of mammalian cells, and this nonrandom protein distribution is correlated with both normal cell function and disease (1–7). For example, the clustering of the influenza envelope protein, hemagglutinin, in the plasma membranes of virus-infected cells is correlated with influenza virus budding (4). Although the nonrandom clustering of many proteins, including influenza hemagglutinin, is sensitive to cellular cholesterol and sphingolipid levels (1,4,6–15), the mechanisms responsible for this lipid-sensitive protein clustering are not well understood.
Early studies revealed that the influenza viral envelope contains high levels of cholesterol and sphingolipids (16), and is more ordered than the plasma membranes of erythrocyte ghosts (17). These results combined with the finding that cholesterol, sphingolipids, and saturated lipids form liquid-ordered domains in model membranes (18,19) contributed to the hypothesis that cholesterol and sphingolipids form ordered plasma membrane domains, which are referred to as lipid rafts (20–22). Certain membrane proteins, such as hemagglutinin, are thought to have an affinity for ordered lipid domains, which causes them to accumulate and cluster within cholesterol- and sphingolipid-enriched regions in the plasma membrane (9,20,23). In support of this hypothesis, hemagglutinin is recovered in a detergent-resistant membrane fraction that is enriched with cholesterol, sphingolipids, and saturated lipids (4,9,18,19,24–27), though later reports showed that detergent-resistant membranes do not reflect native membrane composition (28,29). Nonetheless, the finding that depletion of cellular cholesterol or sphingolipids is detrimental to influenza virus replication (4,30–32) is consistent with the hypothesized recruitment of hemagglutinin to lipid raft domains.
Recent studies have focused on testing the hypothesis that hemagglutinin is selectively recruited to ordered membrane domains (8,33–37). However, the local abundance of cholesterol and sphingolipids can only be inferred from these biophysical measurements. Though recent lipidome analyses confirm that the influenza viral envelope is enriched with certain sphingolipid species (38) and cholesterol (39), the question remains, is the site of hemagglutinin clustering in the plasma membrane enriched with cholesterol and sphingolipids? Such enrichment might result from a putative affinity of hemagglutinin for the ordered cholesterol- and sphingolipid-enriched domains that many hypothesize are present in the plasma membrane. Alternatively direct, cohesive interactions between hemagglutinin, cholesterol, and the majority of sphingolipid species in the plasma membrane may enrich the hemagglutinin clusters with cholesterol and sphingolipids.
In a recent report, we began to address this question by using fluorescence microscopy to visualize colocalization between metabolically incorporated fluorescent sphingolipids and fluorophore-labeled antihemagglutinin Fab fragments in the plasma membranes of mouse fibroblast cells that stably expressed hemagglutinin (clone 15 cell line) (40). We found only partial colocalization between the biosynthetically incorporated fluorescent sphingolipids and immunolabeled hemagglutinin in the plasma membranes of the clone 15 cells (40). This finding may suggest hemagglutinin clustering is neither due to the speculated favorable interactions specific to the ordered cholesterol- and sphingolipid-enriched domains that many hypothesize are present in the plasma membrane, nor from presumably cohesive interactions with sphingolipids. However, the interactions that direct the localization of the hemagglutinin clusters in the plasma membrane may have been altered by the fluorophores used to visualize the sphingolipids (41–44).
We have recently reported the use of a high-resolution secondary ion mass spectrometry (SIMS) approach for imaging rare stable isotope-labeled sphingolipids and cholesterol in the plasma membrane without fluorophore labels (40,45,46). In this approach, distinct stable isotopes are metabolically incorporated into the cellular lipid species of interest. The resulting stable isotope-labeled lipids have the same chemical structure as the analogous unlabeled lipid, so these stable isotopes do not alter the interactions or trafficking of the components that they label. High-resolution SIMS, which is then performed with a Cameca NanoSIMS 50 (Cameca, Gennevilliers Cedex, France), is used to map the lipid-specific isotope enrichments on the surface (top few nanometers) of the cells with ∼100-nm-lateral resolution (40,45,46). Using this approach, we found sphingolipid domains that were not enriched with cholesterol in the plasma membranes of fibroblast cells (40,46).
Here, we assess whether hemagglutinin clusters are enriched with cholesterol and sphingolipids by using high-resolution SIMS to simultaneously image 15N-sphingolipids, 18O-cholesterol, and immunolabeled hemagglutinin in the plasma membrane. To ensure that the hemagglutinin distributions we observed were not due to interactions with other virus proteins or virus particle assembly, we used a mouse fibroblast cell line that stably expresses hemagglutinin (clone 15 cell line) for this study. Our data show conclusively that the hemagglutinin clusters were not enriched with cholesterol. Moreover, we found minimal colocalization between the hemagglutinin clusters and the sphingolipid domains within the plasma membrane. Thus, hemagglutinin clustering and localization in the plasma membrane is not controlled by its putative affinity for ordered domains that are hypothetically enriched with cholesterol and sphingolipids, or by direct, cohesive interactions with cholesterol and/or the majority of the sphingolipid species within the plasma membrane.
Materials and Methods
Materials
The Clone 15 cell line was obtained by transfecting NIH 3T3 mouse fibroblast cells with a DNA plasmid for hemagglutinin from the 1957 pandemic Japan strain of influenza. Standard techniques were used to select stably transfected cells. High-glucose Dulbecco’s modified Eagle’s medium (DMEM) was prepared by the Cell Media Facility in the School of Chemical Sciences at the University of Illinois. Lipid-reduced fetal bovine serum (FBS) and calf serum were purchased from Hyclone (Logan, Utah). Fatty acid-free bovine serum albumin (BSA) and other cell culture materials were obtained from Sigma (St. Louis, MO). Poly-L-lysine and chemical preservation reagents were purchased from Electron Microscopy Sciences (Hatfield, PA). Silicon substrates (5 mm × 5 mm) were purchased from Ted Pella (Redding, CA). The 15N-sphingolipid precursors, 15N-sphingosine, and 15N-sphinganine, were synthesized from 15N-serine (Cambridge Isotope Laboratories, Tewksbury, MA) using reported methods (47,48). The 18O-cholesterol was synthesized from i-cholesteryl methyl ether that was purchased from Sigma and 18O-water that was purchased from Olinax (Hamilton, Ontario, Canada), as previously reported (49). The hemagglutinin was immunolabeled using a primary antibody (FC 125 antihemagglutinin) developed in mouse and fluorinated colloidal gold (average diameter = 20 nm) immunolabels that were synthesized as previously reported (50).
Cell culture and metabolic labeling
Clone 15 cells were cultured in high-glucose DMEM with 10% calf serum, 104 units/mL penicillin G, and 10 mg/mL streptomycin at 37°C and 5% CO2. To metabolically incorporate nitrogen-15 into the cellular sphingolipids and oxygen-18 into the cellular cholesterol, the cells were maintained in culture media that contained 3.2 μM of 15N-sphingolipid precursors (1:1 mol ratio of 15N-sphingosine and 15N-sphinganine) and 20 μM ethanolamine for 3 days. After the third day, the cells were passaged into DMEM that was supplemented with 10% (v/v) lipid-reduced FBS, 1% (v/v) calf serum, 3.2 μM 15N-sphingolipid precursors, 50 μM 18O-cholesterol (2:5 mass ratio of 18O-cholesterol/fatty acid-free BSA), and 20 μM ethanolamine. On the fourth day, the 15N-sphingolipid precursors, 18O-cholesterol, and ethanolamine were added to produce concentrations of 3.2, 50, and 20 μM, respectively. On the fifth day, the cells were passaged into dishes containing poly-L-lysine-coated silicon substrates and incubated in the labeling media at 37°C and 5% CO2 for one additional day. The substrates with attached cells were immunolabeled and prepared for high-resolution SIMS analysis as described below. The incorporation of the rare stable isotopes into the cellular sphingolipids and cholesterol was assessed by using the cells that remained adhered to the culture dish. The lipids were extracted from the cells as previously reported (40,45,51). The nitrogen-15 incorporation into the cellular sphingomyelin and oxygen-18 incorporation into the cellular cholesterol were measured with liquid chromatography-mass spectrometry and gas chromatography-mass spectrometry, respectively, as reported (45,46). For a separate experiment, another set of Clone 15 cells were metabolically labeled such that they contained 15N-sphingolipids, but not 18O-cholesterol, by omitting the 18O-cholesterol from the labeling media and using calf serum in place of the delipidated FBS.
Immunolabeling
The substrates with adherent cells were rinsed twice with phosphate buffered saline (PBS) with calcium (Ca) and magnesium (Mg) and twice with Hendry’s phosphate buffer (HPB). The cells were fixed for 10 min with 2% paraformaldehyde and 0.05% glutaraldehyde in 0.1 M HPB. After rinsing the samples twice with HPB and once with PBS without Ca and Mg, the samples were blocked with immunowash buffer (1% BSA in PBS without Ca and Mg), incubated with 15 μL of 0.18 mg/mL primary antibody for 30 min, and then rinsed twice with immunowash buffer to remove unbound antibody. The samples were incubated with 25 μL of freshly filtered (0.1 μm syringe filter) fluorinated colloidal gold immunolabels (average diameter = 20 nm (50)), diluted in 0.1 M Na2HPO4 buffer, pH 7.5) for 30 min, and then were rinsed once with immunowash buffer and once with HPB. The same protocol was used to prepare the immunolabel-free control cells, but the primary antibody was omitted.
Cell preservation
The cell samples were preserved as we have previously described (40,45,46,50). Briefly, the samples were fixed with 4% glutaraldehyde in HPB for 30 min. After washing twice with HPB and once with water, the samples were postfixed with freshly filtered (0.22 μm syringe filter) 1% OsO4 for 15 min, rinsed three times with water, and dried under ambient conditions.
High-resolution SIMS analysis
The samples were coated with 3 nm of iridium (99.95% Ir) using a Cressington 208HR High Resolution Sputter Coater with a rotary-planetary-tilting stage and Cressington MTM-20 High Resolution Thickness Controller (Watford, UK). Prior reports establish that this thin metal coating does not alter the lipid distribution on the cell surface (52) or induce the artifactual appearance of isotope-enriched domains on the cell surface (40). High-resolution SIMS was performed on a NanoSIMS 50 instrument (Cameca) at Lawrence Livermore National Laboratory. To image the distributions of 18O-cholesterol, 15N-sphingolipids, and the hemagglutinin labeled with fluorinated colloidal gold immunolabels, the 16O−, 18O−, 19F−, 12C14N−, 12C15N−, and 13C14N−, secondary ions were collected using a static magnetic field and electrostatic peak switch at mass 27. Mass table 1 in scans 1, 3, 5, and 7 was 16O−, 18O−, 19F−, 12C14N−, and 12C15N−; mass table 2 in scans 2, 4, 6, and 8 was 16O−, 18O−, 12C14N−, and 13C14N−. A mass resolving power of ∼6700 was used. 15 μm × 15 μm regions were analyzed using a 0.077 pA, 16 keV 133Cs+ primary ion beam with a spot size of ∼70 nm and a dwell time of 1 ms/pixel. Eight replicate scans of 512 × 512 pixels (pixel size = 29 nm by 29 nm) were acquired at each analysis region, resulting in a primary ion dose of 4.5 × 10¹⁴ ions/cm2. These conditions were used to image the 18O-cholesterol, 15N-sphingolipids, and the hemagglutinin labeled with fluorinated colloidal gold immunolabels on two different immunolabeled Clone 15 cells, and one immunolabel-free clone 15 cell.
To image the sphingolipid and hemagglutinin distributions within large regions of the plasma membrane, images consisting of 4 replicate scans of 256 × 256 pixels (pixel size = 59 nm by 59 nm) were acquired at 15 μm × 15 μm regions. Each image was acquired using a 0.264 pA primary ion beam with a spot size of ∼100 nm and a dwell time of 1 ms/pixel. This corresponds to a primary ion dose of 1.9 × 10¹⁴ ions/cm2. Each analysis overlapped with the preceding region that was analyzed to facilitate stitching the resulting SIMS images together in a mosaic. The 12C14N−, 12C15N−, and 19F− secondary ions, and secondary electrons were simultaneously collected. These analysis conditions were used to image the 15N-sphingolipids and fluorinated immunolabeled hemagglutinin on five different cells that were supported on two different substrates.
Image analysis
NanoSIMS data were processed with a custom software package (LIMAGE, L.R. Nittler, Carnegie Institution of Washington, Washington, DC) run on the PV-Wave platform (Rogue Wave Software, Boulder, CO). To minimize random variations in the signal intensity, a 3 × 3-pixel boxcar smoothing algorithm was applied to the SIMS images, which makes the value at a given pixel the average ratio of the 3 × 3 pixel region that is centered around that pixel. This smoothing resulted in a lateral resolution of 87 nm in the 512 by 512 pixel images that were acquired with a 70-nm-diameter analysis beam, and 176 nm in the 256 × 256 pixel images that were acquired with a 100-nm-diameter analysis beam. Quantitative 15N- and 18O-enrichment images were constructed by taking the ratio of the secondary ion counts of the rare to the corresponding abundant isotope at each pixel (12C15N−/12C14N− and 18O−/16O−, respectively); these ratios minimize variations in the measured isotope enrichment caused by cell topography and changes in ion count rates (40,45,53,54). The units of enrichment are based on dividing the measured ratios by the standard natural abundance ratios (0.00367 and 0.0020052, respectively). This process produces a quantitative measure of the local abundance of rare isotope-labeled molecules compared to an unlabeled (natural abundance) cell (40,45,53,54). A thermal color scale was used to represent the 15N- and 18O-enrichments at each pixel in the SIMS image. The MATLAB Statistics Toolbox (The MathWorks, Natick, MA) was used to determine the statistically significant thresholds for 15N-enrichment that signify 15N-sphingolipid domains, and the statistically significant thresholds for the 19F− secondary ion intensities that signify hemagglutinin clusters. The locations of the 15N-sphingolipid domains were defined with a particle definition algorithm performed with the aforementioned custom software package, LIMAGE. In this algorithm, the centers of the 15N-sphingolipid domains were defined as the pixels where the 15N-enrichment was a local maximum and at least 2 SD above the mean 15N-enrichment for the nondomain membrane regions (55). The edges of the domains were defined by moving out from the center until the 15N-enrichment dropped below the Gaussian diameter, which is 13.5% (1/e2) of the 15N-enrichment at the domain center, or another domain was encountered.
The MATLAB Statistics Toolbox was used to perform two-sample Kolmogorov-Smirnov tests for statistically significant differences in the 15N-sphingolipid domains. The two-sample Kolmogorov-Smirnov test compares the distance between the empirical cumulative distribution functions of the data in each set to determine whether the data in the two sets differ (56). The advantage of this test is that it does not make assumptions about the distribution of the data (i.e., it does not need to be a normal distribution) (57). In this work, we compared a data set consisting of the 19F− counts detected within each 15N-sphingolipid domain on a cell to a data set consisting of the 19F− counts detected within equally sized nondomain regions on the same cell. The two-sample Kolmogorov-Smirnov test returns two outputs: h and p. The value of h is either 0 or 1, whereas the value of p is between 0 and 1. An output of h = 0 indicates a failure to reject the null hypothesis that the data in the two sets are from the same distribution, which means the 19F− signal intensities within the two data sets are not statistically different. In contrast, h = 1 indicates rejection of the null hypothesis, meaning a statistically significant difference was found between the 19F− signal intensities in the two data sets. The p-value is the probability of obtaining the observed measurements if the null hypothesis is true. The null hypothesis is rejected at the 95% confidence level when the p-value is <0.05.
Results
Here, we studied clone 15 cells that stably express hemagglutinin instead of influenza-infected cells to ensure that the hemagglutinin distributions we observed were only influenced by host cell components, and not by other influenza virus proteins or virus particle assembly. We first used high-resolution SIMS to image the distributions of 18O-cholesterol, 15N-sphingolipids, and immunolabeled hemagglutinin in the membranes of clone 15 cells. The cells were prepared by metabolically incorporating the rare stable isotopes nitrogen-15 and oxygen-18 into ∼90% of the cellular sphingolipids and 65% of the cellular cholesterol, respectively. Note that because the clone 15 line we employed stably expressed influenza hemagglutinin, the metabolic stable isotope incorporation did not need to be coordinated with viral protein expression. When metabolic labeling was complete, we selectively tagged the influenza hemagglutinin with fluorinated colloidal gold immunolabels; these labels produce distinctive 19F− secondary ions that permit their detection with high-resolution SIMS (50). The cells were chemically fixed with a method that does not disturb the lipid distribution in the plasma membrane (40), and coated with a thin layer (3 nm) of iridium that enhances the secondary ion signal intensities. It is noteworthy that this thin metal coating does not induce the lateral migration of lipids (52) or the artifactual appearance of isotope-enriched domains on the cell surface (40). Finally, we used high-resolution SIMS to map the 19F− secondary ions, 15N-enrichment, and 18O-enrichment on the surfaces of immunolabeled clone 15 cells. Metabolically labeled clone 15 cells that had not been immunolabeled were also imaged for comparison.
Regional elevations in 19F− secondary ions that are characteristic of immunolabeled hemagglutinin clusters (50) were detected in the plasma membrane of the immunolabeled clone 15 cell (Fig. 1). In comparison to the immunolabeled clone 15 cell (1,178 19F− counts/μm2), relatively few 19F− secondary ions were detected on the immunolabel-free clone 15 cell (55 19F− counts/μm2), confirming the specificity of the 19F− ion signal for the immunolabels. Consistent with our previous reports (40,46), local elevations in 15N-enrichment, and thus 15N-sphingolipids, were present in the plasma membranes of the immunolabeled and immunolabel-free clone 15 cells (Fig. 1). Comparison of the 19F− and 15N-enrichment images acquired on the immunolabeled clone 15 cell (Fig. 1) suggests little colocalization between the hemagglutinin clusters and sphingolipid domains. The 18O-enrichment images show an absence of domains enriched with 18O-cholesterol in the plasma membranes of both clone 15 cells (Fig. 1), which is consistent with our previous finding of a fairly uniform cholesterol distribution in the plasma membranes of mouse fibroblasts (46). High-resolution SIMS imaging revealed similar distributions of 15N-sphingolipids, 18O-cholesterol, and immunolabeled hemagglutinin in the plasma membrane of the other immunolabeled clone 15 cell that we analyzed. The absence of cholesterol-enrichment at the sites of hemagglutinin clustering refutes the hypothesis that hemagglutinin is recruited to cholesterol-enriched ordered lipid domains in the plasma membrane. Consequently, hemagglutinin clustering within the plasma membrane cannot be attributed to a postulated affinity for ordered cholesterol-rich domains.
Figure 1.

High-resolution SIMS images of metabolically labeled clone 15 cells with and without hemagglutinin-specific fluorinated immunolabels. Locally high counts of 19F− secondary ions that are characteristic of clusters of immunolabeled hemagglutinin are visible on the immunolabeled clone 15 cell. In comparison to the immunolabeled clone 15 cell (1178 19F− counts/μm2), relatively few 19F− secondary ions (55 19F− counts/μm2) were detected on the clone 15 cell that was not immunolabeled with hemagglutinin-specific fluorinated colloidal gold affinity labels. Local elevations in 15N-enrichment that signify regionally high concentrations of 15N-sphingolipids are visible on both cells. Statistically significant local elevations in 18O-enrichment, and thus, 18O-cholesterol, within the plasma membrane were not detected on either cell. To see this figure in color, go online.
The previous results exclude the possibility that hemagglutinin is associated with sphingolipid-rich membrane domains due to its postulated preferential association with ordered lipid domains that are produced by preferential cholesterol and sphingolipid packing. However, hemagglutinin might cluster within sphingolipid-enriched domains if it has an affinity for either the sphingoid backbone, or for a potentially distinct biophysical environment defined by the electrostatic properties (i.e., dipole potential and surface potential) within the sphingolipid domains. Therefore, we next focused on quantitatively assessing the extent of colocalization between the hemagglutinin clusters and sphingolipid domains. In these studies, we used high-resolution SIMS to image the distributions of these two components within a large fraction of the dorsal surface of a clone 15 cell. The clone 15 cells had been metabolically labeled so that ∼80% of their sphingolipids contained the nitrogen-15 isotope, and the hemagglutinin in their membranes had been tagged with fluorinated colloidal gold immunolabels. Fig. 2 shows the mosaics of the secondary electron, 19F− secondary ion, and 15N- enrichment images that were acquired in parallel with a NanoSIMS 50 instrument. The mosaic of secondary electron images show which portions of the analysis area correspond to the surface of the cell, its perimeter, and the substrate (Fig. 2 a). Numerous 15N-sphingolipid domains and fluorine-rich immunolabeled hemagglutinin clusters were detected in the plasma membrane of the clone 15 cell (Fig. 2, b and c). However, the overlay of the 15N-enrichment and 19F− secondary ion images (Fig. 3) shows little colocalization between the hemagglutinin clusters and the sphingolipid domains. Quantitative assessment of the SIMS images confirmed this conclusion, as only 34 of the 194 hemagglutinin-rich regions were colocalized with sphingolipid domains, where the hemagglutinin-rich regions and sphingolipid domains were defined as statistically significant elevations in the 19F− counts and 15N-enrichment, respectively. Furthermore, a two-sample Kolmogorov-Smirnov test indicated that the 19F− counts in the sphingolipid domains were not statistically different from the non-domain regions (h = 0, p = 0.26). Likewise, little colocalization between the fluorine-rich immunolabeled hemagglutinin clusters and 15N-sphingolipid domains was observed at the regions on the four other cells that we analyzed in this experiment (17 of 97, 2 of 24, 36 of 328, and 10 of 174 hemagglutinin-rich regions were colocalized with sphingolipid domains). Note that our previous report of imaging all membrane lipids in parallel with immunolabeled hemagglutinin rules out the possibility that the observed absence of sphingolipid enrichment at the sites of hemagglutinin clustering is caused by a reduction in all membrane lipids at these sites (50). Therefore, we conclude that hemagglutinin does not preferentially localize within sphingolipid domains in the plasma membranes of fibroblasts cells that stably express hemagglutinin. Consequently, hemagglutinin clustering in the plasma membrane does not appear to be induced by favorable interactions between hemagglutinin and the majority of the sphingolipid species in the plasma membrane, or from the recruitment of hemagglutinin to biophysically distinct sphingolipid-rich domains.
Figure 2.

Mosaics of secondary electron, secondary ion, and isotope enrichment images were constructed from numerous individual SIMS images that were acquired at 15 μm × 15 μm regions on a clone 15 cell. (A) Mosaic of secondary electron images acquired with the NanoSIMS instrument shows the cell morphology. (B) Mosaic of 19F− secondary ion images reveals influenza hemagglutinin clusters on the surface of the clone 15 cell. (C) Mosaic of 15N-enrichment images shows the distribution of the 15N-sphingolipids within the plasma membrane. To see this figure in color, go online.
Figure 3.
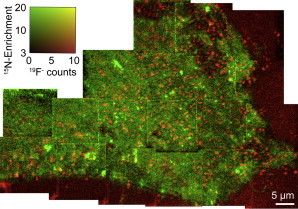
Composite 19F− secondary ion and 15N-enrichment images of a clone 15 cell. The 19F− (red) and 15N-enrichment (green) images that are shown in Fig. 2 were overlaid to facilitate visual assessment of signal colocalization. To see this figure in color, go online.
Discussion
Specific steps in influenza virus replication have been associated with distinct hemagglutinin organizations in the host cell’s plasma membrane. For example, late in the infection cycle, hemagglutinin accumulation in the plasma membrane activates the Ras/MEK/ERK signaling cascade that is required for nuclear export of the viral ribonucleoprotein complexes (58). Additionally, the release of infectious influenza viruses from the host cell is preceded by the formation of large clusters of hemagglutinin within the plasma membrane (59). This hemagglutinin clustering is often attributed to its recruitment to ordered membrane domains that are enriched with sphingolipids and cholesterol (39,60). In contrast to this hypothesis, here we have found that in the absence of other viral components, the hemagglutinin clusters were not enriched with cholesterol or colocalized with sphingolipid domains in the plasma membrane. This lack of colocalization between hemagglutinin and sphingolipids is consistent with our previous results of imaging fluorescent sphingolipids in parallel with fluorophore-labeled Fab fragments in living cells (40). This consistency rules out the possibilities that the cell fixation or secondary antibodies used for high-resolution SIMS imaging altered the findings reported herein. Thus, we reject the long-standing hypothesis that hemagglutinin has an affinity for liquid-ordered domains that are putatively produced by preferential cholesterol and sphingolipid packing. Based on our findings, we also conclude that cohesive molecular interactions between hemagglutinin, cholesterol, and/or all sphingolipid species, are not sufficient to recruit these components to distinct membrane domains.
Our conclusion that hemagglutinin’s postulated affinity for an ordered environment produced by preferential cholesterol and sphingolipid packing is not responsible for its membrane organization is consistent with recent studies that probed the biophysical properties of the plasma membrane domain where hemagglutinin clusters reside. For example, magic angle spinning NMR analysis showed primarily disordered lipid domains in intact influenza viruses at physiological temperatures (33). Likewise, fluorescence microscopy revealed that hemagglutinin predominantly resides within liquid disordered domains in synthetic vesicles or vesicles derived from the plasma membrane (34). Though hemagglutinin organization in cellular membranes is often found to be cholesterol sensitive (8,35–37), biophysical behaviors that are inconsistent with hemagglutinin localization within cholesterol-rich ordered membrane domains have also been reported (8,35,36). Such results suggest that lipid phase behavior is not the sole determinant of hemagglutinin clustering in the plasma membrane.
In light of these findings, what mechanisms might be responsible for the reported enrichment of the influenza viral envelope with cholesterol and sphingolipids (16,38,39)? Because we metabolically labeled and visualized all sphingolipid species in this study, we cannot rule out the possibility that hemagglutinin preferentially associates with a small number of less abundant sphingolipid subspecies within the plasma membrane. Favorable interactions with these distinct sphingolipid subspecies might arise due to specific interactions between hemagglutinin and certain glycosylated headgroups or distinctive fatty acid side chains. Likewise, this work does not exclude the possibility that the affinity of hemagglutinin for cholesterol and sphingolipids is modulated by other influenza virus components. Moreover, the finding that the inhibition of cellular phospholipase A2 (PLA2) reduces influenza virus production (61) could suggest that the elevated fractions of cholesterol and sphingolipids found in the influenza viral envelope reflect a depletion of phosphatidylcholine due to its degradation by PLA2 at the site of virus budding. Future work is required to assess these possibilities.
Our finding that hemagglutinin clustering is not induced by its affinity for cholesterol or sphingolipids is consistent with a recent report that the clustering of hemagglutinin in the plasma membranes of cells that stably express hemagglutinin is mediated by actin (62). Interestingly, although sphingolipids and cholesterol are primarily known for their roles as structural components in membranes, one sphingolipid, ceramide, and cholesterol are also involved in modulating the actin cytoskeleton. Specifically, ceramide is a signaling molecule that initiates cytoskeletal reorganization via activation of protein phosphorylation (63–65), whereas cholesterol depletion induces changes in cytoskeletal organization via an unknown mechanism (66–68). This suggests that sphingolipids and cholesterol may indirectly modulate hemagglutinin clustering through their effects on actin organization, and not by directly interacting with hemagglutinin. Efforts that probe the effects of cholesterol and sphingolipids on the cytoskeletal rearrangements required for virus budding are needed to explore this possibility.
Author Contributions
M.L.K., J.Z., and P.K.W. designed research, R.L.W., J.F.F., H.A.K., P.K.W., and M.L.K. performed research, R.L.W., J.F.F., H.A.K., and M.L.K. analyzed data, J.Z. contributed new reagents/analytical tools, and all authors contributed to writing the article.
Acknowledgments
This work was partially supported by a CASI from the Burroughs Wellcome Fund (to M.L.K.), the Intramural Program of the National Institute of Child Health and Human Development (NICHD), National Institutes of Health (NIH), the NIH Training Program in the Chemistry-Biology Interface T32 GM070421 (to J.F.F.), the National Science Foundation (NSF) under CHE–1058809, and Lab Directed Research and Development funding (to Lawrence Livermore National Laboratory (LLNL)). We thank Kaiyan Lou for the synthesis of the 15N-sphingolipid precursors and 18O-cholesterol. Work at LLNL was performed under the auspices of the U.S. DOE under contract DE-AC52-07NA27344.
Footnotes
Robert L. Wilson’s present address is Department of Chemistry, Pacific Union College, Angwin, CA 94508.
Jessica F. Frisz’s present address is Clinical Diagnostics Division, Thermo Fisher Scientific, Fremont, CA 94538.
References
- 1.Prior I.A., Muncke C., Hancock J.F. Direct visualization of Ras proteins in spatially distinct cell surface microdomains. J. Cell Biol. 2003;160:165–170. doi: 10.1083/jcb.200209091. [DOI] [PMC free article] [PubMed] [Google Scholar]
- 2.Deutsch E., Weigel A.V., Tamkun M.M. Kv2.1 cell surface clusters are insertion platforms for ion channel delivery to the plasma membrane. Mol. Biol. Cell. 2012;23:2917–2929. doi: 10.1091/mbc.E12-01-0047. [DOI] [PMC free article] [PubMed] [Google Scholar]
- 3.O’Connell K.M.S., Loftus R., Tamkun M.M. Localization-dependent activity of the Kv2.1 delayed-rectifier K+ channel. Proc. Natl. Acad. Sci. USA. 2010;107:12351–12356. doi: 10.1073/pnas.1003028107. [DOI] [PMC free article] [PubMed] [Google Scholar]
- 4.Takeda M., Leser G.P., Lamb R.A. Influenza virus hemagglutinin concentrates in lipid raft microdomains for efficient viral fusion. Proc. Natl. Acad. Sci. USA. 2003;100:14610–14617. doi: 10.1073/pnas.2235620100. [DOI] [PMC free article] [PubMed] [Google Scholar]
- 5.Plowman S.J., Muncke C., Hancock J.F. H-ras, K-ras, and inner plasma membrane raft proteins operate in nanoclusters with differential dependence on the actin cytoskeleton. Proc. Natl. Acad. Sci. USA. 2005;102:15500–15505. doi: 10.1073/pnas.0504114102. [DOI] [PMC free article] [PubMed] [Google Scholar]
- 6.Varma R., Mayor S. GPI-anchored proteins are organized in submicron domains at the cell surface. Nature. 1998;394:798–801. doi: 10.1038/29563. [DOI] [PubMed] [Google Scholar]
- 7.Sharma P., Varma R., Mayor S. Nanoscale organization of multiple GPI-anchored proteins in living cell membranes. Cell. 2004;116:577–589. doi: 10.1016/s0092-8674(04)00167-9. [DOI] [PubMed] [Google Scholar]
- 8.Hess S.T., Kumar M., Zimmerberg J. Quantitative electron microscopy and fluorescence spectroscopy of the membrane distribution of influenza hemagglutinin. J. Cell Biol. 2005;169:965–976. doi: 10.1083/jcb.200412058. [DOI] [PMC free article] [PubMed] [Google Scholar]
- 9.Scheiffele P., Roth M.G., Simons K. Interaction of influenza virus hemagglutinin with sphingolipid-cholesterol membrane domains via its transmembrane domain. EMBO J. 1997;16:5501–5508. doi: 10.1093/emboj/16.18.5501. [DOI] [PMC free article] [PubMed] [Google Scholar]
- 10.Fujita A., Cheng J., Fujimoto T. Gangliosides GM1 and GM3 in the living cell membrane form clusters susceptible to cholesterol depletion and chilling. Mol. Biol. Cell. 2007;18:2112–2122. doi: 10.1091/mbc.E07-01-0071. [DOI] [PMC free article] [PubMed] [Google Scholar]
- 11.Abdel Shakor A.B., Kwiatkowska K., Sobota A. Cell surface ceramide generation precedes and controls FcgammaRII clustering and phosphorylation in rafts. J. Biol. Chem. 2004;279:36778–36787. doi: 10.1074/jbc.M402170200. [DOI] [PubMed] [Google Scholar]
- 12.Lasserre R., Guo X.-J., He H.-T. Raft nanodomains contribute to Akt/PKB plasma membrane recruitment and activation. Nat. Chem. Biol. 2008;4:538–547. doi: 10.1038/nchembio.103. [DOI] [PubMed] [Google Scholar]
- 13.Zhao H., Loh H.H., Law P.Y. Adenylyl cyclase superactivation induced by long-term treatment with opioid agonist is dependent on receptor localized within lipid rafts and is independent of receptor internalization. Mol. Pharmacol. 2006;69:1421–1432. doi: 10.1124/mol.105.020024. [DOI] [PubMed] [Google Scholar]
- 14.Abdel Shakor A.B., Atia M.M., Sobota A. Cell surface ceramide controls translocation of transferrin receptor to clathrin-coated pits. Cell. Signal. 2012;24:677–684. doi: 10.1016/j.cellsig.2011.10.016. [DOI] [PubMed] [Google Scholar]
- 15.Grassmé H., Jekle A., Gulbins E. CD95 signaling via ceramide-rich membrane rafts. J. Biol. Chem. 2001;276:20589–20596. doi: 10.1074/jbc.M101207200. [DOI] [PubMed] [Google Scholar]
- 16.Klenk H.-D., Rott R., Becht H. On the structure of the influenza virus envelope. Virology. 1972;47:579–591. doi: 10.1016/0042-6822(72)90547-8. [DOI] [PubMed] [Google Scholar]
- 17.Landsberger F.R., Lenard J., Compans R.W. Spin-labeled electron spin resonance study of the lipid-containing membrane of influenza virus. Proc. Natl. Acad. Sci. USA. 1971;68:2579–2583. doi: 10.1073/pnas.68.10.2579. [DOI] [PMC free article] [PubMed] [Google Scholar]
- 18.Ipsen J.H., Mouritsen O.G. Modelling the phase equilibria in two-component membranes of phospholipids with different acyl-chain lengths. Biochim. Biophys. Acta. 1988;944:121–134. doi: 10.1016/0005-2736(88)90425-7. [DOI] [PubMed] [Google Scholar]
- 19.Sankaram M.B., Thompson T.E. Interaction of cholesterol with various glycerophospholipids and sphingomyelin. Biochemistry. 1990;29:10670–10675. doi: 10.1021/bi00499a014. [DOI] [PubMed] [Google Scholar]
- 20.Lingwood D., Simons K. Lipid rafts as a membrane-organizing principle. Science. 2010;327:46–50. doi: 10.1126/science.1174621. [DOI] [PubMed] [Google Scholar]
- 21.Simons K., Gerl M.J. Revitalizing membrane rafts: new tools and insights. Nat. Rev. Mol. Cell Biol. 2010;11:688–699. doi: 10.1038/nrm2977. [DOI] [PubMed] [Google Scholar]
- 22.Simons K., Ikonen E. Functional rafts in cell membranes. Nature. 1997;387:569–572. doi: 10.1038/42408. [DOI] [PubMed] [Google Scholar]
- 23.Veit M., Thaa B. Association of influenza virus proteins with membrane rafts. Adv Virolgy. 2011;2011:370606. doi: 10.1155/2011/370606. [DOI] [PMC free article] [PubMed] [Google Scholar]
- 24.Scheiffele P., Rietveld A., Simons K. Influenza viruses select ordered lipid domains during budding from the plasma membrane. J. Biol. Chem. 1999;274:2038–2044. doi: 10.1074/jbc.274.4.2038. [DOI] [PubMed] [Google Scholar]
- 25.Zhang J., Pekosz A., Lamb R.A. Influenza virus assembly and lipid raft microdomains: a role for the cytoplasmic tails of the spike glycoproteins. J. Virol. 2000;74:4634–4644. doi: 10.1128/jvi.74.10.4634-4644.2000. [DOI] [PMC free article] [PubMed] [Google Scholar]
- 26.Radyukhin V., Fedorova N., Baratova L. Cold co-extraction of hemagglutinin and matrix M1 protein from influenza virus A by a combination of non-ionic detergents allows for visualization of the raft-like nature of the virus envelope. Arch. Virol. 2008;153:1977–1980. doi: 10.1007/s00705-008-0214-7. [DOI] [PubMed] [Google Scholar]
- 27.Schroeder R., London E., Brown D. Interactions between saturated acyl chains confer detergent resistance on lipids and glycosylphosphatidylinositol (GPI)-anchored proteins: GPI-anchored proteins in liposomes and cells show similar behavior. Proc. Natl. Acad. Sci. USA. 1994;91:12130–12134. doi: 10.1073/pnas.91.25.12130. [DOI] [PMC free article] [PubMed] [Google Scholar]
- 28.Lichtenberg D., Goñi F.M., Heerklotz H. Detergent-resistant membranes should not be identified with membrane rafts. Trends Biochem. Sci. 2005;30:430–436. doi: 10.1016/j.tibs.2005.06.004. [DOI] [PubMed] [Google Scholar]
- 29.Schuck S., Honsho M., Simons K. Resistance of cell membranes to different detergents. Proc. Natl. Acad. Sci. USA. 2003;100:5795–5800. doi: 10.1073/pnas.0631579100. [DOI] [PMC free article] [PubMed] [Google Scholar]
- 30.Keller P., Simons K. Cholesterol is required for surface transport of influenza virus hemagglutinin. J. Cell Biol. 1998;140:1357–1367. doi: 10.1083/jcb.140.6.1357. [DOI] [PMC free article] [PubMed] [Google Scholar]
- 31.Tafesse F.G., Sanyal S., Ploegh H.L. Intact sphingomyelin biosynthetic pathway is essential for intracellular transport of influenza virus glycoproteins. Proc. Natl. Acad. Sci. USA. 2013;110:6406–6411. doi: 10.1073/pnas.1219909110. [DOI] [PMC free article] [PubMed] [Google Scholar]
- 32.Hidari K.I.P.J., Suzuki Y., Suzuki T. Suppression of the biosynthesis of cellular sphingolipids results in the inhibition of the maturation of influenza virus particles in MDCK cells. Biol. Pharm. Bull. 2006;29:1575–1579. doi: 10.1248/bpb.29.1575. [DOI] [PubMed] [Google Scholar]
- 33.Polozov I.V., Bezrukov L., Zimmerberg J. Progressive ordering with decreasing temperature of the phospholipids of influenza virus. Nat. Chem. Biol. 2008;4:248–255. doi: 10.1038/nchembio.77. [DOI] [PMC free article] [PubMed] [Google Scholar]
- 34.Nikolaus J., Scolari S., Herrmann A. Hemagglutinin of influenza virus partitions into the nonraft domain of model membranes. Biophys. J. 2010;99:489–498. doi: 10.1016/j.bpj.2010.04.027. [DOI] [PMC free article] [PubMed] [Google Scholar]
- 35.Hess S.T., Gould T.J., Zimmerberg J. Dynamic clustered distribution of hemagglutinin resolved at 40 nm in living cell membranes discriminates between raft theories. Proc. Natl. Acad. Sci. USA. 2007;104:17370–17375. doi: 10.1073/pnas.0708066104. [DOI] [PMC free article] [PubMed] [Google Scholar]
- 36.Scolari S., Engel S., Herrmann A. Lateral distribution of the transmembrane domain of influenza virus hemagglutinin revealed by time-resolved fluorescence imaging. J. Biol. Chem. 2009;284:15708–15716. doi: 10.1074/jbc.M900437200. [DOI] [PMC free article] [PubMed] [Google Scholar]
- 37.Engel S., Scolari S., Veit M. FLIM-FRET and FRAP reveal association of influenza virus hemagglutinin with membrane rafts. Biochem. J. 2010;425:567–573. doi: 10.1042/BJ20091388. [DOI] [PubMed] [Google Scholar]
- 38.Tanner L.B., Chng C., Wenk M.R. Lipidomics identifies a requirement for peroxisomal function during influenza virus replication. J. Lipid Res. 2014;55:1357–1365. doi: 10.1194/jlr.M049148. [DOI] [PMC free article] [PubMed] [Google Scholar]
- 39.Gerl M.J., Sampaio J.L., Simons K. Quantitative analysis of the lipidomes of the influenza virus envelope and MDCK cell apical membrane. J. Cell Biol. 2012;196:213–221. doi: 10.1083/jcb.201108175. [DOI] [PMC free article] [PubMed] [Google Scholar]
- 40.Frisz J.F., Lou K., Kraft M.L. Direct chemical evidence for sphingolipid domains in the plasma membranes of fibroblasts. Proc. Natl. Acad. Sci. USA. 2013;110:E613–E622. doi: 10.1073/pnas.1216585110. [DOI] [PMC free article] [PubMed] [Google Scholar]
- 41.Zhao J., Wu J., Feigenson G. Phase studies of model biomembranes: macroscopic coexistence of Lalpha+Lbeta, with light-induced coexistence of Lalpha+Lo Phases. Biochim. Biophys. Acta. 2007;1768:2777–2786. doi: 10.1016/j.bbamem.2007.07.009. [DOI] [PMC free article] [PubMed] [Google Scholar]
- 42.Shaw J.E., Epand R.F., Yip C.M. Correlated fluorescence-atomic force microscopy of membrane domains: structure of fluorescence probes determines lipid localization. Biophys. J. 2006;90:2170–2178. doi: 10.1529/biophysj.105.073510. [DOI] [PMC free article] [PubMed] [Google Scholar]
- 43.Devaux P.F., Fellmann P., Hervé P. Investigation on lipid asymmetry using lipid probes: comparison between spin-labeled lipids and fluorescent lipids. Chem. Phys. Lipids. 2002;116:115–134. doi: 10.1016/s0009-3084(02)00023-3. [DOI] [PubMed] [Google Scholar]
- 44.Maier O., Oberle V., Hoekstra D. Fluorescent lipid probes: some properties and applications (a review) Chem. Phys. Lipids. 2002;116:3–18. doi: 10.1016/s0009-3084(02)00017-8. [DOI] [PubMed] [Google Scholar]
- 45.Klitzing H.A., Weber P.K., Kraft M.L. Secondary ion mass spectrometry imaging of biological membranes at high spatial resolution. In: Sousa A.A., Kruhlak M.J., editors. Methods in Molecular Biology: Nanoimaging Methods and Protocols. Humana Press; Totowa, NJ: 2013. pp. 483–501. [DOI] [PubMed] [Google Scholar]
- 46.Frisz J.F., Klitzing H.A., Kraft M.L. Sphingolipid domains in the plasma membranes of fibroblasts are not enriched with cholesterol. J. Biol. Chem. 2013;288:16855–16861. doi: 10.1074/jbc.M113.473207. [DOI] [PMC free article] [PubMed] [Google Scholar]
- 47.Carner P., Park J.M., Malecki E. A stereodivergent synthesis of D-erythro-sphingosine and D-threo-sphingosine from L-serine. J. Org. Chem. 1998;53:4395–4398. [Google Scholar]
- 48.Dondoni A., Perrone D. Synthesis of 1,1-dimethylethyl (S)-4-formyl-2,2-dimethyl-3-oxazolidinecarboxylate by oxidation of the alcohol. Org. Synth. 2000;77:64–77. [Google Scholar]
- 49.McKennis H., Jr. The formation of cholesterol i-cholesteryl methyl ether. J. Biol. Chem. 1948;172:313–316. [PubMed] [Google Scholar]
- 50.Wilson R.L., Frisz J.F., Kraft M.L. Fluorinated colloidal gold immunolabels for imaging select proteins in parallel with lipids using high-resolution secondary ion mass spectrometry. Bioconjug. Chem. 2012;23:450–460. doi: 10.1021/bc200482z. [DOI] [PMC free article] [PubMed] [Google Scholar]
- 51.Bligh E.G., Dyer W.J. A rapid method of total lipid extraction and purification. Can. J. Biochem. Physiol. 1959;37:911–917. doi: 10.1139/o59-099. [DOI] [PubMed] [Google Scholar]
- 52.Altelaar A.F.M., Klinkert I., Piersma S.R. Gold-enhanced biomolecular surface imaging of cells and tissue by SIMS and MALDI mass spectrometry. Anal. Chem. 2006;78:734–742. doi: 10.1021/ac0513111. [DOI] [PubMed] [Google Scholar]
- 53.McMahon G., Glassner B.J., Lechene C.P. Quantitative imaging of cells with multi-isotope imaging mass spectrometry (MIMS)–Nanoautography with stable isotope tracers. Appl. Surf. Sci. 2006;252:6895–6906. [Google Scholar]
- 54.Lechene C.P., Luyten Y., Distel D.L. Quantitative imaging of nitrogen fixation by individual bacteria within animal cells. Science. 2007;317:1563–1566. doi: 10.1126/science.1145557. [DOI] [PubMed] [Google Scholar]
- 55.Nittler L.R. Dissertation. Department of Physics, Washington University; Saint Louis, MO: 1996. Quantitative isotopic ratio ion imaging and its application to studies of preserved stardust in meteorites. [Google Scholar]
- 56.Kvam P.H., Vidakovic B. Nanparametric Statistics with Applications to Science and Engineering. John Wiley & Sons; Hoboken, NJ: 2007. Goodness of fit; pp. 81–114. [Google Scholar]
- 57.Massey F.J. The Kolmogorov-Smirnov test for goodness of fit. J. Am. Stat. Assoc. 1951;46:68–78. [Google Scholar]
- 58.Lizunov V., Chlanda P., Zimmerberg J. Long, saturated chains: tasty domains for kinases of insulin resistance. Dev. Cell. 2011;21:604–606. doi: 10.1016/j.devcel.2011.10.001. [DOI] [PMC free article] [PubMed] [Google Scholar]
- 59.Leser G.P., Lamb R.A. Influenza virus assembly and budding in raft-derived microdomains: a quantitative analysis of the surface distribution of HA, NA and M2 proteins. Virology. 2005;342:215–227. doi: 10.1016/j.virol.2005.09.049. [DOI] [PubMed] [Google Scholar]
- 60.Rossman J.S., Lamb R.A. Influenza virus assembly and budding. Virology. 2011;411:229–236. doi: 10.1016/j.virol.2010.12.003. [DOI] [PMC free article] [PubMed] [Google Scholar]
- 61.Nakano T., Inoue I., Komoda T. A possible role of lysophospholipids produced by calcium-independent phospholipase A(2) in membrane-raft budding and fission. Biochim. Biophys. Acta. 2009;1788:2222–2228. doi: 10.1016/j.bbamem.2009.07.015. [DOI] [PubMed] [Google Scholar]
- 62.Gudheti M.V., Curthoys N.M., Hess S.T. Actin mediates the nanoscale membrane organization of the clustered membrane protein influenza hemagglutinin. Biophys. J. 2013;104:2182–2192. doi: 10.1016/j.bpj.2013.03.054. [DOI] [PMC free article] [PubMed] [Google Scholar]
- 63.Zeidan Y.H., Jenkins R.W., Hannun Y.A. Remodeling of cellular cytoskeleton by the acid sphingomyelinase/ceramide pathway. J. Cell Biol. 2008;181:335–350. doi: 10.1083/jcb.200705060. [DOI] [PMC free article] [PubMed] [Google Scholar]
- 64.Canals D., Jenkins R.W., Hannun Y.A. Differential effects of ceramide and sphingosine 1-phosphate on ERM phosphorylation: probing sphingolipid signaling at the outer plasma membrane. J. Biol. Chem. 2010;285:32476–32485. doi: 10.1074/jbc.M110.141028. [DOI] [PMC free article] [PubMed] [Google Scholar]
- 65.Canals D., Roddy P., Hannun Y.A. Protein phosphatase 1α mediates ceramide-induced ERM protein dephosphorylation: a novel mechanism independent of phosphatidylinositol 4, 5-biphosphate (PIP2) and myosin/ERM phosphatase. J. Biol. Chem. 2012;287:10145–10155. doi: 10.1074/jbc.M111.306456. [DOI] [PMC free article] [PubMed] [Google Scholar]
- 66.Kwik J., Boyle S., Edidin M. Membrane cholesterol, lateral mobility, and the phosphatidylinositol 4,5-bisphosphate-dependent organization of cell actin. Proc. Natl. Acad. Sci. USA. 2003;100:13964–13969. doi: 10.1073/pnas.2336102100. [DOI] [PMC free article] [PubMed] [Google Scholar]
- 67.Sun M., Northup N., Forgacs G. The effect of cellular cholesterol on membrane-cytoskeleton adhesion. J. Cell Sci. 2007;120:2223–2231. doi: 10.1242/jcs.001370. [DOI] [PubMed] [Google Scholar]
- 68.Qi M., Liu Y., Solomon K.R. Cholesterol-regulated stress fiber formation. J. Cell. Biochem. 2009;106:1031–1040. doi: 10.1002/jcb.22081. [DOI] [PubMed] [Google Scholar]