

Abstract
Cell migration refers to a directional cell movement in response to chemoattractant stimulation. In this work, we developed a cell-migration model by mimicking in vivo migration using optically manipulated chemoattractant-loaded microsources. The model facilitates a quantitative characterization of the relationship among the protrusion force, cell motility, and chemoattractant gradient for the first time (to our knowledge). We verified the correctness of the model using migrating leukemia cancer Jurkat cells. The results show that one can achieve the ideal migrating capacity by choosing the appropriate chemoattractant gradient and concentration at the leading edge of the cell.
Introduction
Cell movement, which is closely related to the development and maintenance of multicellular organisms, has attracted much attention (1). Cell migration is a directional cell movement in response to chemoattractant stimulation. Numerous studies have investigated cell migration, especially for the identification of influential molecules (2–5). However, information about the mechanisms of chemoattractant gradient induction of cell migration has remained limited, inhibiting further advances in cell mobility research.
The gradient of chemoattractant molecules activates the inner filament network and causes a cell chemotactic response (6–9). To date, the relationship between the chemoattractant gradient and cell motility has yet to be determined quantitatively. It has been known that a cell experiences several forces during migration, including the protrusion force, which overcomes hindrances caused by friction and viscosity, and drives the cell to move toward the stimulus. Other forces experienced by the cell are caused by adhesion of the leading edge, de-adhesion at the cell body and rear, and cytoskeletal contraction (10). The precise estimation of the cell protrusion force has remained a challenging problem (11–14). We recently proposed the use of robotically controlled optical tweezers to trap chemoattractant-loaded biocompatible poly(lactic-co-glycolic acid) (PLGA) microparticles, which release chemoattractant molecules into a liquid environment and induce cell polarization and migration (15). The establishment of a cell manipulation tool that can artificially generate a gradient field under in vitro conditions could facilitate in-depth studies of in vivo cell migration.
Here, we describe a dynamic model of migrating cells in an in vitro chemoattractant environment that mimics the in vivo condition to induce cell polarization and migration. The model aims to illustrate the relationship between the chemoattractant gradient and cell forces, as well as to reveal the cell motility capacity.
Materials and Methods
Experimental setup
An optical-tweezers manipulation system established at the City University of Hong Kong was used to manipulate cell migration, as shown in Fig. 1 a. This system provides an intuitive user interface and allows dexterous control of optical traps. An incubator is mounted on the motorized stage to keep the cells in an atmosphere of 5% CO2 at 37°C.
Figure 1.
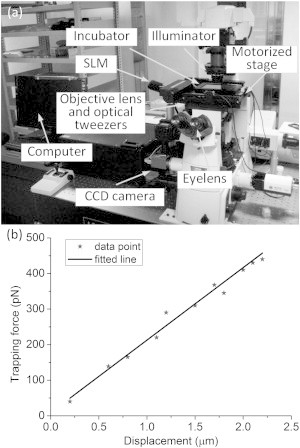
(a) Optical-tweezers manipulation system established at the City University of Hong Kong. (b) Trapping force versus displacement from the trap center.
We performed a series of experiments on trapping a PLGA bead to calibrate the optical trapping stiffness (k). Numerous methods have been proposed to calibrate the trapping stiffness (16,17). In the current work, a polystyrene bead was initially trapped in a suspending RPMI medium, and the center of the bead was coincident with the focus center. A stable drag force applied on the bead was generated when the cell was moved at a given speed. At a position with balance, the trapping force (Ftrap) was equal to the drag force (Fdrag). Fig. 1 b illustrates the relationship between the trapping force and the displacement of the bead with respect to the focus of the optical trap, showing that the trapping force increases linearly as the displacement increases within the critical value. According to previous work (18), when the displacement is beyond the critical value (i.e., x0 = 2.3 μm in the study), the trapping force decreases and becomes zero after the bead is outside the optical trap. Based on a recent report (19), the trapping stiffness is a function of the laser power (P), expressed as k = (0.52 ± 0.02)P. In experiments in which three traps were used, the power assigned to each trap in use was ∼400 mW. The trapping stiffness of each trap was calibrated as 209.64 ± 39.52 pN/μm (19). Images of the manipulation process were acquired by a CCD camera under 60× magnification, with a resolution of 0.1075 μm/pixel. As a result, the accuracy of the measurement could reach ∼22 pN/pixel. The maximum trapping force was measured to be ∼500 pN. It was assumed that the laser power used in the experiments was large enough to bring the cell to a halt within the critical value.
Cell culture and reagents
Leukemia cancer Jurkat cells were selected as the samples for cell-migration tests. Jurkat cells, an immortalized line of T lymphocyte cells, are suitable for studies of cell motility because of their relatively fast motion. The Jurkat cells were cultured for growth in an RPMI 1640 medium with 10% (v/v) fetal bovine serum (FBS; Invitrogen, Carlsbad, CA) and incubated under 5% CO2 at 37°C in a humidified atmosphere. A 35-mm, thin-bottomed Petri dish (μ-dish; Ibidi, Martinsried, Germany) was used to culture the Jurkat cells. The culture dish was first coated with fibronectin (100 μg/ml; Invitrogen) at 4°C and left overnight before the experiments. After the fibronectin was aspirated the next day, the dish was rinsed with PBS and filled with RPMI 1640 medium supplemented with 10% (v/v) FBS. Cells were seeded on the fibronectin layer and incubated for 2–3 h to allow attachment.
Chemoattractant-induced cell migration
The chemoattractant concentration gradient was generated by PLGA beads manipulated by optical tweezers. The PLGA beads were fabricated using a solvent evaporation-spontaneous emulsion technique (9) and loaded with SDF-1α chemoattractant, which can stimulate the migration of leukemia cancer Jurkat cells. The radii of the beads ranged from 1 μm to 3 μm. The beads were trapped using optical tweezers and placed within 3–5 μm of the cell. Soluble chemoattractant molecules were released into the liquid with a relatively slow diffusion coefficient (∼1.7 × 10⁻¹³ m2/s). Within a time period ranging from 100 s to 200 s, the PLGA beads created a concentration spherical field with a radius of ∼4–8 μm. Fig. 2 illustrates the simulated gradient field generated by two microsources, which was obtained by using the finite element analysis software COMSOL.
Figure 2.
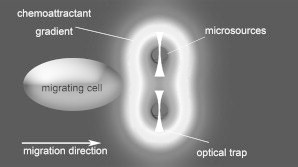
Simulated gradient generation with two microsources.
Model development
Once the cell detects the chemoattractant gradient, a force that drives the cell to move toward the chemoattractant-loaded microsource is generated. This force is defined as the protrusion force Fp in this study. Moreover, the cell is subjected to the resistance forces of viscosity (generated by the liquid environment; Fviscous) and friction (found between the cell and substrate; Ffriction) during migration, as shown in Fig. 3 a. Fp, Fviscous, and Ffriction contribute to the cell movement, as described by the following dynamic equation:
| (1) |
where mc and x denote the mass and position of the centroid of cell, respectively; is generally neglected in an environment with a low Reynolds number (20). According to Svoboda and Block (22), , where λ is the drag coefficient. The friction force Ffriction can be determined by using the adapted Zhurkov model (23), and d is defined as the area density of the ligand adhesion in effective proportion A. Subsequently, Ffriction can be expressed as , where the area density d is ∼200–300 μm−2, the ligand mobility μ ranges from 104 m/Ns to 105 m/Ns (23), and A can be experimentally determined. Fc is a term generated by the complex actin polymerization and molecular motors (10). To measure the effect of Fc, a polystyrene bead (with a radius of 1–2 μm), which functions as a force sensor and is trapped by an optical tweezers, is placed between the cell and the microsource bead, as shown in Fig. 3 b. When the cell moves toward the microsource, the cell pushes this sensor bead away from the focus point of the trap, resulting in an optical trapping force that is applied to the bead. At this moment, the moving speed of the cell also decreases rapidly. The trapping force applied to the bead can be estimated using Ftrap = kxb when the bead is within the critical displacement, where xb is the offset of the bead (24). Using this method, one can indirectly examine Fc by calculating the trapping force Ftrap, using Fc = Ftrap = kxb. Note that Fc is measured in the static equilibrium state, when the cell stops moving. Recent work (19) indicated that cells are sensitive to an external barrier, implying that the cell velocity decreases rapidly when a barrier exists in front of the cell. This is in accord with the elastic Brownian ratchet model (21).
Figure 3.
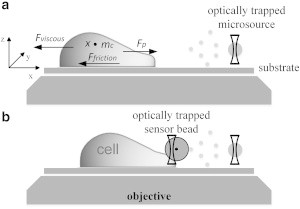
Schematic of the model for probing cell migration. (a) A cell stimulated by a chemoattractant-loaded PLGA microsource. (b) Use of an optically trapped bead for force sensing.
The substitution of Fviscous, Ffriction, and Fc into Eq. 1 yields the relationship between the protrusion force and the velocity of the migrating cell, which can be expressed as
| (2) |
The relationship between the cell velocity and gradient is then analyzed. Existing approaches reported in the literature have explained how a cell detects the gradient. For instance, a cell uses receptors and G-protein-linked signaling pathways to detect the gradient (25). By measuring the chemoattractant concentration around the cell, the cell can identify the highest concentration gradient, and thus it can determine the orientation of the stimulus (26). In this study, we created a chemoattractant gradient by placing optically trapped microsources near the cell, which is standardized as g = ∇C/g0, where C denotes the chemoattractant concentration, g0 = 1 mol/m4. The concentration of the chemoattractant molecules at the surface of the spherical microsource can be expressed as C0 = l0ρba2/3MwtrD (27), where l0 < 1 is the loading ratio (mass of molecules loaded into the particle divided by the mass of the particle), ρb is the mass density of the particle material, a is the radius of the particle, Mw is the molecular weight of the molecule, tr is the release time measured when the bead is placed into the solution, and D is the diffusion coefficient of the molecule (27).
According to the elastic Brownian ratchet model (21), the protrusion force is generated by the filament network and the cell-migration velocity can be expressed as
| (3) |
where l is the average length increment of the actin filament in the direction of growth after one act of assembly, fa is the attachment force per filament, a is the number of attached filaments, w is the number of working filaments, kBT is the thermal energy, Vmax is the free polymerization rate, and Vdep is the free depolymerization rate. Notably, a = n/δ and w = n/κ, where n, δ, and κ denote the nucleation, dissociation, and capping rates, respectively.
The chemoattractant stimulation changes the number of filaments. The working filaments contribute to the cell movement, which is not the case with the attached filaments. The dissociation rate δ represents the rate of conversion of the attached filaments into working filaments. Thus, a high δ-value promotes cell migration. In contrast, the capping rate κ inhibits the growth of the working filaments, and hence hinders cell motility. Considering that the attached filaments can be converted into working filaments, a high nucleation rate n-value, which contributes to the growth of the attached filaments (21), can also promote cell motility. Therefore, when the cell is stimulated by a chemoattractant, the dissociation and nucleation rates of the filaments are likely to increase, whereas the capping rate will tend to decrease.
Based on the above analysis and the cellular excitation response reported by Parent and Devreotes (25), δ, κ, and n can be formulated as δ = λ1tanh g, κ = λ2/(g + 1), and n = λ3tanh g, where λ1 denotes the maximum dissociation rate, λ2 denotes the capping rate when g = 0, and λ3 denotes the maximum nucleation rate. As a result, the number of attached and working filaments can be calculated as a = n/δ = λ3/λ1 and , which clearly indicates that the gradient promotes the growth of working filaments, but not that of attached filaments. Consequently, Eq. 3 can be modified as
| (4) |
Eq. 4 explicitly reveals the relationship between the cell movement velocity and gradient.
By substituting Eq. 4 into Eq. 2, the relationship between the protrusion force Fp and the gradient g can be derived as
| (5) |
where φ = (λ + dAμ−1)Vmax, with a unit of pN, denotes the maximum force generated by the cell; denotes the gradient effect coefficient and is dimensionless; and ρ = (λ + dAμ−1)Vdep − kxb, with a unit of pN, denotes the hinder force generated by the cell.
Fig. 4 illustrates the model predication results qualitatively. As the gradient increases, the number of attached filaments (a) remains constant, whereas the number of working filaments (w) increases. The cell velocity and the protrusion force rapidly increase when the gradient initially changes, indicating that the cell is sensitive to external stimulation. Both the cell velocity and protrusion force gradually stabilize. This result agrees well with the well-known fact that the cell’s receptors, proteins, and filaments are saturable. Note that although the modeling parameters vary for different types of cells, the cellular response tendencies of different cells should be similar.
Figure 4.
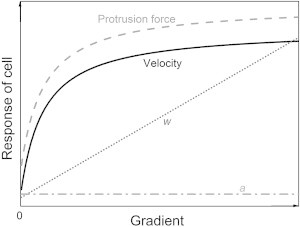
Model prediction results for filament numbers, cell velocity, and cell protrusion force as the gradient increases.
Results and Discussion
We experimentally verified the correctness of the models described by Eqs. 2, 4, and 5 using migrating leukemia cancer Jurkat cells stimulated by optically manipulated SDF-1α-loaded PLGA beads. The diffusion coefficient of SDF-1α was ∼1.7 × 10⁻¹³ m2/s (28). According to Merks et al. (28), the molecular weight of SDF-1α is Mw = 8008. Thus, the estimated concentration at the surface of the microsource was calculated as C0 = 2.5 μM. A three-dimensional numerical model based on the proposed experimental setup was established with the finite element analysis software COMSOL to calculate the concentration gradient, as shown in Fig. 5, a and b. Fig. 5, c and d, show the concentration and gradient distribution along the medial axis of the microsource beads. Fig. 5, e and f, show the concentration and gradient distribution at the cell surface. The distance between the cell and the microsource bead was set as 3.5 μm. When the cell faced the two beads directly with 0°, as shown in Fig. 5 f, the concentration and gradient were maximal.
Figure 5.
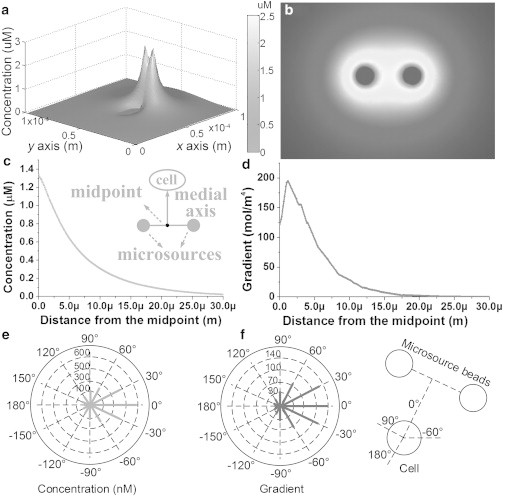
Simulation results for chemoattractant concentration. (a) Sketch showing the concentration gradient generated by two microsources, where height and color represent the concentration. (b) Concentration distribution. (c and d) Numerical concentration and gradient distribution along the medial axis of two microsources. (e and f) Concentration and gradient distribution at the cell surface, with different angles with respect to the medial axis of two microsource beads. The magnitudes are represented by the length of the solid line.
Fig. 6 shows the typical experimental process and demonstrates that the barrier bead (as the force sensor) was pushed away from the focus of the optical trap when the cell moved toward the stimulus induced by the chemoattractant gradient. It was previously reported (29) that the trapping process does not prominently compromise a cell’s viability even with direct trapping.
Figure 6.
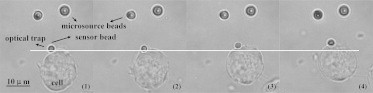
Experimental process in chronological sequence for measurements of protrusion force.
One set of the test results in chronological order of Fp, Ffriction, and Fc based on Eq. 2 is shown in Fig. 7 a. The protrusion force Fp reached as high as >1000 pN, and Ffriction followed Fp closely. Fc was measured as 150 pN when the cell was nearly stationary at the time point of 130 s. The viscous force of the cell, which is too small to be shown in Fig. 7 a, is only 10−3 pN, and was calculated using λ = 0.7pN·s/μm. Fig. 7 b shows the relationship between Fp and velocity , where was measured based on image processing. Compared with Fc, Ffriction has a more significant influence in Eq. 2, which explains the approximately linear relationship between Fp and in Fig. 7 b. Fig. 7 c shows the distance between the cell leading edge and the microsource beads. Fig. 7 d shows that the cell migrated along the gradient direction.
Figure 7.
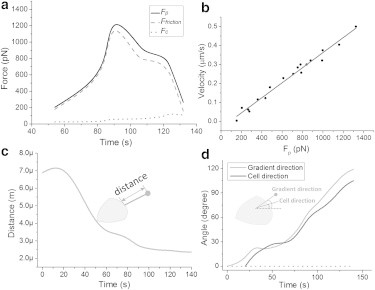
Sample of experimental results in chronological order. (a) Variation of the main forces experienced by the cell during migration. (b) Relationship between the protrusion force and the velocity of the cell. (c) The change in distance between the cell leading edge and microsources during migration. (d) Directions of the cell migration and gradient.
Experimental results based on 10 cell samples are provided in Table 1. It can be seen that Fc ranged from 100 pN to 300 pN, and the average protrusion force Fp was ∼1000 pN. The protrusion force was large enough to overcome both the friction and viscous forces in driving the cell to move forward.
Table 1.
Force measurement data for Jurkat cells
| Cell number | Avg. Fc (pN) | Avg. Fp (pN) | Avg. Ffriction (pN) | Avg. Fviscous (pN) |
|---|---|---|---|---|
| 1 | 124.1 | 1000.4 | 938.4 | 0.0025 |
| 2 | 297.6 | 1124.0 | 808.4 | 0.0031 |
| 3 | 73.3 | 1254.9 | 1191.6 | 0.0042 |
| 4 | 36.7 | 896.7 | 865.2 | 0.0045 |
| 5 | 147.7 | 846.8 | 681.5 | 0.0016 |
| 6 | 135.8 | 965.7 | 825.6 | 0.0033 |
| 7 | 108.9 | 1043.6 | 930.8 | 0.0036 |
| 8 | 257.1 | 1095.4 | 749.8 | 0.0020 |
| 9 | 315.1 | 1068.2 | 717.3 | 0.0022 |
| 10 | 313.5 | 1306.5 | 984.2 | 0.0033 |
Fig. 8 illustrates Fp and with respect to the concentration gradient g. The measurement was repeated 10 times. Both Fp and rapidly increased when the gradient initially increased, and subsequently they both stabilized when the gradient reached 150 mol/m4. The solid lines are the fitted results of the protrusion force and velocity based on the actual test results, and can be mathematically modeled as
| (6) |
| (7) |
After fitting Eq. 6 into Eq. 5, and Eq. 7 into Eq. 4, we can extract the modeling parameters in Eqs. 4 and 5, as shown in Table 2. Based on these parameters, λ1, λ2, and λ3 can also be identified as 0.4/s, 0.8/s, and 8/s, respectively, which are close to the predicted values of δ (0.5/s), κ (0.5/s), and n (10/s) reported by Mogilner and Oster (21).
Figure 8.
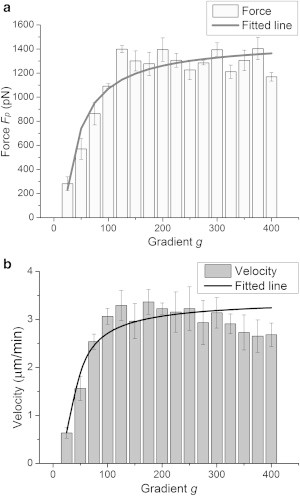
Experimental analysis of cell motility. (a) Protrusion force Fp and the fitted line of Fp with respect to gradient g. (b) Cell velocity and the fitted line of with respect to gradient g.
Table 2.
Identified Parameters
| Equations | Parameters |
||||||
|---|---|---|---|---|---|---|---|
| φ (pN) | ξ | ρ (pN) | Vmax (μm/min) | Vdep (μm/min) | R2 | Adj. R2 | |
| Eq. 5 | NA | 16 ± 3 | NA | 6.4 ± 1.2 | 2.8 ± 0.5 | 0.801 | 0.762 |
| Eq. 6 | 2576 ± 165 | 16 ± 3 | 1106 ± 92 | NA | NA | 0.867 | 0.847 |
The experimental results in Fig. 8 clearly demonstrate that both the protrusion force and the cell velocity increase as the gradient increases, with the same tendency as the model-predicted results shown in Fig. 4; thus, the correctness of the proposed model is verified. Moreover, the model as given in Eqs. 4 and 5 elucidates for the first time (to our knowledge) the quantitative relationship between cell motility and gradient.
Cell motility was also remarkably affected by the concentration at the leading edge of the cell, which is denoted by Cfront. Fig. 9 shows the experimental results regarding the relationship between Fp and the concentration at the leading edge of the cell. The cell exhibited the highest migration ability when the concentration was ∼30 nM, indicating that cell motility does not necessarily increase with an increase in concentration. This phenomenon can be attributed to the saturability and limited number of the chemoattractant receptors. This finding shows that the migration ability of each cell was maximal at concentrations near the dissociation constant (Kd), because according to Pelletier et al. (30), the Kd of SDF-1α is between 20 nM and 40 nM, and the concentration value of 30 nM, at which the cell exhibited the highest motility, falls in this range. This finding leads to the hypothesis that both the concentration Cfront and the gradient g considerably affect cell motility.
Figure 9.
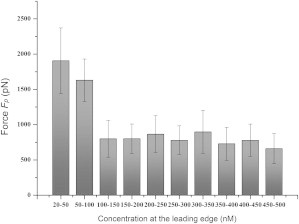
Tendency of Fp to vary with a change in Cfront.
Conclusions
We have described the development of a cell-migration model that can characterize the relationship among the protrusion force, chemoattractant gradient, and cell motility. This model has, to our knowledge, three novel aspects. First, the model quantitatively characterizes the relationship between the protrusion force and cell migration velocity. This characterization is achieved by mimicking in vivo migration using optically manipulated, chemoattractant-loaded microsources. Second, by extending the elastic Brownian ratchet approach, the proposed theoretical model explicitly reveals the relationship between the cell migration velocity and gradient. Third, the model characterizes how the cell motility is affected by g and Cfront near the leading edge. We verified the accuracy of the model using migrating leukemia cancer Jurkat cells.
Author Contributions
D.S. developed the concept and worked with J.L., A.Y.-H.L., T.M.F., and Y.W. to conceive the project. H.Y., X.G., and D.S. proposed the theoretical model for cell migration. H.Y. and X.G. conducted all of the experiments and obtained the data. T.M.F. provided the SDF-1α-loaded microsource bead, and A.Y.-H.L. provided human leukemia cancer Jurkat cells. D.S., H.Y., X.G., J.L., and Y.W. analyzed the data and discussed the results. H.Y., D.S., X.G., and J.L. wrote the manuscript.
Acknowledgments
This work was supported by the Research Grants Council of the Hong Kong Special Administrative Region, China (CityU9/CRF/13G and CityU11211714).
Footnotes
Hao Yang and Xue Gou contributed equally to this work.
References
- 1.Prass M., Jacobson K., Radmacher M. Direct measurement of the lamellipodial protrusive force in a migrating cell. J. Cell Biol. 2006;174:767–772. doi: 10.1083/jcb.200601159. [DOI] [PMC free article] [PubMed] [Google Scholar]
- 2.Roussos E.T., Condeelis J.S., Patsialou A. Chemotaxis in cancer. Nat. Rev. Cancer. 2011;11:573–587. doi: 10.1038/nrc3078. [DOI] [PMC free article] [PubMed] [Google Scholar]
- 3.Lander A.D. Morpheus unbound: reimagining the morphogen gradient. Cell. 2007;128:245–256. doi: 10.1016/j.cell.2007.01.004. [DOI] [PubMed] [Google Scholar]
- 4.Liang S., Slattery M.J., Dong C. Shear stress and shear rate differentially affect the multi-step process of leukocyte-facilitated melanoma adhesion. Exp. Cell Res. 2005;310:282–292. doi: 10.1016/j.yexcr.2005.07.028. [DOI] [PMC free article] [PubMed] [Google Scholar]
- 5.Vicente-Manzanares M., Horwitz A.R. Adhesion dynamics at a glance. J. Cell Sci. 2011;124:3923–3927. doi: 10.1242/jcs.095653. [DOI] [PMC free article] [PubMed] [Google Scholar]
- 6.Gurdon J.B., Bourillot P.Y. Morphogen gradient interpretation. Nature. 2001;413:797–803. doi: 10.1038/35101500. [DOI] [PubMed] [Google Scholar]
- 7.Hong Y., Blackman N.M., Velegol D. Chemotaxis of nonbiological colloidal rods. Phys. Rev. Lett. 2007;99:178103. doi: 10.1103/PhysRevLett.99.178103. [DOI] [PubMed] [Google Scholar]
- 8.Amselem G., Theves M., Bodenschatz E. Control parameter description of eukaryotic chemotaxis. Phys. Rev. Lett. 2012;109:108103. doi: 10.1103/PhysRevLett.109.108103. [DOI] [PubMed] [Google Scholar]
- 9.Fahmy T.M., Samstein R.M., Mark Saltzman W. Surface modification of biodegradable polyesters with fatty acid conjugates for improved drug targeting. Biomaterials. 2005;26:5727–5736. doi: 10.1016/j.biomaterials.2005.02.025. [DOI] [PubMed] [Google Scholar]
- 10.Ananthakrishnan R., Ehrlicher A. The forces behind cell movement. Int. J. Biol. Sci. 2007;3:303–317. doi: 10.7150/ijbs.3.303. [DOI] [PMC free article] [PubMed] [Google Scholar]
- 11.Condeelis J. Life at the leading edge: the formation of cell protrusions. Annu. Rev. Cell Biol. 1993;9:411–444. doi: 10.1146/annurev.cb.09.110193.002211. [DOI] [PubMed] [Google Scholar]
- 12.Prechtel K., Bausch A.R., Merkel R. Dynamic force spectroscopy to probe adhesion strength of living cells. Phys. Rev. Lett. 2002;89:028101. doi: 10.1103/PhysRevLett.89.028101. [DOI] [PubMed] [Google Scholar]
- 13.Tan Y., Fung T.K., Sun D. Biophysical characterization of hematopoietic cells from normal and leukemic sources with distinct primitiveness. Appl. Phys. Lett. 2011;99:083702. [Google Scholar]
- 14.Wang K., Cheng J., Sun D. Probing cell biophysical behavior based on actin cytoskeleton modeling and optical tweezers stretching manipulation. Appl. Phys. Lett. 2013;103:083706. [Google Scholar]
- 15.Gou X., Yang H., Sun D. Dynamics analysis and automated control of cell chemotaxis movement using a robot-aided optical manipulation tool. IEEE Int. Conf. Robotics Automation. 2013:1706–1711. [Google Scholar]
- 16.Wu Y., Sun D., Xi N. Dynamics analysis and motion planning for automated cell transportation with optical tweezers. IEEE/ASME Trans. Mechatron. 2013;18:706–713. [Google Scholar]
- 17.Svoboda K., Block S.M. Force and velocity measured for single kinesin molecules. Cell. 1994;77:773–784. doi: 10.1016/0092-8674(94)90060-4. [DOI] [PubMed] [Google Scholar]
- 18.Hu S., Sun D. Automatic transportation of biological cells with a robot-tweezer manipulation system. Int. J. Robot. Res. 2011;30:1681–1694. [Google Scholar]
- 19.Gou X., Yang H., Sun D. Direct measurement of cell protrusion force utilizing a robot-aided cell manipulation system with optical tweezers for cell migration control. Int. J. Robot. Res. 2014;33:1782–1792. [Google Scholar]
- 20.Gauthier R.C., Wallace S. Optical levitation of spheres: analytical development and numerical computations of the force equations. J. Opt. Soc. Am. B. 1995;12:1680–1685. [Google Scholar]
- 21.Mogilner A., Oster G. Force generation by actin polymerization II: the elastic ratchet and tethered filaments. Biophys. J. 2003;84:1591–1605. doi: 10.1016/S0006-3495(03)74969-8. [DOI] [PMC free article] [PubMed] [Google Scholar]
- 22.Svoboda K., Block S.M. Biological applications of optical forces. Annu. Rev. Biophys. Biomol. Struct. 1994;23:247–285. doi: 10.1146/annurev.bb.23.060194.001335. [DOI] [PubMed] [Google Scholar]
- 23.Pompe T., Kaufmann M., Werner C. Friction-controlled traction force in cell adhesion. Biophys. J. 2011;101:1863–1870. doi: 10.1016/j.bpj.2011.08.027. [DOI] [PMC free article] [PubMed] [Google Scholar]
- 24.Wu Y., Sun D., Huang W. Mechanical force characterization in manipulating live cells with optical tweezers. J. Biomech. 2011;44:741–746. doi: 10.1016/j.jbiomech.2010.10.034. [DOI] [PubMed] [Google Scholar]
- 25.Parent C.A., Devreotes P.N. A cell’s sense of direction. Science. 1999;284:765–770. doi: 10.1126/science.284.5415.765. [DOI] [PubMed] [Google Scholar]
- 26.Alex L.A., Simon M.I. Protein histidine kinases and signal transduction in prokaryotes and eukaryotes. Trends Genet. 1994;10:133–138. doi: 10.1016/0168-9525(94)90215-1. [DOI] [PubMed] [Google Scholar]
- 27.Kress H., Park J.G., Dufresne E.R. Cell stimulation with optically manipulated microsources. Nat. Methods. 2009;6:905–909. doi: 10.1038/nmeth.1400. [DOI] [PMC free article] [PubMed] [Google Scholar]
- 28.Merks R.M., Perryn E.D., Glazier J.A. Contact-inhibited chemotaxis in de novo and sprouting blood-vessel growth. PLOS Comput. Biol. 2008;4:e1000163. doi: 10.1371/journal.pcbi.1000163. [DOI] [PMC free article] [PubMed] [Google Scholar]
- 29.Hu S., Gou X., Sun D. Manipulating cell adhesions with optical tweezers for study of cell-to-cell interactions. J. Biomed. Nanotechnol. 2013;9:281–285. doi: 10.1166/jbn.2013.1528. [DOI] [PubMed] [Google Scholar]
- 30.Pelletier A.J., van der Laan L.J., Salomon D.R. Presentation of chemokine SDF-1 α by fibronectin mediates directed migration of T cells. Blood. 2000;96:2682–2690. [PubMed] [Google Scholar]