. 2015 Mar 6;4:e05413. doi: 10.7554/eLife.05413

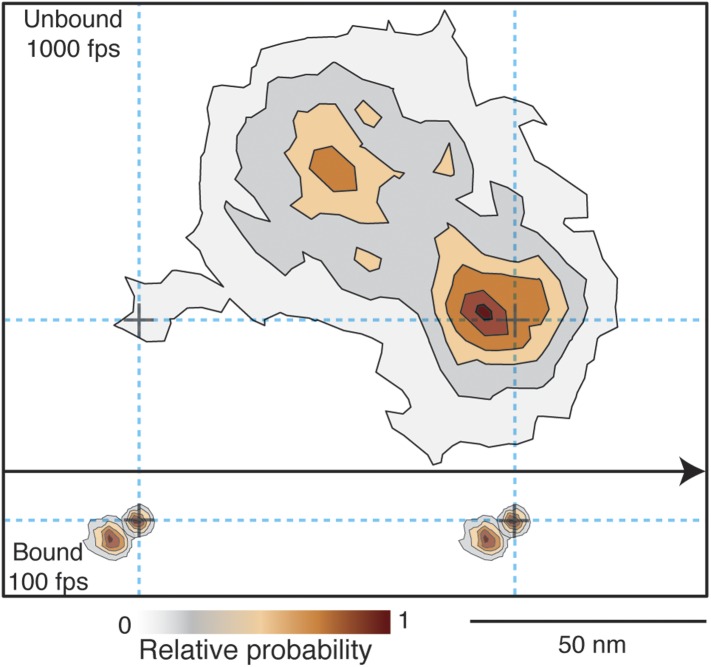
Figure 8. Probability density contour maps of the myosin step.

Upper panel represents the transient state of the unbound head. Contour map of a two-dimensional histogram with a 10 × 10 nm2 bin width obtained from the 1000 frames/s data (N = 486). Lower panel shows the AB transition within the bound head, a two-dimensional histogram with a 1 × 1 nm2 bin width generated using the 100 frames/s data (N = 129). All contributing steps were aligned and those to the right of the filament when viewed in the direction of motion were mirrored. The arrow represents direction of movement (from left to right).

DOI: http://dx.doi.org/10.7554/eLife.05413.018

Figure 8.

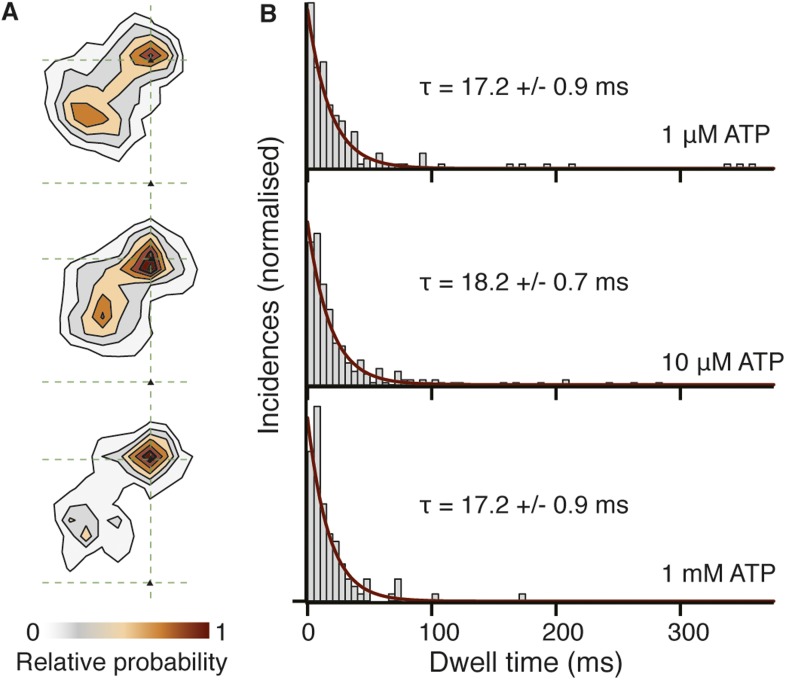
Figure 8—figure supplement 1. Spatiotemporal dynamics of the transient state as a function of ATP concentration.

Figure 8—figure supplement 1.

(A) Contour maps of the transient state at three different ATP concentrations. Obtaining traces at high ATP concentration was challenging due to the small available field of view and rapid detachment of myosin from actin caused by the faster stepping rate. (B) Dwell time histograms at three different ATP concentrations (1 μM, N = 116; 10 μM, N = 223; 1 mM, N = 90). Fitting the dwell time distribution to a single exponential yields an average lifetime of 17.5 ± 0.6 ms, independent of ATP concentration.
Figure 8—figure supplement 2. Dwell time distributions for pre and post-power stroke states at different ATP concentrations.

Figure 8—figure supplement 2.

In all cases, data and fits for the pre-power stroke state are shown in red; data and fits for the post-power stroke state are shown in blue. At saturating (1 mM) ATP concentration (A) both dwell time distributions exhibited single exponential behaviour in line with ADP release being the rate limiting step. The constants for the A state dwell times are given by kA and that for the B state by kB. At lower ATP concentrations, sequential ADP release and ATP binding result in bi-exponential behaviour. At 10 μM ATP (B), both kinetic constants, k1, k2, are almost identical therefore the dwell time distribution is fit to two sequential process with the same rate constant (termed kA for the dwell time of the A state and kB for that of the B state). (C) At 1 μM ATP the process is limited by ATP binding. Data taken at 100 frames/s, we increased the imaging speed to 400 Hz at 1 mM ATP concentration. Total number of steps recorded: 110, 245 and 104, for 1 μM, 10 μM and 1 mM, respectively.
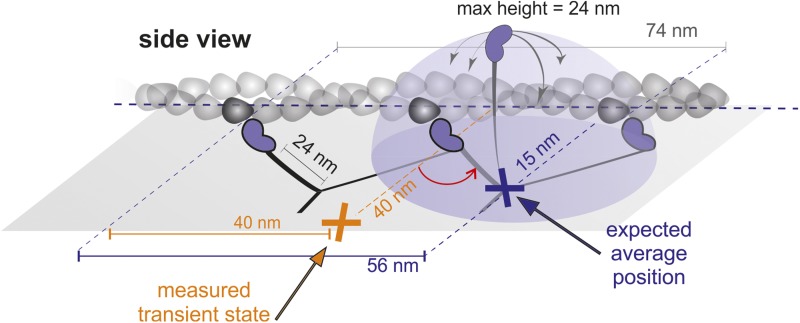
Figure 8—figure supplement 3. Geometrical considerations assuming myosin molecules moving parallel to the glass surface.

Figure 8—figure supplement 3.

If the head searched the full spherical space, the average position would be simply about half way between the leading head and the next binding site. For a parallel orientation this would be 56 nm forward and 15 nm off axis and for a perpendicular orientation 56 nm forward but ‘in line’ with the bound head positions. These numbers arise from simple geometric considerations but also agree with much more sophisticated simulations based on a free rotational diffusion model (Hinczewski et al., 2013). We, however, observed a transient state half way between the two binding sites, 40 nm off axis (marked in orange), which rules out this geometry.
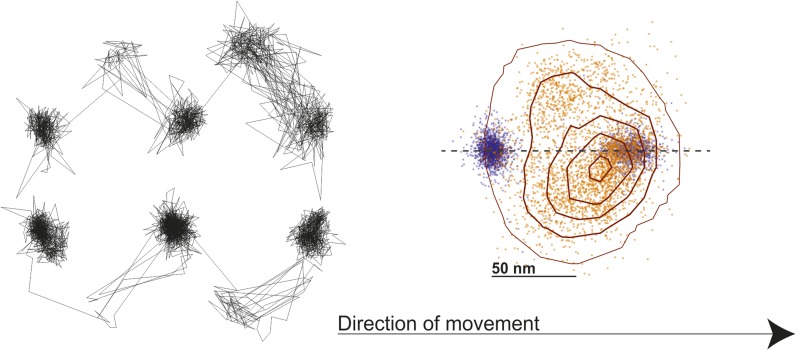
Figure 8—figure supplement 4. Probability density contour map of the transient state.

Figure 8—figure supplement 4.

Contour map of a two-dimensional histogram with a 18 × 18 nm2 bin width was obtained using all, left- and right- handed walking traces, without flipping (left panel). The resulting contour plot shows good agreement with previous results (Dunn and Spudich, 2007).