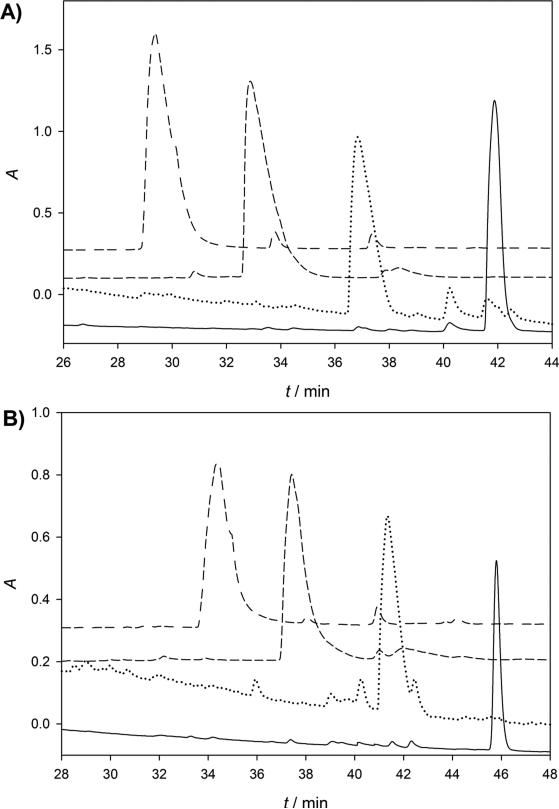
Figure 1.
HPLC profiles of enzymatic conversions: from 17a to 26a (A) and from 17b to 26b (B). The peaks in black, red, green, and purple represent compounds 17, 24, 25, and 26 shown in Scheme 5, respectively. The reaction progress was monitored by HPLC with an analytical column (Luna C18-2, 5 μm, 4.6 mm × 250 mm) that was eluted at 1 mL/min using a linear gradient from 10 to 90% methanol in 10.0 mM ammonium acetate (pH 4.00) over 60 min.

