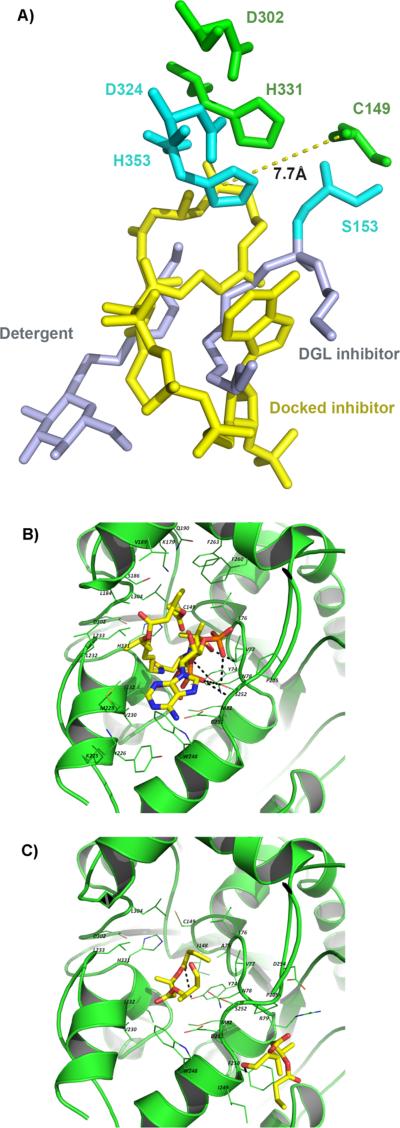
Figure 4.
Docking study. (A) Overlay of docking model (green: catalytic residues; yellow: sT-CH2-CoA) and DGL (1KQ8, blue) complexed with an inhibitor and detergent (grey); (B) Binding mode of sT-CH2-CoA. H-bonds are represented by dashed lines; (C) Binding of sT-aldehyde. Two modes with the highest ΔGb are shown here. H-bond is represented by a dashed line.

