
Figure 6. Frequency Gradient with Length for Highest Velocity Micro-Motions.
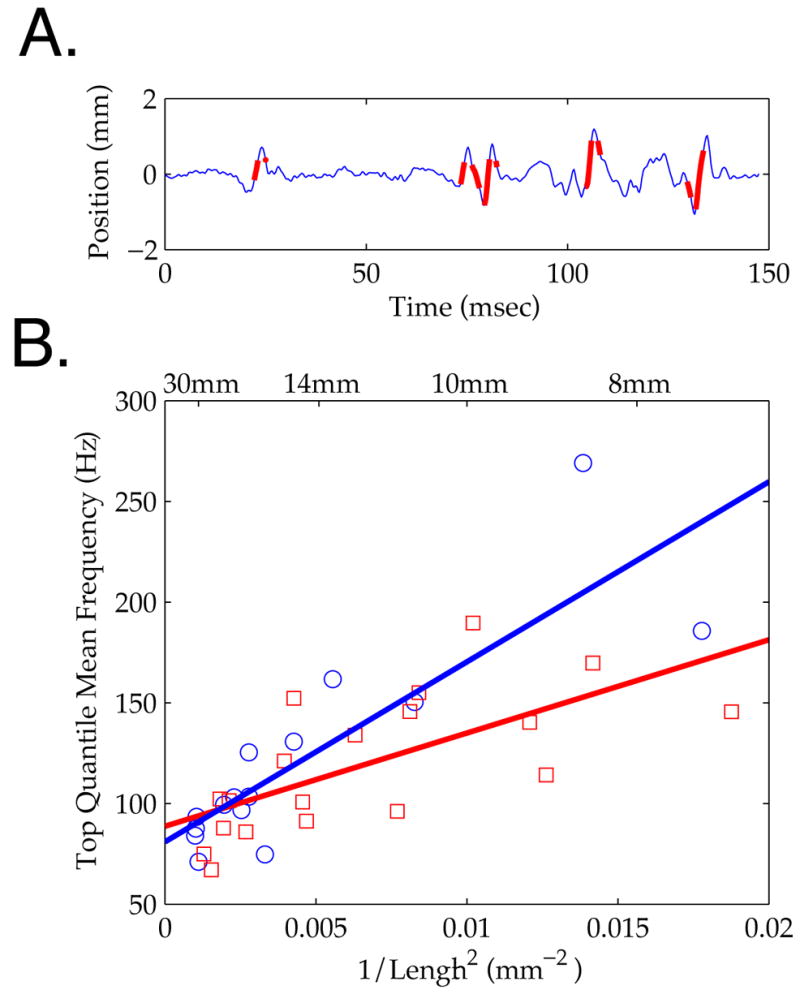
A. Example vibrissa micro-motion trace (blue), with time points in the highest 10% of velocity overlaid (thick red). B. Mean Hilbert frequency for high velocity time points plotted against 1/Length2, showing the same linear relationship as in Figures 4 and 5. Symbol type indicates rough (red square) or smooth (blue circle) contact; lines are corresponding linear regressions (see text).