

Abstract
We evaluated the prevalence and prognostic value of CT-pulmonary angiographic (CTPA) measures in 292 treatment naive patients with pulmonary arterial hypertension (PAH). Pulmonary artery calcification (13%) and thrombus (10%) were exclusively seen in PAH-congenital heart disease. Oesophageal dilation (46%) was most frequent in PAH-systemic sclerosis. Ground glass opacification (GGO) (41%), pericardial effusion (38%), lymphadenopathy (19%) and pleural effusion (11%) were common. On multivariate analysis, inferior vena caval area, the presence of pleural effusion and septal lines predicted outcome. In PAH, CTPA provides diagnostic and prognostic information. In addition, the presence of GGO on a CT performed for unexplained breathlessness should alert the physician to the possibility of PAH.
Keywords: Primary Pulmonary Hypertension
Introduction
Pulmonary hypertension (PH) ranges from a mild elevation in pressure in severe cardiac/respiratory disease to rare conditions where severe pressure elevation results in right heart failure and death. The current classification identifies 5 major groups, defining prognosis and treatment. Classification within groups is also important. In pulmonary arterial hypertension (PAH), survival in idiopathic PAH (IPAH) is superior to PAH associated with connective tissue disease (PAH-CTD) but inferior to PAH associated with congenital heart disease (PAH-CHD).1
Due to the heterogeneity of PH, imaging is recognised as a valuable tool improving phenotyping and providing prognostic information, complementing data from right heart catheterisation. Cardiac MR provides functional information whereas CT provides structural information, depicting features which may cause and be due to PH. Previous CT studies in PH have mainly been in mixed groups; only a small number of CT parameters have been studied and prognostic data are limited. Our objective was to systematically evaluate the prevalence, diagnostic and prognostic value of vascular, cardiac, parenchymal and mediastinal CT findings in patients with PAH at the time of diagnosis.
Methods
Consecutive treatment naive patients with PAH were identified from the ASPIRE Registry1 of patients referred to a PH referral centre. Classification was by standard criteria following multidisciplinary assessment. Inclusion criteria required the patient to have undergone multislice CT-pulmonary angiography (CTPA) and high resolution computed tomography (HRCT) within 3 months of initial diagnostic right heart catheterisation (RHC), except for Eisenmenger's syndrome in whom RHC was not routinely performed.
Image analysis and interpretation: see online supplement.
Vascular changes: Pulmonary artery to aorta ratio (PA to Ao ratio), depth of pericardial effusion, reflux of contrast into the hepatic veins and inferior vena cava (IVC) cross-sectional area were measured (figures 1 and 2).
Figure 1.
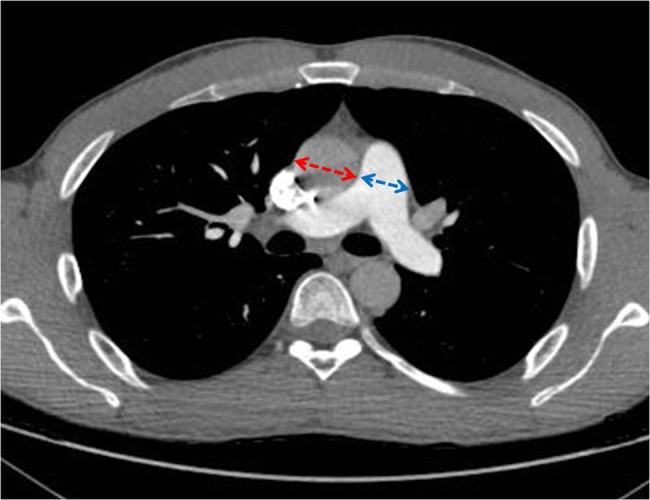
The pulmonary artery (PA) aorta ratio was obtained by measuring the widest transverse diameter of the PA (blue) and the corresponding transverse diameter of aorta (red).
Figure 2.

Grading of tricuspid regurgitation. (A) 0=There is no reflux into IVC, (B) 2=reflux into IVC but not hepatic veins, (C) 3=reflux into IVC and proximal hepatic veins and (D) 4=reflux into IVC and distal hepatic veins.
Cardiac changes: Right ventricle to left ventricle ratio (RV to LV ratio), right atrial size, interventricular (IV) septal position and RV free wall thickness were recorded (figure 3).
Figure 3.
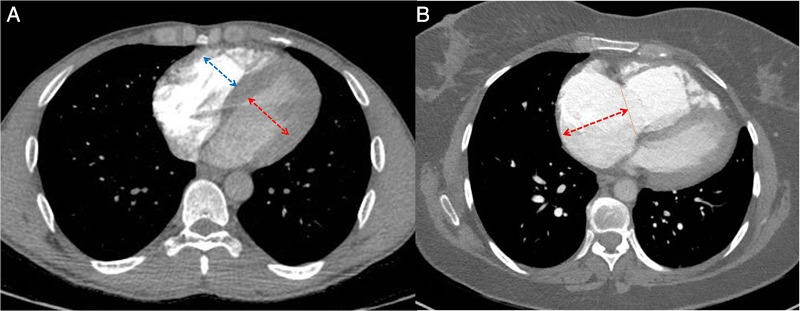
(A) The maximum mid-transverse diameters of the RV (right arrow) and LV (left arrow) cavities were measured in the axial plane at their widest points between the inner surfaces of the free wall and the interventricular septum. (B) For assessing the right atrial margin (arrow) on CT, right atrial length was measured from the centre of tricuspid annulus to the superior right atrial margin. RV, right ventricle; LV, left ventricle.
Parenchymal and mediastinal changes: The presence of ground glass opacification (GGO) and the pattern/distribution was noted (figure 4). CT scans were assessed for fibrosis, pleural effusions, mediastinal lymphadenopathy and dilated bronchial collaterals.
Figure 4.

Centrilobular ground glass pattern (A) and central ground glass pattern (B).
Results
Of 444 consecutive patients with PAH from the ASPIRE Registry (2006–2010), 292 patients had multislice CTPA/HRCT within 3 months of right heart catheterisation; mean age, 62±16 years (table 1) (see online supplement for haemodynamic and demographic characteristics, figure 5 and online supplementary table S2).
Table 1.
Features seen on CT-pulmonary angiography in patients with pulmonary arterial hypertension (PAH) and its major subgroups
| CT parameters | PAH (n=292) |
IPAH (n=74) |
PAH-SSc (n=95) | PAH-CTD-non-SSc (n=39) |
PAH-portal (n=14) |
PAH-CHD (n=63) |
PAH-CHD- Eisenmenger (n=31) |
|---|---|---|---|---|---|---|---|
| Vascular changes | |||||||
| PA to Ao ratio∼ | 1.16 (0.21) | 1.19 (0.18)* | 1.04 (0.16)* | 1.07 (1.16)* | 1.08 (0.17)* | 1.26 (0.40)†‡§*¶ | 1.46 (0.45) |
| IVC size (mm2)∼ | 596 (207) | 583 (200) | 570 (203) | 546 (206) | 632 (156) | 647 (209) | 659 (212) |
| TR present | 73 | 80 | 67 | 62 | 57 | 85 | 93 |
| Grade 1 | 18 | 15 | 20 | 23 | 36 | 14 | 16 |
| Grade 2 | 21 | 24 | 23 | 15 | 14 | 19 | 23 |
| Grade 3 | 12 | 16 | 13 | 13 | 0 | 8 | 22 |
| Grade 4 | 22 | 24 | 12 | 10 | 7 | 44 | 32 |
| Calcification in PA | 3 | 0 | 0 | 0 | 0 | 13 | 16 |
| Thrombus in PA | 2 | 0 | 0 | 0 | 0 | 10 | 13 |
| Cardiac changes | |||||||
| RV to LV ratio | 1.25 (0.42) | 1.39 (0.46) | 1.19 (0.48) | 1.19 (0.36) | 1.25 (0.35) | 1.15 (0.30) | 1.23 (0.38) |
| RVH (mm) | 6 (2.7) | 6 (2.3)‡ | 4 (1.78)*¶ | 4 (3.21)* | 6 (1.89) | 7 (4.26)§‡ | 8 (2.5) |
| RA size (mm) | 55 (12.1) | 57 (10.9) | 53 (12.5)* | 52 (13.1)* | 56 (17.2) | 59 (13.4)§‡ | 59 (14.6) |
| RA size | |||||||
| Moderate | 28 | 35 | 20 | 26 | 36 | 35 | 42 |
| Severe | 20 | 24 | 16 | 10 | 14 | 27 | 22 |
| IV septum | |||||||
| Flattened | 31 | 42 | 24 | 26 | 43 | 30 | 29 |
| Deviated | 27 | 34 | 19 | 21 | 21 | 33 | 29 |
| Pericardial effusion | |||||||
| Present | 38 | 38 | 36 | 53 | 42 | 48 | 30 |
| Depth (mm)∼ | 12 (5) | 8 (7) | 14 (6) | 13 (6) | 14 (5) | 13 (4) | 11 (4) |
| Lung and mediastinal changes | |||||||
| GGO present | 41 | 42 | 36 | 24 | 21 | 60 | 58 |
| Central pattern** | 21 | 10 | 51 | 10 | 2 | 5 | 6 |
| Centrilobular pattern** | 55 | 48 | 61 | 60 | 67 | 53 | 56 |
| Collaterals vessel | 11 | 9 | 1 | 8 | 0 | 35 | 55 |
| Lymphadenopathy | 19 | 22 | 25 | 27 | 0 | 10 | 16 |
| Pleural effusion | 11 | 14 | 15 | 8 | 14 | 5 | 3 |
| Septal lines | 21 | 30 | 23 | 5 | 21 | 18 | 23 |
| Ascites | 5 | 5 | 4 | 8 | 14 | 2 | 0 |
| Oesophageal dilatation | 23 | 7 | 46 | 36 | 7 | 6 | 10 |
Frequency is expressed as a percentage; for absolute values, data are expressed as mean (SD).
*p<0.05 in comparison with PAH-CHD.
†p<0.05 in comparison with PAH-portal.
‡p<0.05 in comparison with PAH-SSc.
§p<0.05 in comparison with PAH-CTD-non-SSc.
¶p<0.05 in comparison with IPAH.
**Represents percentage of the patients with GGO present.
Ao, aorta; CHD, congential heart disease; CTD, connective tissue disease; GGO, ground glass opacification; IPAH, idiopathic pulmonary arterial hypertension; IV, interventricular; IVC, inferior vena cava; LV, left ventricle; PA, pulmonary artery; PAH, pulmonary arterial hypertension; RA, right atrium; RV, right ventricle; RVH, right ventricular hypertrophy; TR, tricuspid regurgitation; SSc-systemic sclerosis.
Figure 5.

Flow chart demonstrating patient inclusion.
Vascular changes
The PA to Ao ratio was highest for patients with PAH-CHD-Eisenmenger followed by IPAH. Greater IVC dilatation was observed in PAH-portal and PAH-CHD. Regurgitation of contrast into hepatic veins was frequent across the subgroups. PA calcification and mural thrombus were noted only in patients with PAH-CHD and occurred in 16% (calcification) and 13% (mural thrombus) in PAH-CHD-Eisenmenger group.
Cardiac changes
The RV to LV ratio for PAH was 1.25±0.42 (mean±SD) highest in IPAH although there were no statistically significant differences between groups. The RV wall thickness was 6±2.7 mm for PAH and within subgroups less RV hypertrophy was seen in PAH-CTD (PAH systemic sclerosis (PAH-SSc) and PAH-CTD-non-SSc). Mean right atrium (RA) size for PAH was 55 mm±12.1. Qualitative grading of the RA showed 82% had right atrial enlargement. A higher proportion of patients with IPAH and PAH-CHD were graded as severe RA enlargement compared with other subgroups. Deviation of the IV septum towards the LV was evident in 27% of patients with PAH and most frequent in IPAH. A pericardial effusion was seen in 38% of patients most frequently in patients with PAH-CTD-non-SSc and least frequently in PAH-CHD-Eisenmenger.
Parenchymal and mediastinal changes
Ground glass opacities were frequent in PAH (41%), most commonly PAH-CHD. The predominant pattern of GGO in PAH was a centrilobular pattern. In PAH-SSc, 51% of patients had central distribution of GGO and 49% had non-central distribution; compared with a low occurrence of central distribution in other subgroups.
Dilated collateral vessels occurred most commonly in patients with PAH-CHD-Eisenmenger syndrome.
Survival results
The maximal duration of follow-up was 6 years (mean 3 years) and there were 112 deaths. Multivariable Cox proportional hazard analysis incorporating clinical, haemodynamic and CT parameters showed CT parameters, inferior vena caval area and the presence of pleural effusion/septal lines to be significant predictors of death (see online supplementary tables S3 and S4 and figures 2 and 6).
Figure 6.
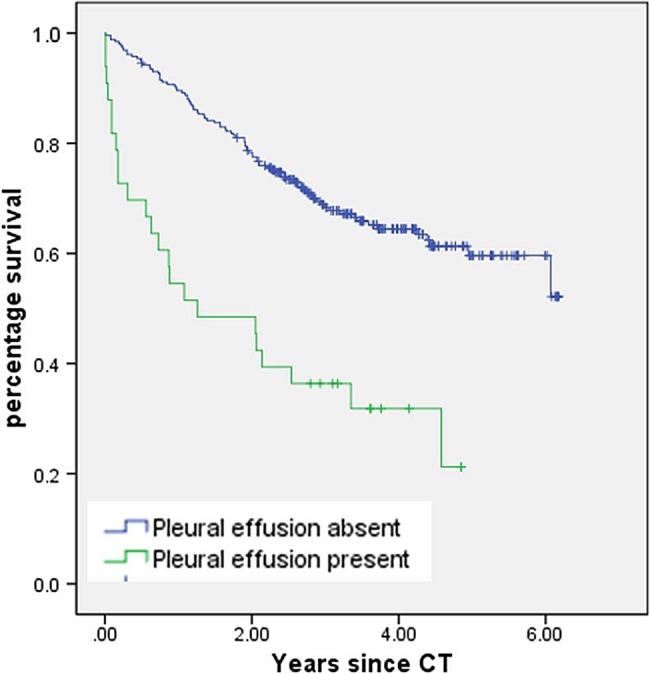
Kaplan–Myer curve demonstrating survival based on the presence/absence of pleural effusion.
Discussion
This study is the first comprehensive report of the prevalence and relative prognostic value of vascular, cardiac, lung parenchymal and mediastinal changes on CT in PAH and its major subgroups. Within subgroups, different vascular and cardiac configurations are observed, reflecting the heterogeneity of PAH. We have demonstrated that cardiac and vascular morphology can predict outcome in PAH and CT measures such as IVC area, and pleural effusion/septal lines are independent prognostic markers.
In addition to established measures, quantifiable CT findings including elevated RV to LV ratio, deviated IV septum, dilated RA, RV free wall hypertrophy, pericardial/pleural effusions, contrast regurgitation into the hepatic veins and GGO occur frequently in PAH and major subgroups.
Different CT patterns were observed in PAH subgroups but none were diagnostic. IPAH and PAH-CHD-Eisenmenger have a higher proportion of severe RA dilatation, contrast regurgitation into hepatic veins and ground glass opacities. While more patients with IPAH have a deviated IV septum and greater RV to LV ratio, the Eisenmenger group had a higher PA to Ao ratio, PA calcification, mural thrombus and dilated collateral vessels. Although the higher RV to LV ratio in IPAH may appear counterintuitive, this may reflect better preserved RV function in the conditioned RV of the Eisenmenger patient and the off-loading effect of a right-left shunt. We noted that central distribution of ground glass opacity was frequent in patients with PAH-SSc whereas a centrilobular pattern was more common in IPAH and PAH-CHD-Eisenmenger.
CT features predict outcome in treatment naive PAH including RV to LV ratio, right atrial size, IV septal position, inferior vena caval size, pericardial/pleural effusions, mediastinal lymphadenopathy and septal lines. Most of these parameters predict survival in major subgroups (see online supplementary table S4). IVC area the presence of pleural effusions/septal lines were predictors of outcome independent of pulmonary haemodynamics and WHO functional class, highlighting the prognostic value of CT.2 In PAH, RV function is a prognostic determinant. IV septal displacement and dilatation of RV as shown by a high RV to LV ratio on CT reflect a failing RV and it is not surprising they have prognostic significance. A failing RV and tricuspid regurgitation elevate right atrial pressure. Inferior vena caval size was demonstrated to be a strong predictor of outcome. Vena caval diameter reflects the pressure in the RA2 which is an important prognostic marker in PAH. Elevated right atrial pressure impedes mediastinal lymphatic and venous drainage resulting in the development of septal lines, mediastinal lymphadenopathy and pleural and pericardial effusions. These features are not surprisingly associated with a poor outcome.
Ground glass attenuation is described in patients with PH.3 Our results show that GGO is seen in all major subgroups of PAH. Centrilobular pattern of GGO correlated with poor outcome following treatment in patients with PAH in a previous study.4 In our study, this prognostic observation was restricted to IPAH and was not seen in other major subgroups. We found a lower prevalence of GGO/septal lines in PAH-SSc than may have been expected but this reflects the rigorous way that patients with SSc with coexisting lung disease are excluded in the ASPIRE Registry, with this group having an FVC of 95±14% (see online supplement).
So how does an appreciation of CT characteristics in PAH help the physician? First, although there is overlap in the different forms of PAH, the presence of a ground glass pattern affecting the central part of the lung and sparring the periphery with oesophageal dilation should raise the possibility of underlying systemic sclerosis, whereas a centrilobular ground glass pattern with a very large PA and luminal calcification should suggest the possibility of an underlying congenital heart problem and prompt further investigation to confirm or refute these diagnoses. Second, the presence of adverse prognostic features on CT such as the presence of a pleural effusion, septal lines or a dilated IVC should alert the physician that the patient falls into a poor prognostic group prompting urgent referral for specialist assessment and treatment. Given that CT results in radiation exposure and there are other validated biomarkers which are sensitive to change, its use in follow-up is not recommended. Whether a reduction in IVC area or resolution of pleural effusions/septal lines is of prognostic importance is not answered by this study. Finally, a centrilobular ground glass pattern is very common in PAH and its presence should alert the physician to the possibility of PAH if the scan was performed for unexplained breathlessness and be a prompt to look for other CT features such as PA and RV enlargement, which are seen in PH.
There are limitations to our study. We used non-gated axial images. However, the purpose of our study was to evaluate uncomplicated measurements in a non-gated CT frequently performed as a first line examination. Second, pulmonary veno-occlusive disease (PVOD) has several overlapping clinical and pathological features with IPAH, which are difficult to recognise without lung biopsy or transplantation. It is possible that patients with PAH in our cohort may have had PVOD, although the number of patients found to have histological evidence of PVOD in a previous study at postmortem was low.5 In this cohort of patients, the majority of patients were in WHO functional capacity III and IV, comparable with the majority of Registry data from this era. Some more recent reports have identified a higher proportion of patients with earlier stage disease.
In conclusion, we report features of PAH and its major subgroups on a pretreatment CT and demonstrate that CT measures including the presence of pleural effusion/septal lines and inferior vena caval area predict outcome. Finally, GGO is commonly seen in PAH and its presence on a CT performed for breathlessness should raise the possibility of this diagnosis.
Supplementary Material
Footnotes
Contributors: Study concepts/study design or data acquisition or data analysis/interpretation: all authors. Manuscript drafting or manuscript revision for important intellectual content and manuscript final version approval: all authors. Literature research: SR, AJS, DGK and JMW. Clinical studies: SR, AJS, CJ, CD, CH and DGK. Statistical analysis: SR, AJS and RC. Manuscript editing: SR, AJS, CD, CH, IS, JMW and DGK.
Competing interests: None.
Ethics approval: Local ethical approval committee.
Provenance and peer review: Not commissioned; externally peer reviewed.
References
- 1.Hurdman J, Condliffe R, Elliot CA, et al. Aspire Registry: assessing the spectrum of pulmonary hypertension identified at a referral centre. Eur Respir J 2012;39:945–55. [DOI] [PubMed] [Google Scholar]
- 2.Nagueh SF, Kopelen HA, Zoghbi WA. Relation of mean right atrial pressure to echocardiographic and Doppler parameters of right atrial and right ventricular function. Circulation 1996;93:1160–9. [DOI] [PubMed] [Google Scholar]
- 3.Sherrick AD, Swensen SJ, Hartman TE. Mosaic pattern of lung attenuation on CT scans: frequency among patients with pulmonary artery hypertension of different causes. AJR Am J Roentgenol 1997;169:79–82. [DOI] [PubMed] [Google Scholar]
- 4.Resten A, Maitre S, Humbert M, et al. Pulmonary arterial hypertension: thin-section CT predictors of epoprostenol therapy failure. Radiology 2002;222:782–8. [DOI] [PubMed] [Google Scholar]
- 5.Resten A, Maitre S, Humbert M, et al. Pulmonary hypertension: CT of the chest in pulmonary venoocclusive disease. AJR Am J Roentgenol 2004;183:65–70. [DOI] [PubMed] [Google Scholar]
Associated Data
This section collects any data citations, data availability statements, or supplementary materials included in this article.