Background: NADPH oxidase is a hydrogen peroxide-generating enzyme, involved in redox signaling in cancer.
Results: NADPH oxidase-generated hydrogen peroxide increases DNA damage and genomic instability.
Conclusion: NADPH oxidase-derived hydrogen peroxide mediates DNA damage in acute myeloid leukemia (AML).
Significance: The mechanism of DNA damage generation is important for studying aggressive AML phenotypes.
Keywords: DNA Damage, Genomic Instability, Leukemia, NADPH Oxidase, Oncogene, Reactive Oxygen Species (ROS), Redox
Abstract
Internal tandem duplication of the FMS-like tyrosine kinase (FLT3-ITD) receptor is present in 20% of acute myeloid leukemia (AML) patients and it has been associated with an aggressive AML phenotype. FLT3-ITD expressing cell lines have been shown to generate increased levels of reactive oxygen species (ROS) and DNA double strand breaks (DSBs). However, the molecular basis of how FLT3-ITD-driven ROS leads to the aggressive form of AML is not clearly understood. Our group has previously reported that inhibition of FLT3-ITD signaling results in post-translational down-regulation of p22phox, a small membrane-bound subunit of the NADPH oxidase (NOX) complex. Here we demonstrated that 32D cells, a myeloblast-like cell line transfected with FLT3-ITD, have a higher protein level of p22phox and p22phox-interacting NOX isoforms than 32D cells transfected with the wild type FLT3 receptor (FLT3-WT). The inhibition of NOX proteins, p22phox, and NOX protein knockdowns caused a reduction in ROS, as measured with a hydrogen peroxide (H2O2)-specific dye, peroxy orange 1 (PO1), and nuclear H2O2, as measured with nuclear peroxy emerald 1 (NucPE1). These reductions in the level of H2O2 following the NOX knockdowns were accompanied by a decrease in the number of DNA DSBs. We showed that 32D cells that express FLT3-ITD have a higher level of both oxidized DNA and DNA DSBs than their wild type counterparts. We also observed that NOX4 and p22phox localize to the nuclear membrane in MV4–11 cells expressing FLT3-ITD. Taken together these data indicate that NOX and p22phox mediate the ROS production from FLT3-ITD that signal to the nucleus causing genomic instability.
Introduction
FMS-like tyrosine kinase 3 (FLT3)2 is a type III receptor tyrosine kinase important for hematopoiesis, normally expressed in early hematopoietic precursors (1, 2). Internal tandem duplication (ITD) is a mutation in the juxtamembrane domain of the FLT3 that results in the loss of the autoinhibitory function and a constitutive activation of the receptor (1, 3). FLT3-ITD mutation occurs in about 20% of AML cases and it is associated with a poor prognosis for patients (4, 5). Constitutively activated FLT3-ITD kinase stimulates aberrant proliferative signaling pathways, including PI3K, RAS/ERK, and STAT5 pathways characterized by resistance to apoptosis, abnormal cell growth, and differentiation block (6–10). It was also demonstrated that cells expressing the ITD-mutated FLT3 generate higher levels of ROS (11–13).
ROS, for example, H2O2, are considered to play an important role in cancers, including leukemia (14, 15). Due to their DNA damaging properties, they are known to contribute to genomic instability. It was proposed that tumor cells must acquire some form of genomic instability, because the normal rate of mutation is insufficient to provide the number of mutations required for the oncogenic transformation (16–18). Different oncogenes have been shown to induce a higher level of ROS and genomic instability, e.g. BCR-ABL, RAS (18–21). However, little is known of how FLT3-ITD generates such as stress.
There are several proposed mechanisms of how genomic instability occurs in cancers. FLT3-ITD was demonstrated to activate alternative unfaithful DNA repair pathways that leads to increased levels of unrepaired DNA damage (22). Interestingly, it was also shown that increased efficiency of FLT3-ITD-stimulated DNA repair contributes to drug resistance (23).
Another origin of genomic instability is increased ROS production that causes excessive DNA damage. Sallmyr et al. (11) showed that FLT3-ITD-generated ROS are mediated by Rac1 GTPase, which is an essential component of the NOX complex. NOXs are one of the sources of ROS in cells. There are 7 isoforms of NOXs, NOX1–5, and DUOX1–2 that display remarkable differences in the recruitment of regulatory subunits (p22phox, p47phox, p67phox, and Rac1/2), mechanisms of activation, and distinct subcellular localization. NOX1–4 require p22phox for the correct functioning and stability of the complex (24). The role of NOXs in various processes of the cellular transformation, e.g. genomic instability, cell growth and survival, angiogenesis and metastasis, has been well established in recent years (25). Emerging work has suggested that NOX4-derived ROS may play a substantial role in genomic instability (26).
It was proposed that FLT3-ITD controls NOX through levels of the rate-limiting substrate NADPH (27). The same report demonstrated that NOX2 and NOX4 have been shown to play a role in migration and growth in FLT3-ITD expressing cells (27). FLT3-ITD activated NOX-produced ROS were also revealed to cause oxidation of tumor suppressor DEP-1 phosphatase (12).
Our group demonstrated that FLT3-ITD-stimulated ROS are mediated by maintenance of expression of p22phox, a small membrane-bound NOX complex subunit, expression (13). We have also shown that p22phox-mediated ROS are critical for phosphorylation of STAT5 (13).
In this report we demonstrated that FLT3-ITD causes increased levels of the nuclear H2O2 that damages DNA. We showed that in p22phox, NOX siRNA knockdowns caused a decrease in H2O2 with a subsequent decrease in DNA damage in these cells. Here we propose that FLT3-ITD causes an increase in NOX and p22phox protein levels that generate H2O2 at the nuclear membrane. This H2O2 diffuses to the nucleus where it oxidatively damages DNA contributing to genomic instability.
EXPERIMENTAL PROCEDURES
Cell Culture and Treatments
The human leukemic cell lines, MV4-11 (homozygous for the FLT3-ITD mutation) and HL-60 (homozygous for the FLT3-WT), were all purchased from DSMZ (Braunschweig, Germany). The 32D cell line, stably transfected with FLT3-WT or FLT3-ITD, was a kind gift from Prof. Hubert Serve from Goethe University Frankfurt and Prof. Frank D. Bohmer from the Universitatsklinkium Jena. The cell lines were maintained in RPMI 1640 supplemented with 10% FBS, 1% penicillin/streptomycin, and 2 mm l-glutamine in a humidified incubator at 37 °C with 5% CO2. For 32D cell lines, 10% WEHI-conditioned medium was added as a source of IL-3. FLT3-ITD was inhibited using PKC412 (50 nm; Tocris Biosciences, Bristol, UK) at the indicated times. NOX inhibition was achieved using diphenyleneiodonium (DPI; Sigma) at the indicated times and concentrations. Dimethyl sulfoxide was used as a vehicle. Stimulation of wild type FLT3 receptor was achieved by incubation of the 32D cell line transfected with FLT3-WT with recombinant human FLT3 ligand (100 ng/ml; number 300-19, PeproTech).
Measurement of Intracellular H2O2
Total intracellular H2O2 was measured by incubating cells with 10 μm cell-permeable H2O2 probe PO1 (a kind gift from Dr. Chang, University of California Berkley) for 1 h in the dark. Cells were then briefly washed with PBS and immediately read by flow cytometry using FACSCalibur (BD Biosciences) and Cellquest Pro software (BD Biosciences). The mean fluorescent intensity of 10,000 events was determined. The measurement of nuclear H2O2 was achieved using NucPE1 (a gift from Dr. Chang). The cells were incubated for 45 min at 10 μm NucPE1 in the dark. The incubation was followed by washing and analysis by flow cytometry as explained above. Mitochondrial ROS were measured using MitoSOX probe. The cells were incubated with 5 μm MitoSOX for 15 min in the dark. The incubation was followed by washing and analysis by flow cytometry.
Live Confocal Microscopy
The MV4-11 cells were incubated overnight on the poly-d-lysine (P4707; Sigma)-coated glass bottomed dishes (P35G-1.5-14-C; MatTek Corp., Ashland, MA). 1 h before imaging the cells were treated where indicated with 10 μm DPI or PKC412 (50 nm; Tocris Biosciences, Bristol, UK). For siRNA experiments, following the transfection, the cells were plated overnight on the glass-bottomed dishes as indicated above. Confocal fluorescence live imaging of PO1-stained cells was performed as described previously in Woolley et al. (13) using a Zeiss LSM510 META confocal microscope fitted with ×63 1.4 plan achromat lens. Live imaging of the NucPE1 probe was carried out using excitation at 488 nm with an argon laser, and emission was collected using a META detector at about 520 nm. The Hoechst dye was incubated together with NucPE1 where indicated. When multiple staining of NucPE1 and PO1 was performed, the multitracking mode of scanning was applied for acquisition of the images. Image analysis was performed in Carl Zeiss Zen Light Edition.
Immunofluorescence
The immunofluorescence procedure was performed as described in Woolley et al. (13). Briefly, the cells were incubated overnight on the poly-d-lysine-coated glass coverslips. The next day, cells were fixed for 1 h in 3% PFA/PBS and permeabilized with 0.2% BSA, 0.05% saponin/PBS. The cells were then incubated with 50 μl of appropriate primary antibody diluted in 5% FBS/PBS for 1 h at room temperature in a humidified chamber. Following washing, secondary antibodies conjugated to Alexa Fluor 594 or 488 diluted in 5% FBS/PBS were incubated for 1 h in the dark. After washing the coverslips were mounted on the slides using Mowiol. Images were acquired using Flouview FV1000 Confocal Laser Scanning Microscope with a ×100 oil immersion objective. Images are represented as a single slice from a Z stack projection.
8-OHdG Assay
Oxidative damage was assessed using 8-hydroxy-2′-deoxyguanosine (8-OHdG) as a marker, as described in Ref. 28. Approximately 2 × 10⁶ cells were washed with PBS and fixed for 1 h in 3% paraformaldehyde/PBS. After washing, cells were treated with 2 m HCl for 20 min at room temperature. HCl was removed and the cells were treated with 0.1 m sodium borate, pH 8.5, for 2 min. Cells were then washed and permeabilized with 0.2% BSA, 0.05% saponin/PBS. Following three additional washes with 3% BSA/PBS, cells were incubated with primary antibody against 8-OHdG (ab26842; 1:50; Abcam) overnight at 4 °C in a humidified chamber. The next day, the cells were washed three times with 3% BSA/PBS solution, and incubated with the secondary antibody conjugated to Alexa Fluor 594 for 1 h at room temperature. After removing the secondary antibody, cells were washed three times in PBS and analyzed using flow cytometry.
γ-H2AX Assay
DNA DSBs were measured using γ-H2AX (phosphorylated H2AX histone) as a marker. Approximately 2 × 10⁶ cells were washed with PBS and fixed for 1 h in 3% PFA/PBS. Cells were then incubated in 70% ethanol at −20 °C overnight. The next day, cells were washed and blocked for 15 min with 1% BSA/PBS. Following washing, cells were incubated in γ-H2AX antibody conjugated to Alexa Fluor 488 (Cell Signaling Technology, number 9719) in 1% BSA/PBS solution at 4 °C overnight. Cells were washed and analyzed by flow cytometry.
Western Blotting
The immunoblotting procedure was carried out as previously described by us in Woolley et al. (13). Briefly, the cells were lysed in RIPA buffer. Following the determination of protein concentration using the Bio-Rad Protein Assay (Bio-Rad), the proteins were resolved using SDS-polyacrylamide gel electrophoresis and transferred onto nitrocellulose membrane and incubated with appropriate primary antibody. 24 h later, the membrane was incubated in the secondary antibody coupled with Alexa Fluor 680 or 800. The signal was detected with the Odyssey infrared imaging system (LI-COR Biosciences).
Antibodies
Primary antibodies used for immunoblotting and immunofluorescence were 8-OHdG (ab26842; Abcam), γ-H2AX (number 9719, Cell Signaling Technology), p22phox (number SC20781; Santa Cruz Biotechnology), β-actin (number A5441), NOX4 (number NB110-58851; Novus Biologicals), NOX4 (number sc-21860), NUP98 (number SC-74578; Santa Cruz Biotechnology), NOX2 (number 7-024; Merck Millipore), and NOX1 (number sc-25545; Santa Cruz Biotechnology.
Small Interfering RNA (siRNA) Transfection
The siRNA transfection of MV4-11 cells was performed using the Nucleofector Kit L (Amaxa, Cologne, Germany) and Amaxa Nucleofector Technology (Q-001 program) according to the protocol provided by the company. Predesigned siRNA were used for silencing: p22phox (ID S3786) and NOX4 (ID S27015, S27014, and S27013). The siRNA transfection of 32D cells was performed using the Nucleofector Kit V (Amaxa, Cologne, Germany) and Amaxa Nucleofector Technology (E-032 program) according to the protocol provided by the company. The predesigned siRNA were used for silencing: p22phox (ID: s201230 (A), s64648 (B), s201231 (C)), NOX4 (ID s211726, s211725, and s78320), NOX1 (ID s108444), and NOX2 (s160436). For the negative control, the siRNA used was Silencer Select Negative Control #1 siRNA (negative). All were purchased from Ambion, Warrington, UK.
Statistical Analysis
the results are expressed as a percentage of control, defined to 100%. Values are mean ± S.D. and are representative of three independent experiments. Data were statistically analyzed using Student's t test with p < 0.05.
RESULTS
Inhibition of FLT3-ITD and NOX in MV4-11 Cell Line Reduced Total and Nuclear Endogenous H2O2
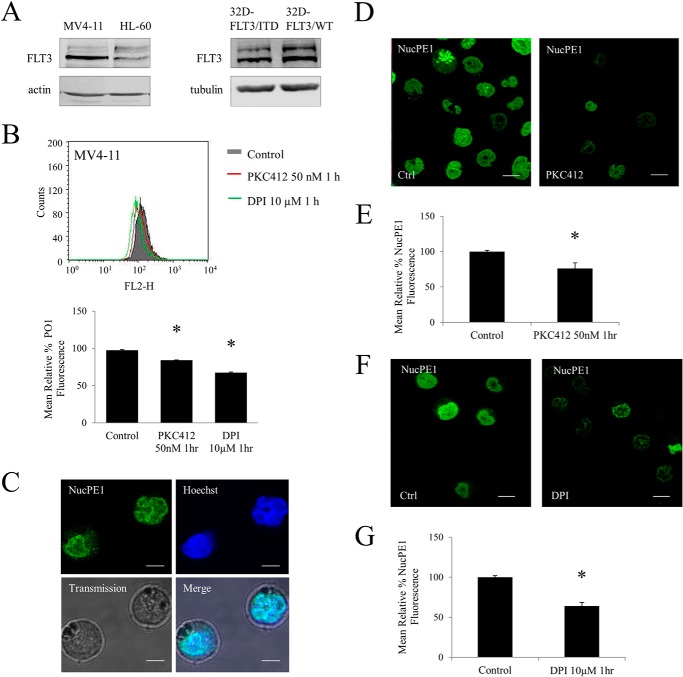
MV4-11 is a well established model AML cell line that expresses homozygous FLT3-ITD (Fig. 1A). Cells were treated with a commonly used, FLT3 inhibitor, PKC412 that is currently in clinical trials to treat AML patients, or with DPI, a flavoprotein inhibitor, which inhibits NOX proteins. We showed that both of these treatments result in a 20–30% decrease in H2O2 levels in MV4-11 when compared with vehicle (dimethyl sulfoxide)-treated control (Fig. 1B). These data suggested that both FLT3-ITD and NOX proteins play a role in the generation of H2O2 in these cells.
FIGURE 1.
Inhibition of FLT3-ITD and NADPH oxidases in MV4-11 cell line reduces total and nuclear endogenous H2O2. A, Western blot analysis of FLT3 receptor expression in HL-60 and MV4-11, patient-derived cell lines and 32D cell line transfected with FLT3-WT or FLT3-ITD. B, flow cytometric analysis of total cellular H2O2 as measured by H2O2 probe, peroxy orange 1 (PO1) in the MV4-11 cell line treated with PKC412 (50 nm for 1 h) and DPI (10 μm for 1 h). The bar chart shows the relative mean PO1 fluorescence of treated cells expressed as a percentage of control. C, colocalization of nuclear-localized H2O2 probe NucPE1 probe with Hoechst dye in MV4-11. The scale bar represents 5 μm. D–G, level of nuclear H2O2 in MV4-11 after inhibiting FLT3-ITD with PKC412 (D and E) and Nox with DPI (F and G). D, confocal images of nuclear H2O2 in MV4-11 cells following treatment with PKC412 (50 nm for 1 h). The scale bar represents 10 μm. E, flow cytometric analysis of mean relative NucPE1 fluorescence after PKC412 treatment. F, confocal images of nuclear H2O2 in MV4-11 cells following treatment with DPI (10 μm for 1 h). The scale bar represents 10 μm. G, flow cytometric analysis of mean relative NucPE1 fluorescence after DPI treatment. The mean is representative of three independent experiments. The asterisk indicates a statistically significant difference (p < 0.005) as analyzed by Student's t test. The error bars represent ± S.D.
Having confirmed that FLT3-ITD and NOX are involved in the increase in total H2O2, we investigated if the levels of nuclear H2O2 were affected by FLT3-ITD or NOX inhibition. To study H2O2 levels in the nucleus, we used a specific nuclear H2O2 probe, NucPE1. The probe was shown to specifically respond to H2O2 changes in the nucleus in vitro and in vivo (29). However, to confirm this occurrence in our cell line, we colocalized the NucPE1 fluorescence with nuclear tracker (Hoechst 33342) (Fig. 1C).
Using confocal microscopy, we show in Fig. 1D, that inhibition of FLT3-ITD with PKC412 resulted in a significant decrease in the nuclear H2O2 (Fig. 1D). Quantification of this change using flow cytometry revealed a 30% decrease in nuclear H2O2 following the PKC412 treatment (Fig. 1E). To determine whether NOX proteins were involved in generating H2O2 that was detectable in the nucleus, we measured nuclear H2O2 upon DPI treatment. Here we report that inhibition of NOX proteins resulted in a decrease of 35% in nuclear H2O2 in MV4-11 (Fig. 1, F and G). These data suggested that FLT3-ITD and NOX proteins are involved in the increase in nuclear H2O2.
32D Stably Transfected with FLT3-ITD Have higher Levels of Endogenous H2O2 Than 32Ds Transfected with FLT3-WT
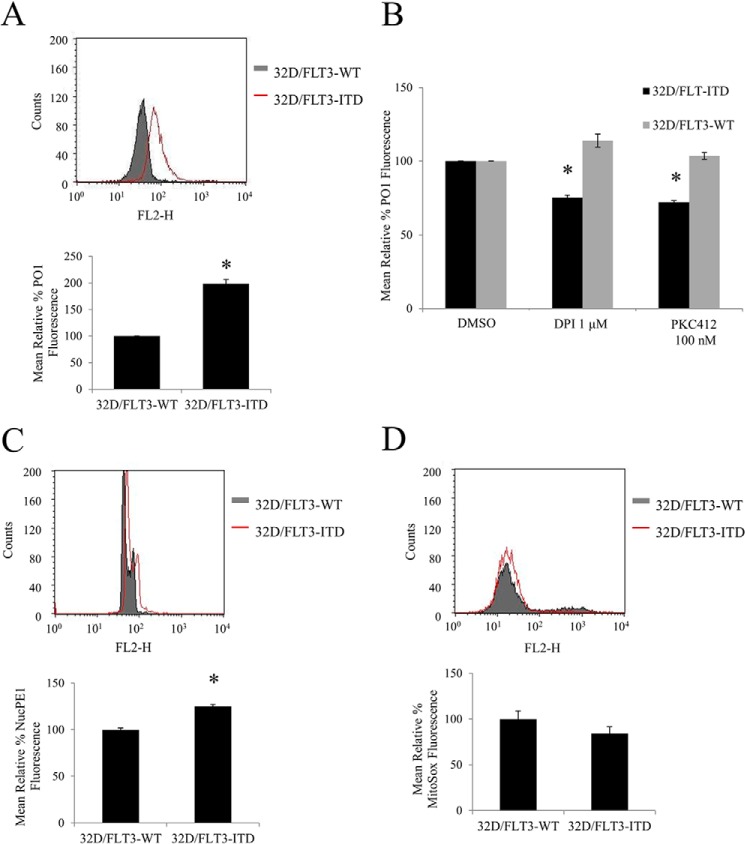
The inhibition of FLT3 receptor or NOX protein caused a decrease in H2O2 in 32D/FLT3-ITD cells, but not in 32D/FLT3-WT cells. The 32D cell line was previously used as a model to show differences in signaling from wild type versus mutated FLT3 receptor (8) (Fig. 1A). Here we showed that these cells transfected with FLT3-ITD possessed 100% more H2O2 than 32D cells transfected with the FLT3-WT receptor (Fig. 2A). Moreover, inhibition of FLT3 or NOX resulted in the decrease in the cellular H2O2 by ∼20% specifically in cells expressing mutated FLT3-ITD, and not the wild type FLT3 (Fig. 2B). Similarly, we investigated the nuclear H2O2 level in these cells. 32D cells expressing the FLT-ITD carried increased levels of nuclear H2O2 when compared with the FLT3-WT expressing equivalents (Fig. 2C).
FIGURE 2.
32D stably transfected with FLT3-ITD have higher levels of endogenous H2O2 outside and inside the nucleus than 32Ds transfected with FLT3-WT. The inhibition of FLT3 receptor with PKC412 or NOX protein with DPI, causes a decrease in H2O2 in 32D/FLT3-ITD cells but not in 32D/FLT3-WT cells. The cells were IL-3 starved overnight, followed by ROS probe staining for 1 h before FACS reading. Flow cytometric PO1 analysis of total H2O2 (A and B), NucPE1 analysis of nuclear ROS (C), and MitoSOX analysis of mitochondrial ROS (D) in 32D expressing FLT3-WT or FLT3-ITD. In B, the 32D cells were treated for 24 h with DPI or PKC412 at the indicated concentrations. DMSO, dimethyl sulfoxide. The bar charts show the relative mean fluorescence of treated cells expressed as a percentage of control. The mean is representative of three independent experiments. The asterisk indicates statistically significant difference (p < 0.05) as analyzed by Student's t test. The error bars represent ± S.D.
To examine if mitochondria were responsible for the differences in H2O2 levels in transfected 32Ds, we used MitoSOX, a probe that specifically responds to ROS changes in mitochondria. When we compared the mitochondrial ROS levels in 32D/FLT3-ITD and 32D/FLT3-WT, we saw no significant change between them (Fig. 2D).
FLT3-ITD-expressing Cells Have Higher Levels of DNA Oxidation and DNA DSBs Than Their Wild Type Equivalents
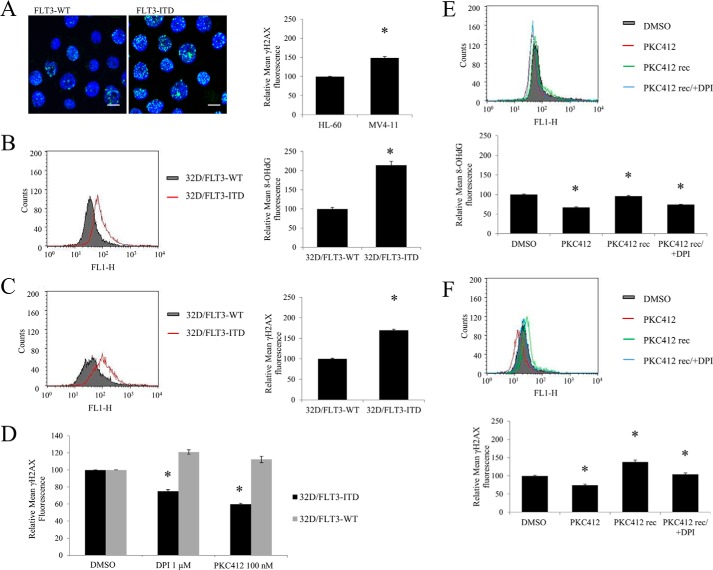
The inhibition on the FLT3-ITD oncogene with PKC412 caused a decrease in DNA damage. Given that both FLT3-ITD and NOX are involved in the H2O2 increase in the nucleus, we investigated if this H2O2 caused DNA damage in the nucleus. First, we investigated the levels of DNA DSBs. γ-H2AX has been used repeatedly as a marker of DNA DSBs. We examined γ-H2AX levels in patient-derived cell lines carrying FLT3-WT (HL-60) or FLT3-ITD (MV4-11). We show here that MV4-11 cells possess about 50% more DNA DSBs than HL-60 (Fig. 3A).
FIGURE 3.
FLT3-ITD-expressing cells have increased levels of DNA oxidation and DNA double strand breaks than their wild type equivalents. The inhibition on FLT3-ITD or NOX causes a decrease in DNA damage. 32D cells were IL-3 starved overnight, followed by fixation, and γ-H2AX or 8-OHdG immunofluorescence, described in detail under “Experimental Procedures.” The analysis of the immunofluorescence was performed using confocal microscope in A or FACS in B-F. In A, the levels of DNA double strand breaks were determined in patient-derived cell lines carrying FLT3-WT (HL-60) or FLT3-ITD (MV-411) using γ-H2AX immunofluorescence. The image is a representative of FACS analysis (presented on the bar chart). The scale bar represents 10 μm. The levels of DNA oxidation as determined by 8-OHdG marker (in B) and DNA double strand breaks, using γH2AX (in C and D) were determined in the 32D cell line stably transfected with FLT3-ITD or FLT3-WT. The flow cytometric histograms show overlaid mean fluorescence of 32D/FLT3-WT cells (gray) and 32D/FLT3-ITD cells (red). In D, the 32D cells were treated for 24 h with DPI or PKC412 at the indicated concentrations. The quantified results of 3 independent experiments are shown on the bar charts on the left. In E and F, MV4-11 cells were treated with 50 nm PKC412 inhibitor for 24 h (red), followed by a PBS wash, and a 16-h recovery in the absence (green) or presence of 1 μm DPI (blue). The levels of 8-OHdG (in D) and γ-H2AX (in E) were then analyzed using flow cytometry. DMSO, dimethyl sulfoxide. The bar chart shows the relative mean 8-OHdG or γ-H2AX fluorescence normalized to the dimethyl sulfoxide-treated control (gray). The error bars represent ± S.D. The asterisk indicates the statistically significant difference (p < 0.05) as analyzed by Student's t test.
For the purpose of pinpointing DNA damage specifically to FLT3-ITD signaling, we again employed 32Ds transfected with wild type and mutated FLT3. We examined the level of oxidized DNA with 8-OHdG as a marker. 32D/FLT3-ITD cells had notably higher levels of oxidized DNA than 32D/FLT3-WT cells (Fig. 3B).
We also compared the levels of DNA DSBs in the transfected 32D cells. Cells transfected with FLT3-ITD had ∼75% more DNA DSBs than cells transfected with FLT3-WT, measured by γ-H2AX, and quantified by flow cytometry (Fig. 3C).
It was shown previously that FLT3 inhibitors reversibly inhibited FLT3 autophosphorylation (30). We investigated if FLT3-ITD-induced DNA damage could be reversed. First, we inhibited FLT3 (PKC412) or NOX (DPI) in 32D/FLT3-ITD and 32D/FLT3-WT cells. These treatments caused 25–40% reduction in DNA damage in cells possessing the mutated FLT3-ITD. The DNA damage in FLT3-WT-possessing 32D cells remained unchanged (Fig. 3D). Second, we treated MV4-11 cells with PKC412 and we noted a significant decrease in DNA oxidation. After removing PKC412 by washing and allowing a recovery period of 24 h from the treatment, the oxidized DNA returned to initial level. However, when DPI was included in the medium during the recovery time, the oxidized DNA did not return to its initial level (Fig. 3E). These results suggested that NOXs plays a role in oxidizing DNA in FLT3-ITD expressing cells.
The same experimental protocol was applied to measure the reversibility of DNA DSBs in FLT3-ITD expressing cells. Similarly to oxidized DNA, PKC412 treatment reduced the level of DNA DSBs. The 24-h recovery period from the drug resulted in the regeneration of DNA DSBs in these cells. However, the increase in the level of DNA DSBs was slightly higher than that in the control. This may be due to the fact that the PKC412 inhibitor may distinctly affect 8-oxoguanine/γ-H2AX generating and repairing pathways. Removal of the FLT3 inhibitor led to an immediate stimulation of the major oncogene signaling pathway in these cells. That may have led to a temporary up-regulation/down-regulation of certain pathways that would result in the increase in the γ-H2AX, e.g. DNA DSB repair. Importantly, when the cells were treated with DPI during the recovery time, restoration of the initial number of DNA DSBs was partially prevented (Fig. 3F). These data suggested that FLT3 and NOX-generated DNA damage could be reversed by inhibiting either of these proteins.
FLT3-ITD-driven p22phox-mediated Nuclear H2O2, DNA Oxidation, and DNA DSBs Generation in FLT3-ITD Expressing Cells
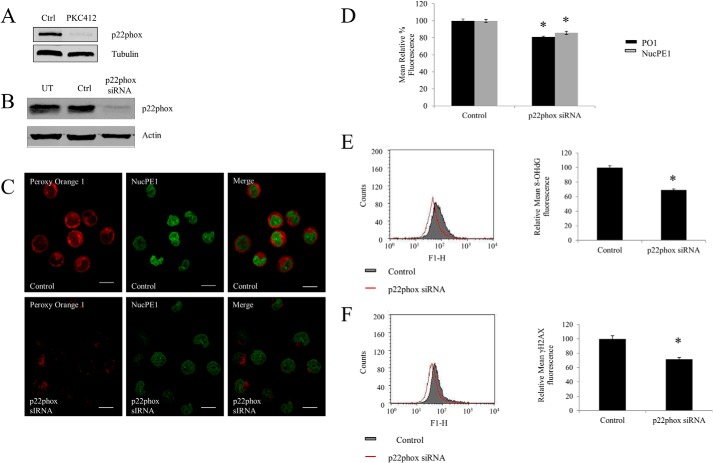
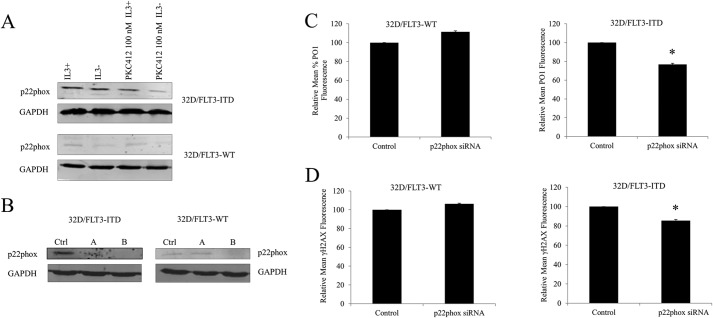
Our group has shown that following the inhibition of FLT3-ITD with PKC412, the small membrane subunit of the NOX complex, p22phox is post-translationally down-regulated (13) (Fig. 4A). It was reported previously that p22phox is an essential component of the NOX complex functioning. Hence, we used specific p22phox siRNA to knock down the protein and study the effects of p22phox down-regulation (Fig. 4B). Using PO1 and NucPE1, we investigated the levels of total and nuclear endogenous H2O2. Knockdown of p22phox resulted in a significant decrease in both total and nuclear H2O2 (Fig. 4C). Quantification of these data using flow cytometry revealed that specific p22phox knockdown resulted in an almost 20% decrease in total and nuclear H2O2 (Fig. 4D).
FIGURE 4.
FLT3-ITD driven p22phox mediates levels of nuclear H2O2, DNA oxidation, and DNA double strand breaks generation in FLT3-ITD expressing cells. A, Western blotting analysis of the decrease in the p22phox protein level after a 50 nm PKC412 treatment for 24 h in MV4-11 cells. B, Western blot analysis of the p22phox protein level at 24 h following the siRNA transfection. β-Actin was used as a loading control. C, confocal images of H2O2 levels following the p22phox siRNA knockdown, using probes PO1 (red) and NucPE1 (green) and their merge images. The scale bar represents 10 μm. D, flow cytometric quantification of PO1 and NucPE1 fluorescence after p22phox knockdown. E and F, flow cytometric analysis of immunofluorescence of 8-OHdG (E) and γ-H2AX (F) markers of DNA oxidation and DNA double strand breaks, respectively, in cells transfected with negative siRNA control versus cells transfected with p22phox siRNA. The bar charts show the relative mean fluorescence of p22phox siRNA-transfected cells (red) expressed as a percentage of control (gray). The mean is representative of three independent experiments. The asterisk indicates statistically significant difference (p < 0.05) as analyzed by Student's t test. The error bars represent ± S.D.
To verify if the p22phox-generated H2O2 in the nucleus caused DNA damage, we utilized similar markers, 8-OHdG and γ-H2AX. The p22phox down-regulation caused a notable decrease in the level of oxidized DNA (Fig. 4E) and DNA DSBs (Fig. 4F). These data suggested that p22phox mediates the FLT3-ITD-stimulated DNA damage.
NOX4-generated ROS Caused DNA DSBs in FLT3-ITD Expressing Cells
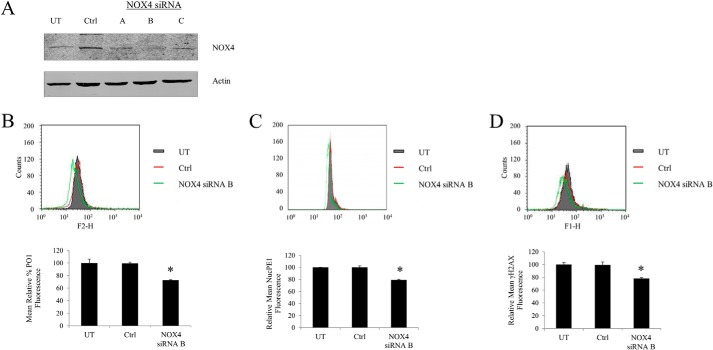
We have shown in Woolley et al. (13) that p22phox-mediated ROS generation in MV4-11 takes place in the endoplasmic reticulum (ER). To date the only NOX isoform reported in the ER is NOX4. Hence, we knocked down NOX4 to determine whether NOX4 was the isoform that plays a role in generating H2O2 in MV4-11. The down-regulation of the NOX4 expression resulted in ∼30% reduction of total cellular H2O2 in these cells and 20% reduction of nuclear H2O2, as measured by PO1 and NucPE1, respectively (Fig. 5, A and B). Furthermore, the drop in H2O2 was accompanied by the decrease in the γ-H2AX fluorescence, which corresponds to the number of DNA DSBs (Fig. 5C).
FIGURE 5.
NOX4-generated ROS cause DNA double stranded breaks in FLT3-ITD expressing cells. MV4-11 cells transiently transfected with NOX4 siRNA (3 different oligomers A–C) or negative siRNA control (Ctrl) using nucleoporation that resulted in the decrease in NOX4 protein level. A, Western blot analysis of the Nox4 protein level at 24 h following the siRNA transfection. β-Actin was used as a loading control. B, flow cytometric analysis of H2O2 levels following the NOX4 siRNA knockdown, using PO1 probe (green), compared with negative siRNA control (Ctrl; red) and untreated cells (UT; gray). C, flow cytometric analysis of nuclear H2O2 levels following the NOX4 siRNA knockdown, using NucPE1 probe (green), compared with negative siRNA control (Ctrl; red) and untreated cells (UT; gray). D, flow cytometric analysis of γ-H2AX immunofluorescence, in untreated cells (UT; gray) or cells transfected with negative siRNA control (Ctrl, red) versus cells transfected with NOX4 siRNA (green). The bar charts show relative mean fluorescence of NOX4 siRNA-transfected cells (red) expressed as a percentage of control (gray). The mean is representative of three independent experiments. The asterisk indicates a statistically significant difference (p < 0.05) as analyzed by Student's t test. The error bars represent ± S.D.
NOX4 and p22phox Colocalized to the Nuclear Membrane in MV4-11
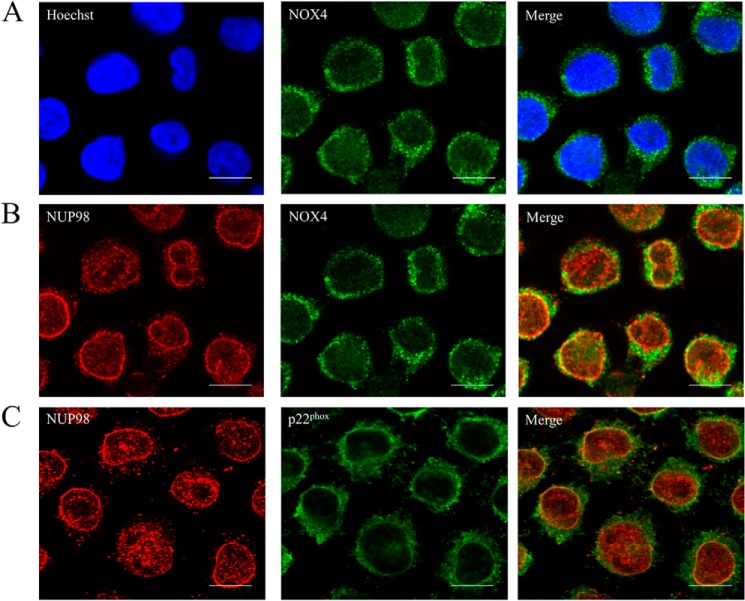
Given that NOX4 knockdown caused a decrease in both H2O2 and DNA damage, we investigated if NOX4 localizes to the nucleus as previously shown in the literature in other cell types (31–33). We observed no clear NOX4 foci in the nucleus (Fig. 6A) and investigated if NOX4 colocalizes to the nuclear membrane, using NUP98 (nucleoporin) antibody (Fig. 6B). We saw that the most inner NOX4 foci colocalize to NUP98. Following that, we also confirmed that p22phox similarly colocalizes to NUP98.
FIGURE 6.
NOX4 and p22phox colocalizes to the nuclear membrane in MV4-11. Cells were incubated on poly-d-lysine-coated coverslips for 16 h. The cells were then fixed in 3% PFA/PBS and followed by NOX4, NUP98, and p22phox and Hoeschst staining. Images were acquired using confocal microscope. Brightness and contrast were adjusted. The scale bar represents 10 μm.
p22phox Knockdown Caused a Decrease in DNA DSBs in 32D Cells Transfected with FLT3-ITD, but Not with FLT3-WT
To study the effects downstream of p22phox in the 32D cell line in relationship to ITD/WT FLT3, first, we examined the protein levels of p22phox in these cells in the presence/absence of IL-3 and PKC412 (Fig. 7A). Western blotting analysis of p22phox revealed that the cells transfected with FLT3-ITD possessed a higher level of p22phox than their wild type counterparts. Similarly to MV4-11 cells, the inhibition of FLT3 receptor with PKC412 over 24 h caused a partial decrease in p22phox expression. IL-3 starvation resulted in a slight down-regulation of p22phox. This is not surprising as IL-3 has been shown to activate the AKT pathway, which in turn has been implicated in stimulating p22phox expression (34, 35).
FIGURE 7.
p22phox-generated H2O2 causes DNA double strand breaks in 32D cells transfected with FLT3-ITD and not with FLT3-WT. A, Western blotting analysis of p22phox expression in 32D/FLT3-ITD and 32D/FLT3-WT in the presence/absence of IL-3 and following the PKC412 treatment (100 nm). B, Western blot analysis of the p22phox protein level at 24 h following the siRNA transfection. Ctrl refers to scrambled siRNA-treated control, A and B refer to different predesigned siRNA sequences. GAPDH was used as a loading control. C, flow cytometric analysis of cellular H2O2, measured with PO1 probe in 32D/FLT3-ITD and 32D/FLT3-WT at 24 h following the siRNA transfection. D, flow cytometric analysis of DNA DSBs, measured with γ-H2AX in 32D/FLT3-ITD and 32D/FLT3-WT at the 24 h following the p22phox siRNA transfection as indicated in the legend. The bar charts show the relative mean fluorescence of siRNA-transfected cells expressed as a percentage of control. The mean is representative of three independent experiments. The asterisk indicates a statistically significant difference (p < 0.05) as analyzed by Student's t test. The error bars represent ± S.D.
Specific p22phox siRNA knockdown in 32D cells (Fig. 7B) have allowed us to investigate the effects of the p22phox-dependent NOX complex in cells expressing wild type or mutant FLT3. Flow cytometric analysis of endogenous cellular H2O2, measured by PO1, showed that p22phox knockdown caused an ∼20% decrease in cellular H2O2, specifically in 32D cells expressing FLT3-ITD. These knockdowns did not reveal any statistically significant changes in 32D cells expressing FLT3-WT (Fig. 7C). To study the downstream effects of this p22phox-generated H2O2, we examined the levels of DNA DSBs, using flow cytometric analysis of γH2AX fluorescence. Similarly, the siRNA knockdown of p22phox proteins resulted in a reduction in the number of DNA DSBs in 32Ds transfected with constitutively active FLT3-ITD (Fig. 7D).
Knockdowns of p22phox-dependent NOX Isoforms (NOX1, -2, and -4) Caused a Decrease in Endogenous H2O2 and DNA Damage in 32D/FLT3-ITD Expressing Cells
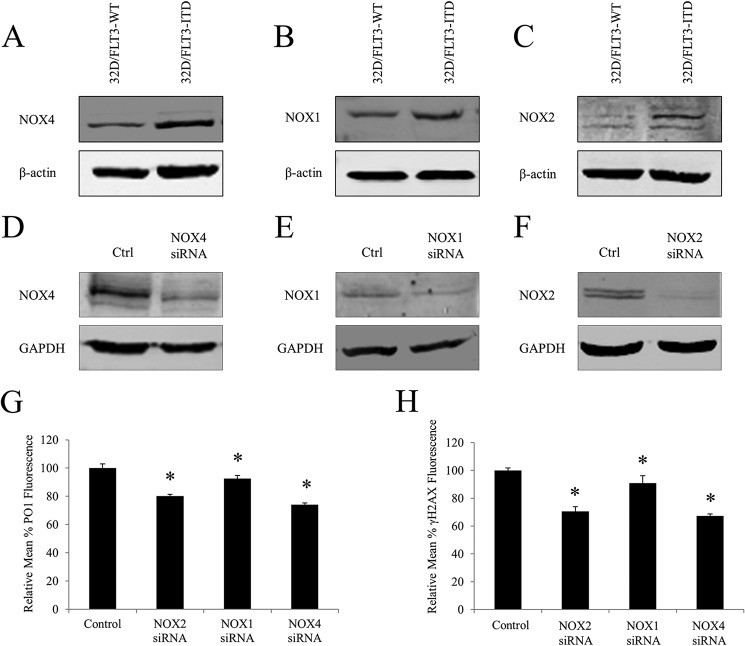
Human FLT3-possessing myeloid cells have been previously shown to express NOX2, -4, and -5 (27). However, their murine counterparts have only been shown to express NOX1, -2, and -4 as they do not possess the NOX5 gene (27). We therefore compared the protein levels of these NOX isoforms in 32D/FLT3-WT and 32D/FLT3-ITD cells. Western blotting analysis revealed that FLT3-ITD-expressing cells possess increased protein levels of NOX1, NOX2, and NOX4 in comparison to their wild type counterparts (Fig. 8, A–C).
FIGURE 8.
Knockdowns of p22phox-dependent NOX isoforms (NOX1, -2, and -4) cause a decrease in endogenous H2O2 and DNA damage in 32D/FLT3-ITD expressing cells. In A-C, Western blot analysis of the NOX4 (A), NOX1 (B), and NOX2 (C) proteins levels in 32D/FLT3-WT and 32D/FLT3-ITD cells. β-Actin was used as a loading control. D–F, at 24 h, Western blot analysis of the NOX4 (D), NOX1 (E), and NOX2 (F) proteins levels following the siRNA transfection. GAPDH was used as a loading control. G, flow cytometric analysis of H2O2 levels following the NOX siRNA knockdowns, using PO1 probe, compared with negative siRNA control (control). H, flow cytometric analysis of γ-H2AX levels following the NOX siRNA knockdowns, compared with negative siRNA control (control). The mean is representative of three independent experiments. The asterisk indicates a statistically significant difference (p < 0.05) as analyzed by Student's t test. The error bars represent ± S.D.
Following this observation we targeted these isoforms for siRNA transfection. Specific knockdowns of NOX1, -2, and -4 proteins were confirmed using Western blotting (Fig. 8, D–F).
Down-regulation of NOX2 or NOX4 protein caused ∼20% decrease in the endogenous H2O2 and a robust 30% decrease in DNA damage (Fig. 8, G and H). Conversely, NOX1 knockdown resulted only in a marginal decrease in both H2O2 and DNA damage (Fig. 8, G and H). Interestingly, the change in DNA damage following the NOX2 or NOX4 knockdowns was greater than that observed for p22phox (Fig. 8, G and H).
Stimulation of FLT3-WT with FLT3 Ligand (FL) Causes an Increase in p22phox Protein Level, Followed by an Accumulation of Nuclear and Cellular H2O2 and in Turn an Increase in the Number of DNA DSBs
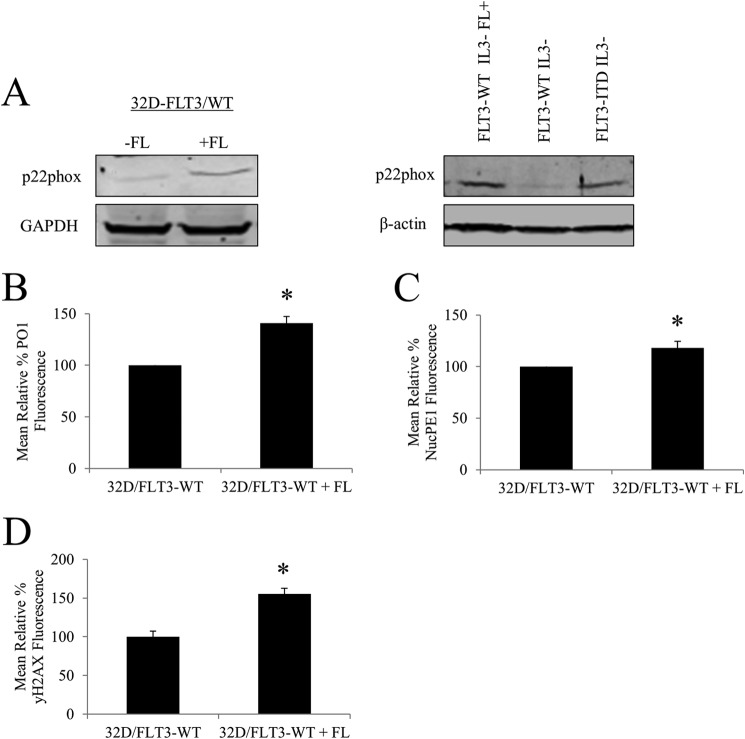
FLT3-ITD has been reported to induce differential signaling events than activated FLT3-WT. For example, in contrast to stimulated FLT3-WT, FLT3-ITD causes a strong activation of STAT5 (9). This may be a result of the distinct subcellular localizations of the two (9). Given that constitutively active FLT3-ITD stimulates generation of ROS and DNA damage, we investigated if the activated FLT3-WT had a similar effect. Following a 16-h incubation of the FL with 32D cells transfected with FLT3-WT, we observed an increase in p22phox expression (Fig. 9A). The FL-stimulated increase in p22phox level was similar to that induced by FLT3-ITD (Fig. 9A). Importantly, this change in p22phox levels was followed by the 44% increase in the generation of H2O2, as measured by PO1 and about 20% increase in the generation of nuclear, as measured by NucPE1 (Fig. 9, B and C). Similarly to mutated FLT3, activated wild type FLT3 possessed about 50% higher number of DNA DSBs (Fig. 9D).
FIGURE 9.
Stimulation of FLT3-WT with FL causes an increase in p22phox expression, increase in nuclear and cellular H2O2, and in turn an increase in the number of DNA DSBs. A, Western blotting analysis of expression of p22phox following FLT3-WT stimulation with FL for 16 h. Western blotting analysis of p22phox protein levels of 32D/FLT3-WT cells compared with 32D/FLT3-ITD cells. GAPDH or β-actin was used as a loading control. B, flow cytometric analysis of total cellular H2O2 as measured with PO1, and C, nuclear H2O2, as measured with NucPE1. D, flow cytometric analysis of DNA, measured with γ-H2AX following the 16-h treatment with FL. The bar charts show relative mean fluorescence of cells treated expressed as a percentage of control. The mean is representative of three independent experiments. The asterisk indicates a statistically significant difference (p < 0.05) as analyzed by Student's t test. The error bars represent ±S.D.
DISCUSSION
The FLT3-ITD oncogene is associated with an aggressive progression of AML (2). It is well established that the disease advances as the cancer cells become genomically unstable (16). Prior work has documented ROS contribution to leukemic phenotypes (extensively reviewed in Ref. 14). However, there has been little evidence of the mechanism of FLT3-ITD-stimulated ROS-driven genomic instability. FLT3-ITD was previously associated with increased ROS and DNA damage (11). However, the cellular source of DNA-damaging ROS in FLT3-ITD remains elusive.
In this study, we explored how FLT3-ITD stimulates H2O2 production to cause DNA damage. We found that the NOX-p22phox complex generates H2O2 that causes DNA damage in the nuclei of FLT3-ITD-expressing cells. Importantly, to our knowledge, this is a first study that finds NOX to play a role in genomic instability in leukemia.
NOX-originated ROS have been documented to have multiple effects on leukemia cell proliferation and survival (13, 19, 27). Leukemic oncogenes have been shown to regulate either the expression of NOX components or the availability of their substrate. For example, overexpression of H-RAS has been shown to increase NOX4 expression (36). Interestingly, cells expressing FLT3-ITD have been reported to possess an increased concentration of NADPH (27). Our group also showed that inhibition of FLT3-ITD in MV4-11 cells leads to the degradation of p22phox, a small membrane subunit of the NOX complex (13). In this report we demonstrate that 32D cells transfected with FLT3-ITD possess higher steady levels of p22phox than their wild type counterparts. Furthermore, 32D/FLT3-ITD cells exhibit higher NOX1, -2, and -4 protein levels than 32D cells expressing FLT3-WT.
To date, NOX proteins were shown to regulate the growth and migration of FLT3-ITD expressing cells (9). However, the authors did not report any significant changes in total ROS following the NOX4 knockdown, measured by 2′,7′-dichlorodihydrofluorescein diacetate (27). Although here, using a newly developed, specific H2O2 probe, PO1, we show that NOX1, -2, and -4 knockdowns result in the decrease in the endogenous H2O2. We show that NOX2/4 siRNA knockdown causes a significant decrease in DNA DSBs. This indicates a novel NOX function in causing DNA damage in FLT3-ITD oncogene-driven AML.
Similar to what we observe in FLT3-ITD expressing cells, H-RAS-induced increased NOX4 expression is accompanied by an increase in the nuclear H2O2 and DNA DSBs (36). We suggest that a similar mechanism operates in FLT3-ITD-expressing cells where increased levels of NOX proteins generate an ROS burst that causes DNA damage.
Apart from oncogene-regulated NOX4-stimulated oxidative DNA damage, NOX4 was shown to specifically play a role in the nucleus. For instance, in cardiomyocytes, NOX4-produced H2O2 was also observed to specifically oxidize nuclear proteins, e.g. histone deacetylase (33). Also, NOX4, localized in the perinuclear space was also the source of nuclear superoxide generation in hepatocytes (38). Interestingly, exposure of mice to ionizing radiation increased the expression of NOX4 in hematopoietic stem cells (10, 39). The inhibition of NOX in the ionizing radiation-treated mice, attenuated the ROS and DNA damage associated with the ionizing radiation (40).
NOX4 localization is still controversial. Up to now, NOX4 have been localized to mitochondria (41, 42), nucleus (31–33), ER (43–46), and plasma membrane (45). Here for the first time, we localize NOX4 expression in FLT3-ITD expressing cells. NOX4 immunofluorescence did not reveal any NOX4 foci in the nucleus. However, the most inner NOX4 foci colocalized to NUP98 antibody (nuclear membrane) (Fig. 6B). Similarly, NOX4 was proposed to localize to the nuclear membrane in alveolar epithelial cell A549 (47). We have also shown that p22phox localizes to the nuclear membrane (Fig. 6C), which is consistent with p22phox co-localization to A/C lamin in the H-RAS-expressing cells (36). Therefore, we postulate that NOX4/p22phox-derived H2O2 diffuses from the nuclear membrane to the nucleus in these cells.
Our group has shown that inhibition of FLT3-ITD results in a post-translational down-regulation of p22phox (13). Here we show for the first time that the stimulation of FLT3-WT with FL results in an up-regulation of p22phox, an increase in total and nuclear H2O2 as well as DNA DSBs. It has been reported that FLT3 inhibitors were demonstrated to induce expression and release of FL (48). We suggest that the presence of FL in the bone marrow could lead to genomic instability through ROS generation.
We showed previously that p22phox resides in the ER in FLT3-ITD where it regulates H2O2 generation, which affects phosphorylation of STAT5 (13). Consistently with the earlier report, we show here that not only does p22phox-regulate H2O2 in the FLT3-ITD system but it also affects the H2O2 level in the nucleus. We postulate that NOX proteins associated with p22phox are essential for generation of H2O2 that diffuses to the nucleus.
Additionally, p22phox knockdown results in a decrease in oxidized DNA and DNA DSBs in FLT3-ITD expressing cells. This result is consistent with effects of p22phox on DNA damage seen in H-RAS-transfected cells, where the knockdown of p22phox resulted in a decrease in DNA DSBs (36). Together these data suggest that NOX-produced H2O2 is directly responsible for causing DNA damage in the nucleus. This finding substantially expands the role of NOX in FLT3-ITD AML.
FLT3-ITD-stimulated ROS generation was demonstrated in several papers (11, 13). However, we show for the first time, using confocal microscopy that FLT3-ITD directly affects nuclear H2O2, as measured by NucPE1. Furthermore, inhibition of FLT3-ITD or NOX causes a dramatic decrease in the level of nuclear H2O2.
Although FLT3 seems an attractive target in AML, the resistance arising to FLT3 inhibitors still remains a significant problem (5, 8, 49). Resistance to FLT3 inhibitors was demonstrated to be associated with mutations within the FLT3 gene (8, 50, 51). Therefore, it is of interest to study the mechanisms that lead to mutagenesis. 8-OHdG is one of the most persistent and mutagenic type of lesions. It was shown recently that patients in AML relapse possessed higher levels of 8-OHdG (52). We show here that FLT3-ITD is not only associated with increased levels of DNA DSBs, but also increased levels of 8-OHdG. Increased levels of 8-OHdG was shown to play a role in self-mutagenesis of BCR/ABL that led to imatinib resistance (53). We suggest that a similar mechanism can operate in FLT3-ITD. What is more, DNA DSBs were documented to arise from oxidative DNA damage in the S/G2M phase in BCR/ABL cells (54). Repair of 8-OHdG results in a removal of the oxidized base that produces a single strand break (55). When the latter one is encountered by the replication fork, it can result in a DSB (37). We suggest that a similar phenomenon may be occurring in the FLT3-ITD AML.
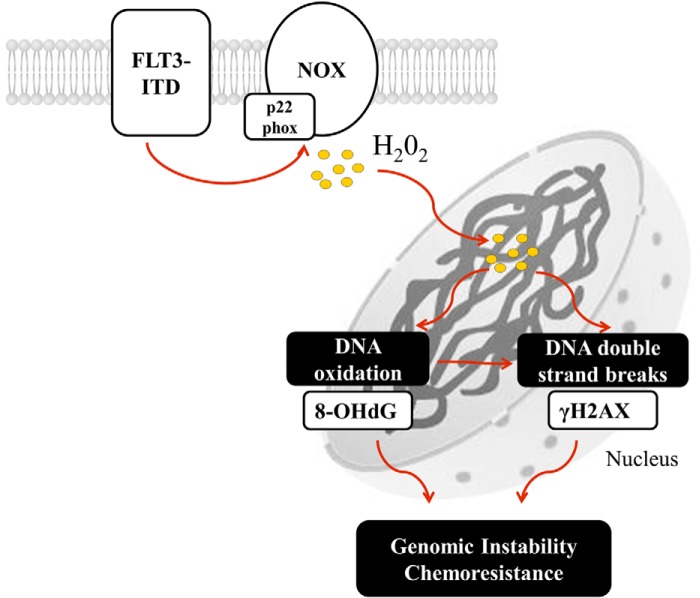
In conclusion, we suggest that NOX-p22phox complex generates H2O2 at the membrane in FLT3-ITD expressing cells (Fig. 10). This H2O2 diffuses into the nucleus where it causes oxidation of DNA and DNA DSBs. FLT3-ITD increases the levels of H2O2 through increases in both NOX and p22phox protein levels. We speculate that NOX may be an attractive therapeutic target in FLT3-ITD-mutated AML cells, as NOX inhibition can decrease the level of genomic instability.
FIGURE 10.
A schematic of the proposed mechanism of FLT3-ITD-driven NOX-generated DNA damage in AML. FLT3-ITD maintains the expression of p22phox and NOX proteins that generate H2O2 that diffuses to the nucleus where it causes DNA oxidation and DNA DSBs. This process may lead to genomic instability and chemoresistance.
This work was supported by Irish Cancer Society Research Scholarship Award CRS11STA.
- FLT3
- FMS-like tyrosine kinase 3
- FLT3-ITD
- FLT3 with internal tandem duplication
- AML
- acute myeloid leukemia
- ROS
- reactive oxygen species
- DSBs
- double strand breaks
- NOX
- NADPH oxidase
- PO1
- peroxy orange 1
- NucPE1
- nuclear peroxy emerald 1
- FLT3-WT
- wild type FLT3
- DPI
- diphenyleneiodonium
- ER
- endoplasmic reticulum
- 8-OHdG
- 8-hydroxyguanosine
- FL
- FLT3 ligand
- γ-H2AX
- phosphorylated H2AX histone.
REFERENCES
- 1. Stirewalt D. L., Radich J. P. (2003) The role of FLT3 in haematopoietic malignancies. Nat. Rev. Cancer 3, 650–665 [DOI] [PubMed] [Google Scholar]
- 2. Gilliland D. G., Griffin J. D. (2002) Role of FLT3 in leukemia. Curr. Opin. Hematol. 9, 274–281 [DOI] [PubMed] [Google Scholar]
- 3. Nakao M., Yokota S., Iwai T., Kaneko H., Horiike S., Kashima K., Sonoda Y., Fujimoto T., Misawa S. (1996) Internal tandem duplication of the flt3 gene found in acute myeloid leukemia. Leukemia 10, 1911–1918 [PubMed] [Google Scholar]
- 4. Thiede C., Steudel C., Mohr B., Schaich M., Schäkel U., Platzbecker U., Wermke M., Bornhäuser M., Ritter M., Neubauer A., Ehninger G., Illmer T. (2002) Analysis of FLT3-activating mutations in 979 patients with acute myelogenous leukemia: association with FAB subtypes and identification of subgroups with poor prognosis. Blood 99, 4326–4335 [DOI] [PubMed] [Google Scholar]
- 5. Smith C. C., Wang Q., Chin C.-S., Salerno S., Damon L. E., Levis M. J., Perl A. E., Travers K. J., Wang S., Hunt J. P., Zarrinkar P. P., Schadt E. E., Kasarskis A., Kuriyan J., Shah N. P. (2012) Validation of ITD mutations in FLT3 as a therapeutic target in human acute myeloid leukaemia. Nature 485, 260–263 [DOI] [PMC free article] [PubMed] [Google Scholar]
- 6. Kiyoi H., Towatari M., Yokota S., Hamaguchi M., Ohno R., Saito H., Naoe T. (1998) Internal tandem duplication of the FLT3 gene is a novel modality of elongation mutation which causes constitutive activation of the product. Leukemia 12, 1333–1337 [DOI] [PubMed] [Google Scholar]
- 7. Hayakawa F., Towatari M., Kiyoi H., Tanimoto M., Kitamura T., Saito H., Naoe T. (2000) Tandem-duplicated Flt3 constitutively activates STAT5 and MAP kinase and introduces autonomous cell growth in IL-3-dependent cell lines. Oncogene 19, 624–631 [DOI] [PubMed] [Google Scholar]
- 8. Mizuki M., Fenski R., Halfter H., Matsumura I., Schmidt R., Müller C., Grüning W., Kratz-Albers K., Serve S., Steur C., Büchner T., Kienast J., Kanakura Y., Berdel W. E., Serve H. (2000) Flt3 mutations from patients with acute myeloid leukemia induce transformation of 32D cells mediated by the Ras and STAT5 pathways. Blood 96, 3907–3914 [PubMed] [Google Scholar]
- 9. Choudhary C., Olsen J. V., Brandts C., Cox J., Reddy P. N., Böhmer F. D., Gerke V., Schmidt-Arras D. E., Berdel W. E., Müller-Tidow C., Mann M., Serve H. (2009) Mislocalized activation of oncogenic RTKs switches downstream signaling outcomes. Molecular cell 36, 326–339 [DOI] [PubMed] [Google Scholar]
- 10. Brandts C. H., Sargin B., Rode M., Biermann C., Lindtner B., Schwäble J., Buerger H., Müller-Tidow C., Choudhary C., McMahon M., Berdel W. E., Serve H. (2005) Constitutive activation of Akt by Flt3 internal tandem duplications is necessary for increased survival, proliferation, and myeloid transformation. Cancer Res. 65, 9643–9650 [DOI] [PubMed] [Google Scholar]
- 11. Sallmyr A., Fan J., Datta K., Kim K.-T., Grosu D., Shapiro P., Small D., Rassool F. (2008) Internal tandem duplication of FLT3 (FLT3/ITD) induces increased ROS production, DNA damage, and misrepair: implications for poor prognosis in AML. Blood 111, 3173–3182 [DOI] [PubMed] [Google Scholar]
- 12. Godfrey R., Arora D., Bauer R., Stopp S., Müller J. P., Heinrich T., Böhmer S. A., Dagnell M., Schnetzke U., Scholl S., Östman A., Böhmer F. D. (2012) Cell transformation by FLT3 ITD in acute myeloid leukemia involves oxidative inactivation of the tumor suppressor protein-tyrosine phosphatase DEP-1/ PTPRJ. Blood 119, 4499–4511 [DOI] [PubMed] [Google Scholar]
- 13. Woolley J. F., Naughton R., Stanicka J., Gough D. R., Bhatt L., Dickinson B. C., Chang C. J., Cotter T. G. (2012) H2O2 production downstream of FLT3 is mediated by p22phox in the endoplasmic reticulum and is required for STAT5 signalling. PloS One 7, e34050. [DOI] [PMC free article] [PubMed] [Google Scholar]
- 14. Irwin M. E., Rivera-Del Valle N., Chandra J. (2013) Redox control of leukemia: from molecular mechanisms to therapeutic opportunities. Antioxid. Redox Signal. 18, 1349–1383 [DOI] [PMC free article] [PubMed] [Google Scholar]
- 15. Hole P. S., Darley R. L., Tonks A. (2011) Do reactive oxygen species play a role in myeloid leukemias? Blood 117, 5816–5826 [DOI] [PubMed] [Google Scholar]
- 16. Sieber O. M., Heinimann K., Tomlinson I. P. (2003) Genomic instability: the engine of tumorigenesis? Nat. Rev. Cancer 3, 701–708 [DOI] [PubMed] [Google Scholar]
- 17. Loeb L. A., Loeb K. R., Anderson J. P. (2003) Multiple mutations and cancer. Proc. Natl. Acad. Sci. U.S.A. 100, 776–781 [DOI] [PMC free article] [PubMed] [Google Scholar]
- 18. Sallmyr A., Fan J., Rassool F. V. (2008) Genomic instability in myeloid malignancies: increased reactive oxygen species (ROS), DNA double strand breaks (DSBs) and error-prone repair. Cancer Lett. 270, 1–9 [DOI] [PubMed] [Google Scholar]
- 19. Naughton R., Quiney C., Turner S. D., Cotter T. G. (2009) Bcr-Abl-mediated redox regulation of the PI3K/AKT pathway. Leukemia 23, 1432–1440 [DOI] [PubMed] [Google Scholar]
- 20. Rassool F. V., Gaymes T. J., Omidvar N., Brady N., Beurlet S., Pla M., Reboul M., Lea N., Chomienne C., Thomas N. S., Mufti G. J., Padua R. A. (2007) Reactive oxygen species, DNA damage, and error-prone repair: a model for genomic instability with progression in myeloid leukemia? Cancer Res. 67, 8762–8771 [DOI] [PubMed] [Google Scholar]
- 21. Landry W. D., Woolley J. F., Cotter T. G. (2013) Imatinib and Nilotinib inhibit Bcr-Abl-induced ROS through targeted degradation of the NADPH oxidase subunit p22phox. Leuk. Res. 37, 183–189 [DOI] [PubMed] [Google Scholar]
- 22. Fan J., Li L., Small D., Rassool F. (2010) Cells expressing FLT3/ITD mutations exhibit elevated repair errors generated through alternative NHEJ pathways: implications for genomic instability and therapy. Blood 116, 5298–5305 [DOI] [PMC free article] [PubMed] [Google Scholar]
- 23. Seedhouse C. H., Hunter H. M., Lloyd-Lewis B., Massip A.-M., Pallis M., Carter G. I., Grundy M., Shang S., Russell N. H. (2006) DNA repair contributes to the drug-resistant phenotype of primary acute myeloid leukaemia cells with FLT3 internal tandem duplications and is reversed by the FLT3 inhibitor PKC412. Leukemia 20, 2130–2136 [DOI] [PubMed] [Google Scholar]
- 24. Bedard K., Krause K. H. (2007) The NOX family of ROS-generating NADPH oxidases: physiology and pathophysiology. Physiol. Rev. 87, 245–313 [DOI] [PubMed] [Google Scholar]
- 25. Block K., Gorin Y. (2012) Aiding and abetting roles of NOX oxidases in cellular transformation. Nat. Rev. Cancer 12, 627–637 [DOI] [PMC free article] [PubMed] [Google Scholar]
- 26. Weyemi U., Dupuy C. (2012) The emerging role of ROS-generating NADPH oxidase NOX4 in DNA-damage responses. Mutat. Res. 751, 77–81 [DOI] [PubMed] [Google Scholar]
- 27. Reddy M. M., Fernandes M. S., Salgia R., Levine R. L., Griffin J. D., Sattler M. (2011) NADPH oxidases regulate cell growth and migration in myeloid cells transformed by oncogenic tyrosine kinases. Leukemia 25, 281–289 [DOI] [PMC free article] [PubMed] [Google Scholar]
- 28. Moiseeva O., Bourdeau V., Roux A., Deschênes-Simard X., Ferbeyre G. (2009) Mitochondrial dysfunction contributes to oncogene-induced senescence. Mol. Cell. Biol. 29, 4495–4507 [DOI] [PMC free article] [PubMed] [Google Scholar]
- 29. Dickinson B. C., Tang Y., Chang Z., Chang C. J. (2011) Brief communication a nuclear-localized fluorescent hydrogen peroxide probe for monitoring sirtuin-mediated oxidative stress responses in vivo. Chem. Biol. 18, 943–948 [DOI] [PMC free article] [PubMed] [Google Scholar]
- 30. Kim K.-T., Baird K., Ahn J.-Y., Meltzer P., Lilly M., Levis M., Small D. (2005) Pim-1 is up-regulated by constitutively activated FLT3 and plays a role in FLT3-mediated cell survival. Blood 105, 1759–1767 [DOI] [PubMed] [Google Scholar]
- 31. Anilkumar N., San Jose G., Sawyer I., Santos C. X., Sand C., Brewer A. C., Warren D., Shah A. M. (2013) A 28-kDa splice variant of NADPH oxidase-4 is nuclear-localized and involved in redox signaling in vascular cells. Arterioscler. Thromb. Vasc. Biol. 33, e104–e112 [DOI] [PubMed] [Google Scholar]
- 32. Kuroda J., Nakagawa K., Yamasaki T., Nakamura K.-i., Takeya R., Kuribayashi F., Imajoh-Ohmi S., Igarashi K., Shibata Y., Sueishi K., Sumimoto H. (2005) The superoxide-producing NAD(P)H oxidase Nox4 in the nucleus of human vascular endothelial cells. Genes Cells 10, 1139–1151 [DOI] [PubMed] [Google Scholar]
- 33. Matsushima S., Kuroda J., Ago T., Zhai P., Park J. Y., Xie L.-H., Tian B., Sadoshima J. (2013) Increased oxidative stress in the nucleus caused by Nox4 mediates oxidation of HDAC4 and cardiac hypertrophy. Circ. Res. 112, 651–663 [DOI] [PMC free article] [PubMed] [Google Scholar]
- 34. Songyang Z., Baltimore D., Cantley L. C., Kaplan D. R., Franke T. F. (1997) Interleukin 3-dependent survival by the Akt protein kinase. Proc. Natl. Acad. Sci. U.S.A. 94, 11345–11350 [DOI] [PMC free article] [PubMed] [Google Scholar]
- 35. Edderkaoui M., Nitsche C., Zheng L., Pandol S. J., Gukovsky I., Gukovskaya A. S. (2011) NADPH oxidase activation in pancreatic cancer cells is mediated through Akt-dependent up-regulation of p22phox. J. Biol. Chem. 286, 7779–7787 [DOI] [PMC free article] [PubMed] [Google Scholar]
- 36. Weyemi U., Lagente-Chevallier O., Boufraqech M., Prenois F., Courtin F., Caillou B., Talbot M., Dardalhon M., Al Ghuzlan A., Bidart J.-M., Schlumberger M., Dupuy C. (2012) ROS-generating NADPH oxidase NOX4 is a critical mediator in oncogenic H-Ras-induced DNA damage and subsequent senescence. Oncogene 31, 1117–1129 [DOI] [PMC free article] [PubMed] [Google Scholar]
- 37. Lu A. L., Li X., Gu Y., Wright P. M., Chang D. Y. (2001) Repair of oxidative DNA damage: mechanisms and functions. Cell Biochem. Biophys. 35, 141–170 [DOI] [PubMed] [Google Scholar]
- 38. Spencer N. Y., Yan Z., Boudreau R. L., Zhang Y., Luo M., Li Q., Tian X., Shah A. M., Davisson R. L., Davidson B., Banfi B., Engelhardt J. F. (2011) Control of hepatic nuclear superoxide production by glucose-6-phosphate dehydrogenase and NADPH oxidase-4. J. Biol. Chem. 286, 8977–8987 [DOI] [PMC free article] [PubMed] [Google Scholar]
- 39. Wang Y., Liu L., Pazhanisamy S. K., Li H., Meng A., Zhou D. (2010) Total body irradiation causes residual bone marrow injury by induction of persistent oxidative stress in murine hematopoietic stem cells. Free Radic. Biol. Med. 48, 348–356 [DOI] [PMC free article] [PubMed] [Google Scholar]
- 40. Pazhanisamy S. K., Li H., Wang Y., Batinic-Haberle I., Zhou D. (2011) NADPH oxidase inhibition attenuates total body irradiation-induced haematopoietic genomic instability. Mutagenesis 26, 431–435 [DOI] [PMC free article] [PubMed] [Google Scholar]
- 41. Block K., Gorin Y., Abboud H. E. (2009) Subcellular localization of Nox4 and regulation in diabetes. Proc. Natl. Acad. Sci. U.S.A. 106, 14385–14390 [DOI] [PMC free article] [PubMed] [Google Scholar]
- 42. Case A. J., Li S., Basu U., Tian J., Zimmerman M. C. (2013) Mitochondrial-localized NADPH oxidase 4 is a source of superoxide in angiotensin II-stimulated neurons. Am. J. Physiol. Heart Circ. Physiol. 305, 19–28 [DOI] [PMC free article] [PubMed] [Google Scholar]
- 43. Chen K., Kirber M. T., Xiao H., Yang Y., Keaney J. F. (2008) Regulation of ROS signal transduction by NADPH oxidase 4 localization. J. Cell Biol. 181, 1129–1139 [DOI] [PMC free article] [PubMed] [Google Scholar]
- 44. Helmcke I., Heumüller S., Tikkanen R., Schröder K., Brandes R. P. (2009) Identification of structural elements in Nox1 and Nox4 controlling localization and activity. Antioxid. Redox Signal. 11, 1279–1287 [DOI] [PubMed] [Google Scholar]
- 45. Zhang L., Nguyen M. V., Lardy B., Jesaitis A. J., Grichine A., Rousset F., Talbot M., Paclet M.-H., Qian G., Morel F. (2011) New insight into the Nox4 subcellular localization in HEK293 cells: first monoclonal antibodies against Nox4. Biochimie 93, 457–468 [DOI] [PubMed] [Google Scholar]
- 46. Ambasta R. K., Kumar P., Griendling K. K., Schmidt H. H., Busse R., Brandes R. P. (2004) Direct interaction of the novel Nox proteins with p22phox is required for the formation of a functionally active NADPH oxidase. J. Biol. Chem. 279, 45935–45941 [DOI] [PubMed] [Google Scholar]
- 47. Hajas G., Bacsi A., Aguilera-Aguirre L., Hegde M. L., Tapas K. H., Sur S., Radak Z., Ba X., Boldogh I. (2013) 8-Oxoguanine DNA glycosylase-1 links DNA repair to cellular signaling via the activation of the small GTPase Rac1. Free Radic. Biol. Med. 61, 384–394 [DOI] [PMC free article] [PubMed] [Google Scholar]
- 48. Sato T., Yang X., Knapper S., White P., Smith B. D., Galkin S., Small D., Burnett A., Levis M. (2011) FLT3 ligand impedes the efficacy of FLT3 inhibitors in vitro and in vivo. Blood 117, 3286–3293 [DOI] [PMC free article] [PubMed] [Google Scholar]
- 49. Grunwald M. R., Levis M. J. (2013) FLT3 inhibitors for acute myeloid leukemia: a review of their efficacy and mechanisms of resistance. Int. J. Hematol. 97, 683–694 [DOI] [PubMed] [Google Scholar]
- 50. Piloto O., Wright M., Brown P., Kim K.-T., Levis M., Small D. (2007) Prolonged exposure to FLT3 inhibitors leads to resistance via activation of parallel signaling pathways. Blood 109, 1643–1652 [DOI] [PMC free article] [PubMed] [Google Scholar]
- 51. Heidel F., Solem F. K., Breitenbuecher F., Lipka D. B., Kasper S., Thiede M. H., Brandts C., Serve H., Roesel J., Giles F., Feldman E., Ehninger G., Schiller G. J., Nimer S., Stone R. M., Wang Y., Kindler T., Cohen P. S., Huber C., Fischer T. (2006) Clinical resistance to the kinase inhibitor PKC412 in acute myeloid leukemia by mutation of Asn-676 in the FLT3 tyrosine kinase domain. Blood 107, 293–300 [DOI] [PubMed] [Google Scholar]
- 52. Zhou F.-L., Zhang W.-G., Wei Y.-C., Meng S., Bai G.-G., Wang B.-Y., Yang H.-Y., Tian W., Meng X., Zhang H., Chen S.-P. (2010) Involvement of oxidative stress in the relapse of acute myeloid leukemia. J. Biol. Chem. 285, 15010–15015 [DOI] [PMC free article] [PubMed] [Google Scholar]
- 53. Koptyra M., Falinski R., Nowicki M. O., Stoklosa T., Majsterek I., Nieborowska-Skorska M., Blasiak J., Skorski T. (2006) BCR/ABL kinase induces self-mutagenesis via reactive oxygen species to encode imatinib resistance. Blood 108, 319–327 [DOI] [PMC free article] [PubMed] [Google Scholar]
- 54. Nowicki M. O., Falinski R., Koptyra M., Slupianek A., Stoklosa T., Gloc E., Nieborowska-Skorska M., Blasiak J., Skorski T. (2004) BCR/ABL oncogenic kinase promotes unfaithful repair of the reactive oxygen species-dependent DNA double-strand breaks. Blood 104, 3746–3753 [DOI] [PubMed] [Google Scholar]
- 55. Kuzminov A. (2001) Single-strand interruptions in replicating chromosomes cause double-strand breaks. Proc. Natl. Acad. Sci. U.S.A. 98, 8241–8246 [DOI] [PMC free article] [PubMed] [Google Scholar]


