Abstract
Background
In diabetes mellitus reduced perfusion and capillary surface area in skeletal muscle, which is a major glucose storage site, contributes to abnormal glucose homeostasis. Using contrast-enhanced ultrasound (CEU) we investigated whether abdominal adipose tissue perfusion is abnormal in insulin resistance (IR) and correlates with glycemic control.
Methods and Results
Abdominal adipose tissue and skeletal muscle CEU perfusion imaging was performed in obese IR (db/db) mice at 11-12 or 14-16 weeks of age, and in control lean mice. Time-intensity data were analyzed to quantify microvascular blood flow (MBF) and capillary blood volume (CBV). Blood glucose response over one hour was measured after insulin challenge (1 u/Kg, I.P.). Compared to control mice, db/db mice at 11-12 and 14-16 weeks had a higher glucose concentration area-under-the-curve after insulin (11.8±2.8, 20.6±4.3, and 28.4±5.9 mg·min/dL [×1000], respectively, p=0.0002), and also had lower adipose MBF (0.094±0.038, 0.035±0.010, and 0.023±0.01 mL/min/g, p=0.0002) and CBV (1.6±0.6, 1.0±0.3, and 0.5±0.1 mL/100 g, p=0.0017). The glucose area-under-the-curve correlated in a non-linear fashion with both adipose and skeletal muscle MBF and CBV. There were significant linear correlations between adipose and muscle MBF (r=0.81) and CBV (r=0.66). Adipocyte cell volume on histology was 25-fold higher in 14-16 week db/db versus control mice.
Conclusions
Abnormal adipose MBF and CBV in IR can be detected by CEU and correlates with the degree of impairment in glucose storage. Abnormalities in adipose tissue and muscle appear to be coupled. Impaired adipose tissue perfusion is in part explained by an increase in adipocyte size without proportional vascular response.
Keywords: diabetes, insulin resistance, microcirculation, contrast ultrasound, adipose tissue
The ability to quantify tissue perfusion non-invasively has provided unique insight into the importance of the peripheral microcirculation in glucose homeostasis. The efficiency of glucose transport into storage sites such as muscle is dependent upon delivery and diffusion of glucose which are determined by microvascular blood flow (MBF) and capillary surface area.1-3 In humans and a wide array of species, contrast-enhanced ultrasound (CEU) has been used to demonstrate that limb skeletal muscle MBF and capillary blood volume (CBV) increase in response to carbohydrate challenge or physiologic hyperinsulinemia,4-8 and that this response is abnormal in insulin resistance (IR) states.7,9,10 CEU has also been applied to identify biologic mediators of the microvascular response to insulin which include nitric oxide (NO) and arachadonic acid-derived compounds.7,11,12 In aggregate, CEU studies have supported the notion that microvascular dysfunction is not simply a consequence of IR, but also contributes to IR.
Adipose tissue is another storage site for glucose that is under the regulatory influence of insulin, although its glucose uptake capacity is less than that in skeletal muscle.13-16 There is also evidence that MBF and insulin-stimulated glucose uptake in adipose tissue is reduced in IR states.13,16,17. Although non-invasive techniques such as 133Xenon (133Xe) and positron emission tomography (PET) have been used to study adipose MBF, functional microvascular density has not been fully explored.14 Because adipose tissue is characterized by large intercapillary distances, especially in obesity, and a small arterial-venous glucose gradient, it is quite likely that CBV (i.e. capillary surface area) rather than MBF is the major determinant of glucose uptake by adipose tissue. 18,19
Recently, CEU with bolus transit rate analysis has been performed in normal subjects to show that subcutaneous adipose blood volume increases in response to glucose load.20 It was also used to demonstrate that increases in subcutaneous CBV in response to adrenalin, which normally increases adipose perfusion for either lipid mobilization or deposition, is abnormal in subjects with type 2 diabetes mellitus and that this abnormality was associated with reduced glucose uptake.21 In this study CEU was used to test the hypothesis that both MBF and CBV are reduced in abdominal adipose tissue in IR mice, and that the degree of flow impairment correlates with the degree to which glucose homeostasis is impaired. We also sought to determine whether impaired adipose perfusion was related to the degree of adipose cell hypertrophy.
Methods
Animals and Protocols
The study was approved by the Animal Care and Use Committee at Oregon Health & Science University. A total of 12 db/db obese IR mice with homozygous genetic deletion of the leptin receptor (BB6.BKS(D)-Leprdb/J, Jackson Laboratories) were studied at age 11-12 (n=4) or 14-16 (n=8) weeks to provide a range of the degree of IR.22 A total of 5 heterozygous db/+ mice 14-16 wks of age on the same background strain (C57Bl/6) were studied as insulin-sensitive controls. Mice were studied on two subsequent days. On day 1, mice were fasted for 5 hours and response to insulin was tested by measuring blood glucose concentration from a tail vein at baseline and at 15 min intervals for 1 hour after administration of insulin (1 u/Kg, I.P.). On the subsequent day, a catheter was placed in a jugular vein for administration of microbubbles. CEU perfusion imaging of resting skeletal muscle and abdominal adipose tissue was performed. For each study mice were anesthetized with inhaled isoflurane (1.0-1.5%) and core body temperature was maintained by use of a heating pad.
Adipose and Muscle Perfusion Imaging
Lipid-shelled decaflourobutane microbubbles were prepared by sonication of an aqueous lipid dispersion of polyoxyethylene-40-stearate and distearoyl phosphatidylcholine saturated with decafluorobutane gas. Microbubble concentration was measured by electrozone sensing (Multisizer III, Beckman Coulter). CEU imaging was performed with a linear-array transducer (15L8) interfaced with an ultrasound system (Sequoia, Siemens Medical Systems, Mountain View, CA). A multipulse algorithm using phase-inversion and amplitude-modulation was used to detect the nonlinear component of the microbubble signal at a transmission frequency of 7 MHz. Imaging was performed at a mechanical index (MI) of 0.18 and a dynamic range of 55 dB. Blood pool signal (IB) from several frames was measured from the left ventricular cavity at end-diastole during an intravenous microbubble infusion rate of 5×10⁵ min−1. The infusion rate was then increased to 2×10⁷ min−1 for imaging both the abdominal-inguinal fat reservoir and proximal hindlimb adductor muscle group (adductor magnus and semimembranosus). Muscle imaging was performed in a transaxial plane to major muscle fiber direction. Images were acquired using a frame rate of 5 Hz for 20 seconds after a high-power (MI 1.0) 5-frame destructive pulse sequence. Background-subtracted intensity was measured using a frame obtained 1 second after destruction in order to eliminate signal from almost all non-capillary vessels 5,23, and time-intensity data were fit to the function:
where y is intensity at time t, A is the plateau intensity, and the rate constant β represents the microvascular flux rate.5,24 Skeletal muscle CBV was quantified by scaled comparison of plateau intensity to blood pool and calculated by:
where 1.06 is tissue density (g/cm3), F is the scaling factor that corrected for the different infusion rate for measuring IB in order to avoid dynamic range saturation, and C is a coefficient to correct for sternal attenuation measured a priori (1.1 for mice). MBF was quantified by the product of CBV and β.5,24 For these studies, the abdominal-inguinal fat depot and muscle were identified based on their characteristic location and appearance on B-mode and CEU imaging (see Supplemental Figure 1), and confirmation of fat imaging in db/+ was made by ultrasound-guided injection of methylene blue at the completion of the study which was then observed on necropsy.
Histology
Adipose tissue from the region imaged by CEU was obtained from control (db/wt) and 14-16 wk db/db mice. Tissue was not obtained from younger db/db mice due to subsequent assignment to a separate protocol. Tissue was immersion-fixed in 4% paraformaldehyde and paraffin-embedded sections were stained with hemotoxylin and eosin (H&E). Adipocyte cross-sectional area was measured with a calibrated analysis system with a total of 16 to 35 cells analyzed per animal. Interobserver variability between two separate readers was assessed in a total of 225 cells (n=75 for db/db; n=150 for db/wt). Adipocyte area was converted to volume using assumptions of cell symmetry by 1.33×CSA×(CSA/π)1/2, where CSA is cross-sectional area.
Statistical Analysis
Statistical analysis was made using either STATA 11.2 or Prism 6.02 (GraphPad). Differences between independent groups were evaluated using either one-way ANOVA or Kruskall-Wallis tests; and post-hoc differences between groups was made using Student's t-tests (two-sided) with Tukey test for multiple comparisons. A generalized estimating equations (GEE) model was used to assess time-dependent effects on glucose during insulin challenge. Differential group effects of insulin on glucose were assessed via an interaction between group and time. An autoregressive correlation structure of order 1 was used to allow for correlation between repeated measures on the same animal. For independent observations, linear associations were analyzed using regression analysis and Pearson's product-moment correlation; non-linear associations were measured by regression analysis with least-squares fit. Interobserver variability was analyzed both by Pearson's product moment and by intraclass correlation coefficient (ICC) determination.25 Differences were considered significant at p<0.05.
Results
Obesity and Insulin Sensitivity
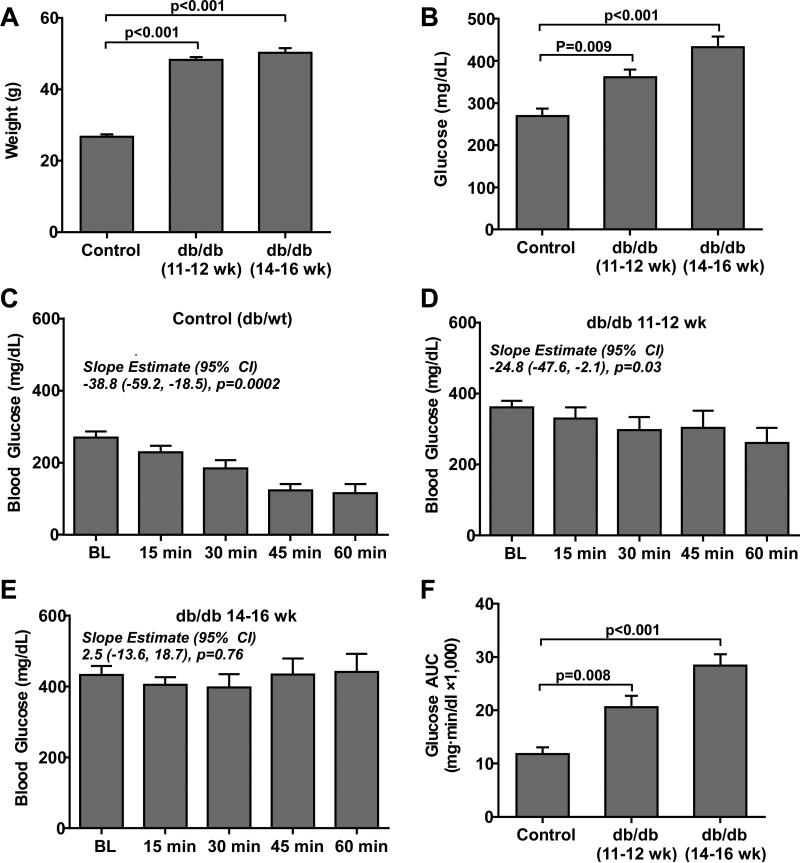
Body mass was significantly greater in db/db compared to control (db/+) mice without any significant age-dependent increase in mass for the db/db group (Figure 1A). The increase in body mass was attributable to a marked increase in abdominal girth and central adipose tissue stores. Fasting blood glucose increased in an incremental fashion (Kruskal-Wallis p=0.009) between control, db/db mice at 11-12 weeks, and db/db mice at 14-16 weeks of age (Figure 1B). The blood glucose response to insulin quantified by the change in glucose over time and the glucose area-under-the-curve (AUC) after insulin challenge was impaired in db/db mice indicating a severe IR state (Figure 1C to 1F). The GEE model indicated a significant difference in temporal response to insulin between groups (GEE model p=0.005). These findings are consistent with the previously described progressive phenotype of obesity and IR for db/db mice.
Figure 1.
(A) Mean (±SEM) body weight and (B) fasting blood glucose for control (db/+) mice at 16 weeks of age (n=5), and db/db mice at 11-12 (n=5) or 14-16 (n=8) weeks of age. Slope estimates from the GEE model, which represent change in glucose in 15 min intervals from baseline, indicate significant reductions in glucose response to insulin in control and to a lesser extent in db/db mice at 11-12 weeks of age. (C to E) Mean (±SEM) blood glucose concentration for the different animal groups after administration of insulin (1 u/Kg, I.P.) (F) Mean (±SEM) glucose AUC measured during insulin challenge in the different animal groups.
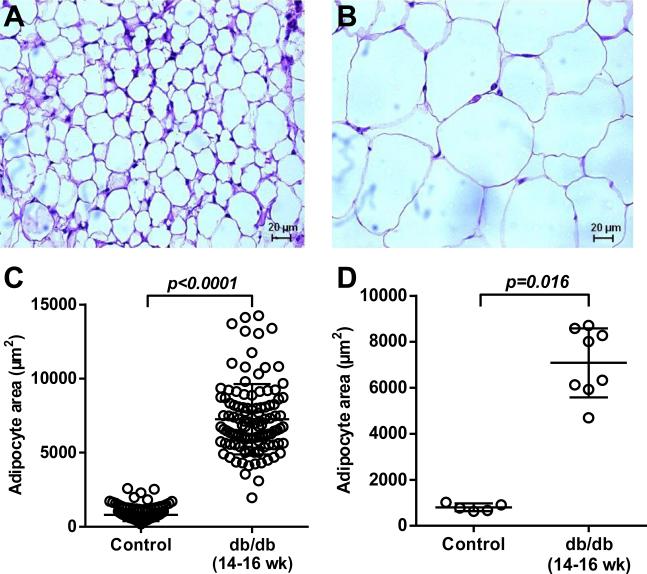
Adipocyte size on histology was much larger in db/db mice at 14-16 weeks than in control mice (Figure 2). Interobserver variability for measuring adipocyte dimension was very low with a Pearson's product-moment correlation coefficient and ICC of 0.99 (Supplemental Figure 2).
Figure 2.
Representative histology images with H&E staining illustrating differences in adipocyte size between (A) control and (B) 14-16 week-old db/db mice (scale at bottom). (C) Histology data on adipocyte area measured for all cells with superimposed mean (±SD). (D) Histology data on adipocyte area displaying data as average for each animal with superimposed mean (±SD).
Perfusion and Blood Volume in Muscle and Adipose Tissue
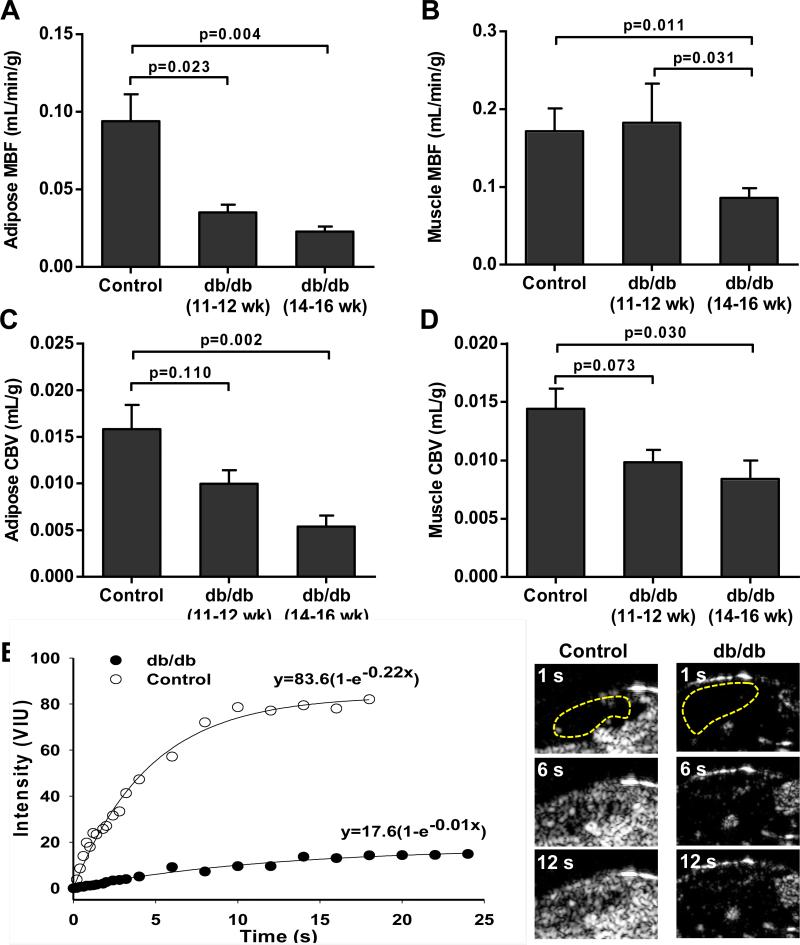
In abdominal-inguinal adipose tissue, microvascular blood flow (MBF) was significantly lower in both db/db cohorts compared to control mice (Figure 3A), with a non-significant trend (p=0.06) for lower MBF in the older compared to younger db/db mice. In contrast, MBF in the proximal hindlimb of skeletal muscle was lower compared to controls only for the older db/db cohort (Figure 3B). In both adipose tissue and skeletal muscle, CBV was lower in db/db compared to control mice although this difference reached statistical significance only for the older db/db cohort after correction for multiple comparisons (Figure 3C and 3D).
Figure 3.
Mean (±SEM) MBF in (A) adipose tissue and (B) in skeletal muscle in the different animal groups derived from CEU time-intensity data. Mean (±SEM) CBV in (C) adipose tissue and (D) in skeletal muscle in the different animal groups derived from CEU time-intensity data. Data were generated from control (db/+) mice 16 weeks of age (n=5), and db/db mice at 11-12 (n=5) or 14-16 (n=8) weeks of age. (E) Representative examples of adipose CEU data and images at immediately after a destructive pulse sequence and at 6 and 12 seconds from a control and 16 week-old db/db mouse. The adipose regions-of-interest are defined by the yellow dashed lines. *p<0.05 versus control; †p<0.05 versus db/db 11-12 week-old.
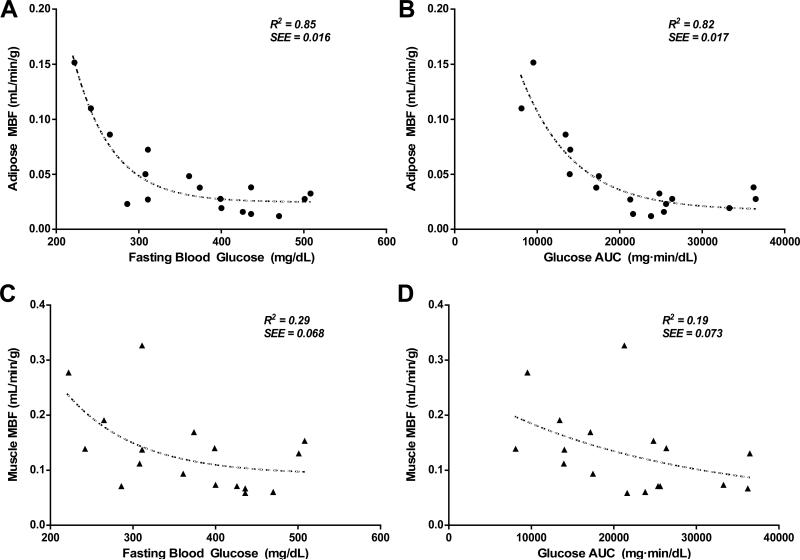
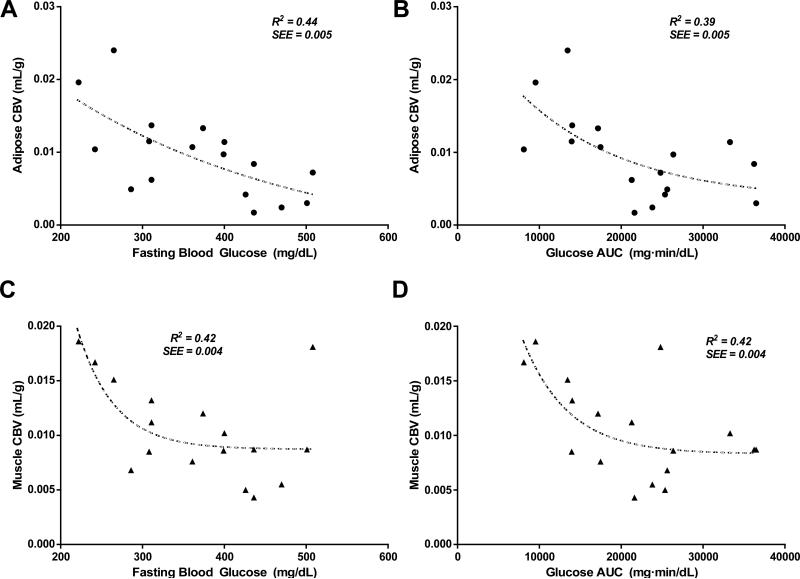
To test whether there was a relation between tissue perfusion in the major glucose storage sites and the degree of impairment in glucose homeostasis, both fasting blood glucose and the glucose AUC during insulin challenge were correlated with MBF and CBV which are proposed to be the primary microvascular parameters of substrate delivery. In both adipose tissue and skeletal muscle, there was a significant non-linear relation between MBF and either fasting glucose or glucose AUC (Figure 4). In general the rate constant of exponential decline in MBF was much steeper in adipose tissue than for skeletal muscle indicating a more profound reduction in MBF in adipose tissue in animals with more moderate IR. There were similar relations between CBV and either fasting glucose or glucose AUC in both adipose tissue and skeletal muscle (Figure 5). Although a non-linear fit was used for the data in Figures 4 and 5, for some of the correlations (e.g. Figure 4D and 5C) a single outlying data point influenced curve fit and when removed a linear correlation was almost as strong as an exponential correlation.
Figure 4.
(A) Relation between fasting blood glucose after insulin challenge with adipose tissue MBF. (B) Relation between glucose AUC after insulin challenge with adipose tissue MBF. (C) Relation between fasting blood glucose after insulin challenge with skeletal muscle MBF. (D) Relation between glucose AUC after insulin challenge with skeletal muscle MBF. SEE=standard error of the estimate.
Figure 5.
(A) Relation between fasting blood glucose after insulin challenge with adipose tissue CBV. (B) Relation between glucose AUC after insulin challenge with adipose tissue CBV. (C) Relation between fasting blood glucose after insulin challenge with skeletal muscle CBV. (D) Relation between glucose AUC after insulin challenge with skeletal muscle CBV. SEE=standard error of the estimate.
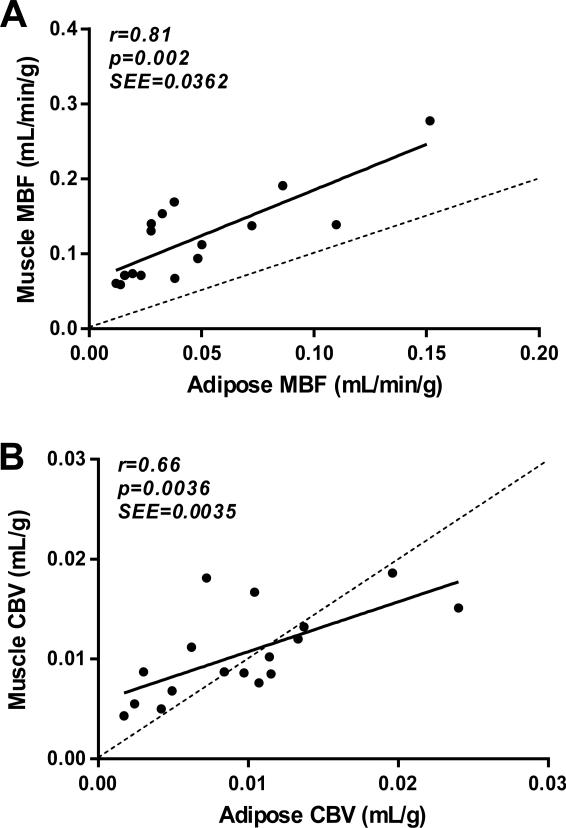
With regards to coupling of perfusion in adipose tissue and skeletal muscle, a significant linear correlation was found between adipose and muscle MBF, although flow tended to be consistently higher in the latter (Figure 6). There was also a significant correlation between adipose and muscle CBV without consistent pattern of difference between the two tissues.
Figure 6.
Relationship between (A) adipose tissue and skeletal muscle MBF; and (B) adipose tissue and skeletal muscle CBV. SEE=standard error of the estimate.
Adipocyte and Blood Volumes
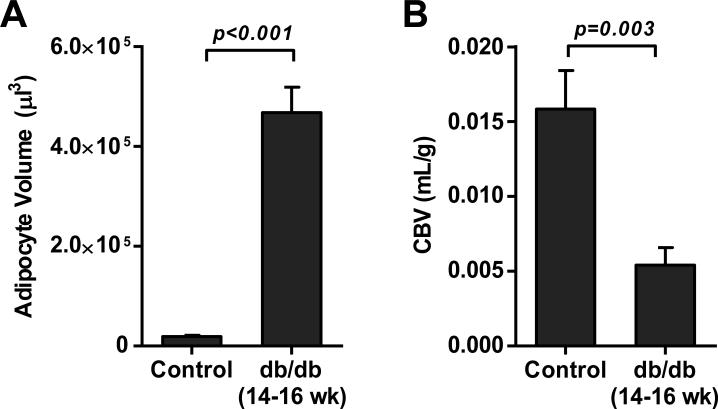
To better examine whether abnormal CBV in adipose tissue of db/db mice could be attributable to adipocyte hypertrophy without compensatory angiogenic response, the relative differences between in adipocyte volume and CBV were evaluated for control and 14-16 week-old db/db mice. When adipocyte area was converted to volume, the increase in adipocyte volume in db/db mice increased to a greater degree than did the relative paucity in CBV (Figure 7), implying that some degree of compensatory vascular response to adipocyte hypertrophy did occur in the db/db mice, albeit insufficient to maintain a normal CBV.
Figure 7.
(A) Mean (±SEM) adipocyte volume calculated from cross sectional area data for control and 14-16 week-old db/db mice. (B) Mean (±SEM) adipose tissue CBV.
Discussion
In this study we have demonstrated that adipose tissue MBF and CBV are impaired in IR mice and that these microvascular abnormalities are associated non-linearly with the degree of IR. The degree of abnormal perfusion in adipose tissue correlates with that in skeletal muscle, another major storage site for glucose; although our data also suggests that early in the progression of IR, abnormalities in perfusion are more profound in adipose tissue.
Perfusion in the body's major glucose storage sites is thought to be an important determinant of the biologic actions of insulin. Quantitative CEU perfusion imaging has been used extensively to study the role of skeletal muscle capillaries in glucose homeostasis in humans and in small animal and non-human primate models of disease. Using this technique it has been shown that insulin within and above the physiologic range increases muscle MBF and CBV in a dose-dependent fashion.4,5,12 The normal vascular response to insulin or to carbohydrate challenge is abnormal in IR states suggesting that impaired delivery resulting from microvascular dysfunction contributes to impaired glucose handling.7,9,10 These data are further supported by findings that microvascular functional abnormalities are a very early event in IR.26
The ability of CEU to assess not only MBF but also CBV is particularly valuable. At the capillary level, changes in perfusion occur as a result of either changes in the rate of flux through individual capillaries and/or changes in the number of perfused capillaries.27 Limb arterial-venous concentration difference for glucose is rather low (0.1-0.2 mM) even under physiologic hyperinsulinemia.3 Hence, increases in capillary blood flux rate result in only a small increase in glucose diffusion by increasing glucose concentration at the terminal end of capillaries. Increases in the total surface area by capillary recruitment represents a more effective response for increasing glucose diffusion.28 Recent studies also indicate that endothelial surface is important not only for glucose diffusion but also for delivery of insulin to the extravascular compartment.29
Recently, it has been shown that CEU can be used to examine perfusion in brown adipose tissue perfusion.30 It has also been used to detect post-prandial changes in subcutaneous adipose blood volume.20 Because adipose tissue is a storage site for glucose and because perfusion influences the metabolic and endocrine actions of adipocytes,14 our primary aim was to determine whether CEU could detect abnormalities in adipose perfusion in IR states. CEU imaging using bolus transit analysis has revealed that in abdominal subcutaneous adipose stores, the normal sympathetic-mediated increase in CBV is blunted in obese individuals with type 2 diabetes mellitus.21 The finding that glucose uptake in this fat store was also abnormal suggests that abnormal capillary response may contribute to abnormal glucose handling. Other perfusion imaging techniques have shown previously that adipose MBF increases by several fold within an hour of carbohydrate loading.17,31 Moreover, adipose tissue MBF has been shown to be lower at baseline and after a meal in obese IR subjects, suggesting that microvascular dysfunction may manifest in adipose tissue similar to what has been found in skeletal muscle.13,17,32 Yet, there is reason to believe that regulation of flow responses is different in the two tissues.14
In the current study, we have shown that CEU can detect abnormal basal perfusion in the abdominal-inguinal adipose tissue in IR mice. Because adipose tissue is characterized by rather large average intercapillary distances and small arterio-venous glucose gradients,18,19 we believe that CBV is a major determinant of glucose uptake and possibly other metabolic processes performed by adipose tissue. Our results indicate that functional CBV which is a major determinant of MBF, is abnormal in IR states. The non-linear nature of the relationships between glycemic control and adipose perfusion suggest that abnormalities in adipose tissue perfusion occur early in IR and that further progression of hyperglycemia is associated with only mild worsening of adipose perfusion at rest. Future studies with a greater number of time intervals will be needed to confirm this finding.
It is possible that the reduction in MBF in this study could have in part been secondary to hypertriglyceridemia which is associated with IR and has been shown to influence muscle perfusion on CEU.33 However, the hyperviscosity state associated with hypertriglyceridemia probably does not explain the reduced CBV since it affects primarily microvascular flux rate and not muscle microvascular blood volume. Moreover, abnormalities in perfusion caused by even moderate to severe triglyceridemia in general are uncovered only during hyperemic stress.33
There is reason to believe that in type 2 diabetes mellitus there is inadequate angiogenesis to compensate for the increase in adipose tissue mass and adipocyte size that occurs with obesity.18 In our older db/db mice we did find a substantial increase in adipocyte cross-sectional area on histology. It was interesting to note that the marked increase (>25-fold) in calculated adipocyte volume in older db/db mice compared to controls was much greater than the relative difference in CBV between the groups. These changes suggest that some vascular adaptation, either functional or structural, did occur. Although the lack of histologic data in the younger db/db mice is a limitation of our study, others have demonstrated by histology in db/db mice that the disparity between adipocyte size occurs and any angiogenesis increases with age.18
There are several important limitations to this study that deserve mention. Adipose tissue response to physiologic challenge such as hyperinsulinemia was not assessed. We believe that this type of assessment is best performed in larger animal models of IR or in humans where controlled euglycemic hyperinsulinemic clamp can be performed. We also did not directly measure glucose uptake in adipose tissue due to the difficulty in evaluating adipose arteriovenous glucose differences. This is much more readily possible in the limb (i.e. skeletal muscle) where we have already previously demonstrated a relation between muscle perfusion and limb glucose uptake.
We conclude that abdominal adipose tissue perfusion can be assessed in murine models of IR. Abnormalities in both adipose MBF and CBV correlate with the degree to which glucose homeostasis is impaired. The nature of these relationships suggests that profound perfusion abnormalities occur early in the development of obesity and IR and thereafter progress in a more gradual fashion. We have also demonstrated for the first time that abnormalities in adipose and muscle perfusion are coupled in IR. Our data suggests that CEU could be useful as a method to studying the determinants of abdominal adipose tissue perfusion and response to therapy.
Acknowledgments
Sources of Funding
Dr. Davidson was supported by a Ruth L. Kirschstein National Research Service Award (T32-HL094294) from the National Institutes of Health and by a Clinical Research Program Award (12CRP11890055) from the American Heart Association. Dr. Lindner is supported by grants R01-HL078610 and R01-HL111969 from the National Institutes of Health.
Footnotes
Disclosures
None.
References
- 1.Clark MG, Colquhoun EQ, Rattigan S, Dora KA, Eldershaw TP, Hall JL, Ye J. Vascular and endocrine control of muscle metabolism. Am J Physiol. 1995;268:E797–812. doi: 10.1152/ajpendo.1995.268.5.E797. [DOI] [PubMed] [Google Scholar]
- 2.Baron AD. Hemodynamic actions of insulin. Am J Physiol. 1994;267:E187–202. doi: 10.1152/ajpendo.1994.267.2.E187. [DOI] [PubMed] [Google Scholar]
- 3.Clerk LH, Vincent MA, Lindner JR, Clark MG, Rattigan S, Barrett EJ. The vasodilatory actions of insulin on resistance and terminal arterioles and their impact on muscle glucose uptake. Diabetes Metab Res Rev. 2004;20:3–12. doi: 10.1002/dmrr.414. [DOI] [PubMed] [Google Scholar]
- 4.Coggins M, Lindner J, Rattigan S, Jahn L, Fasy E, Kaul S, Barrett E. Physiologic hyperinsulinemia enhances human skeletal muscle perfusion by capillary recruitment. Diabetes. 2001;50:2682–2690. doi: 10.2337/diabetes.50.12.2682. [DOI] [PubMed] [Google Scholar]
- 5.Dawson D, Vincent MA, Barrett EJ, Kaul S, Clark A, Leong-Poi H, Lindner JR. Vascular recruitment in skeletal muscle during exercise and hyperinsulinemia assessed by contrast ultrasound. Am J Physiol Endocrinol Metab. 2002;282:E714–720. doi: 10.1152/ajpendo.00373.2001. [DOI] [PubMed] [Google Scholar]
- 6.Vincent MA, Dawson D, Clark AD, Lindner JR, Rattigan S, Clark MG, Barrett EJ. Skeletal muscle microvascular recruitment by physiological hyperinsulinemia precedes increases in total blood flow. Diabetes. 2002;51:42–48. doi: 10.2337/diabetes.51.1.42. [DOI] [PubMed] [Google Scholar]
- 7.Chadderdon SM, Belcik JT, Smith E, Pranger L, Kievit P, Grove KL, Lindner JR. Activity restriction, impaired capillary function, and the development of insulin resistance in lean primates. Am J Physiol Endocrinol Metab. 2012;303:E607–613. doi: 10.1152/ajpendo.00231.2012. [DOI] [PMC free article] [PubMed] [Google Scholar]
- 8.Vincent MA, Clerk LH, Lindner JR, Price WJ, Jahn LA, Leong-Poi H, Barrett EJ. Mixed meal and light exercise each recruit muscle capillaries in healthy humans. Am J Physiol Endocrinol Metab. 2006;290:E1191–1197. doi: 10.1152/ajpendo.00497.2005. [DOI] [PubMed] [Google Scholar]
- 9.Clerk LH, Vincent MA, Barrett EJ, Lankford MF, Lindner JR. Skeletal muscle capillary responses to insulin are abnormal in late-stage diabetes and are restored by angiotensin- converting enzyme inhibition. Am J Physiol Endocrinol Metab. 2007;293:E1804–1809. doi: 10.1152/ajpendo.00498.2007. [DOI] [PubMed] [Google Scholar]
- 10.Clerk LH, Vincent MA, Jahn LA, Liu Z, Lindner JR, Barrett EJ. Obesity blunts insulin- mediated microvascular recruitment in human forearm muscle. Diabetes. 2006;55:1436–1442. doi: 10.2337/db05-1373. [DOI] [PubMed] [Google Scholar]
- 11.Vincent MA, Barrett EJ, Lindner JR, Clark MG, Rattigan S. Inhibiting nos blocks microvascular recruitment and blunts muscle glucose uptake in response to insulin. Am J Physiol Endocrinol Metab. 2003;285:E123–129. doi: 10.1152/ajpendo.00021.2003. [DOI] [PubMed] [Google Scholar]
- 12.Vincent MA, Clerk LH, Lindner JR, Klibanov AL, Clark MG, Rattigan S, Barrett EJ. Microvascular recruitment is an early insulin effect that regulates skeletal muscle glucose uptake in vivo. Diabetes. 2004;53:1418–1423. doi: 10.2337/diabetes.53.6.1418. [DOI] [PubMed] [Google Scholar]
- 13.Virtanen KA, Lonnroth P, Parkkola R, Peltoniemi P, Asola M, Viljanen T, Tolvanen T, Knuuti J, Ronnemaa T, Huupponen R, Nuutila P. Glucose uptake and perfusion in subcutaneous and visceral adipose tissue during insulin stimulation in nonobese and obese humans. J Clin Endocrinol Metab. 2002;87:3902–3910. doi: 10.1210/jcem.87.8.8761. [DOI] [PubMed] [Google Scholar]
- 14.Sotornik R, Brassard P, Martin E, Yale P, Carpentier AC, Ardilouze JL. Update on adipose tissue blood flow regulation. Am J Physiol Endocrinol Metab. 2012;302:E1157–1170. doi: 10.1152/ajpendo.00351.2011. [DOI] [PubMed] [Google Scholar]
- 15.DeFronzo RA, Jacot E, Jequier E, Maeder E, Wahren J, Felber JP. The effect of insulin on the disposal of intravenous glucose. Results from indirect calorimetry and hepatic and femoral venous catheterization. Diabetes. 1981;30:1000–1007. doi: 10.2337/diab.30.12.1000. [DOI] [PubMed] [Google Scholar]
- 16.Stolic M, Russell A, Hutley L, Fielding G, Hay J, MacDonald G, Whitehead J, Prins J. Glucose uptake and insulin action in human adipose tissue--influence of bmi, anatomical depot and body fat distribution. Int J Obes Relat Metab Disord. 2002;26:17–23. doi: 10.1038/sj.ijo.0801850. [DOI] [PubMed] [Google Scholar]
- 17.Karpe F, Fielding BA, Ilic V, Macdonald IA, Summers LK, Frayn KN. Impaired postprandial adipose tissue blood flow response is related to aspects of insulin sensitivity. Diabetes. 2002;51:2467–2473. doi: 10.2337/diabetes.51.8.2467. [DOI] [PubMed] [Google Scholar]
- 18.Nishimura S, Manabe I, Nagasaki M, Hosoya Y, Yamashita H, Fujita H, Ohsugi M, Tobe K, Kadowaki T, Nagai R, Sugiura S. Adipogenesis in obesity requires close interplay between differentiating adipocytes, stromal cells, and blood vessels. Diabetes. 2007;56:1517–1526. doi: 10.2337/db06-1749. [DOI] [PubMed] [Google Scholar]
- 19.Coppack SW, Frayn KN, Humphreys SM, Whyte PL, Hockaday TD. Arteriovenous differences across human adipose and forearm tissues after overnight fast. Metabolism. 1990;39:384–390. doi: 10.1016/0026-0495(90)90253-9. [DOI] [PubMed] [Google Scholar]
- 20.Tobin L, Simonsen L, Bulow J. Real-time contrast-enhanced ultrasound determination of microvascular blood volume in abdominal subcutaneous adipose tissue in man. Evidence for adipose tissue capillary recruitment. Clin Physiol Funct Imaging. 2010;30:447–452. doi: 10.1111/j.1475-097X.2010.00964.x. [DOI] [PubMed] [Google Scholar]
- 21.Tobin L, Simonsen L, Galbo H, Bulow J. Vascular and metabolic effects of adrenaline in adipose tissue in type 2 diabetes. Nutr Diabetes. 2012;2:e46. doi: 10.1038/nutd.2012.19. [DOI] [PMC free article] [PubMed] [Google Scholar]
- 22.Chen H, Charlat O, Tartaglia LA, Woolf EA, Weng X, Ellis SJ, Lakey ND, Culpepper J, Moore KJ, Breitbart RE, Duyk GM, Tepper RI, Morgenstern JP. Evidence that the diabetes gene encodes the leptin receptor: Identification of a mutation in the leptin receptor gene in db/db mice. Cell. 1996;84:491–495. doi: 10.1016/s0092-8674(00)81294-5. [DOI] [PubMed] [Google Scholar]
- 23.Pascotto M, Leong-Poi H, Kaufmann B, Allrogen A, Charalampidis D, Kerut EK, Kaul S, Lindner JR. Assessment of ischemia-induced microvascular remodeling using contrast-enhanced ultrasound vascular anatomic mapping. J Am Soc Echocardiogr. 2007;20:1100–1108. doi: 10.1016/j.echo.2007.02.016. [DOI] [PubMed] [Google Scholar]
- 24.Wei K, Jayaweera AR, Firoozan S, Linka A, Skyba DM, Kaul S. Quantification of myocardial blood flow with ultrasound-induced destruction of microbubbles administered as a constant venous infusion. Circulation. 1998;97:473–483. doi: 10.1161/01.cir.97.5.473. [DOI] [PubMed] [Google Scholar]
- 25.Fleiss JL. The design and analysis of clinical experiments. Wiley; New York: 1999. [Google Scholar]
- 26.Kim F, Pham M, Maloney E, Rizzo NO, Morton GJ, Wisse BE, Kirk EA, Chait A, Schwartz MW. Vascular inflammation, insulin resistance, and reduced nitric oxide production precede the onset of peripheral insulin resistance. Arterioscler Thromb Vasc Biol. 2008;28:1982–1988. doi: 10.1161/ATVBAHA.108.169722. [DOI] [PMC free article] [PubMed] [Google Scholar]
- 27.Damon DH, Duling BR. Evidence that capillary perfusion heterogeneity is not controlled in striated muscle. Am J Physiol. 1985;249:H386–392. doi: 10.1152/ajpheart.1985.249.2.H386. [DOI] [PubMed] [Google Scholar]
- 28.Gudbjornsdottir S, Sjostrand M, Strindberg L, Wahren J, Lonnroth P. Direct measurements of the permeability surface area for insulin and glucose in human skeletal muscle. J Clin Endocrinol Metab. 2003;88:4559–4564. doi: 10.1210/jc.2003-030434. [DOI] [PubMed] [Google Scholar]
- 29.Barrett EJ, Eggleston EM, Inyard AC, Wang H, Li G, Chai W, Liu Z. The vascular actions of insulin control its delivery to muscle and regulate the rate-limiting step in skeletal muscle insulin action. Diabetologia. 2009;52:752–764. doi: 10.1007/s00125-009-1313-z. [DOI] [PMC free article] [PubMed] [Google Scholar]
- 30.Clerte M, Baron DM, Brouckaert P, Ernande L, Raher MJ, Flynn AW, Picard MH, Bloch KD, Buys ES, Scherrer-Crosbie M. Brown adipose tissue blood flow and mass in obesity: A contrast ultrasound study in mice. J Am Soc Echocardiogr. 2013;26:1465–1473. doi: 10.1016/j.echo.2013.07.015. [DOI] [PMC free article] [PubMed] [Google Scholar]
- 31.Bulow J, Astrup A, Christensen NJ, Kastrup J. Blood flow in skin, subcutaneous adipose tissue and skeletal muscle in the forearm of normal man during an oral glucose load. Acta physiologica Scandinavica. 1987;130:657–661. doi: 10.1111/j.1748-1716.1987.tb08189.x. [DOI] [PubMed] [Google Scholar]
- 32.Summers LK, Samra JS, Humphreys SM, Morris RJ, Frayn KN. Subcutaneous abdominal adipose tissue blood flow: Variation within and between subjects and relationship to obesity. Clinical science. 1996;91:679–683. doi: 10.1042/cs0910679. [DOI] [PubMed] [Google Scholar]
- 33.Rim SJ, Leong-Poi H, Lindner JR, Wei K, Fisher NG, Kaul S. Decrease in coronary blood flow reserve during hyperlipidemia is secondary to an increase in blood viscosity. Circulation. 2001;104:2704–2709. doi: 10.1161/hc4701.099580. [DOI] [PubMed] [Google Scholar]


