Abstract
The role of muscarinic receptor subtypes in modulating acute liver injury is unknown. We detected M1 muscarinic receptors (M1R) expression in human and murine hepatocytes, and investigated the consequences of M1R deficiency on acute liver injury in vivo and inhibiting M1R activation on hepatocyte injury in vitro. Age-matched wild-type (WT) and M1R-deficient (Chrm1−/−) male mice were injected intraperitoneally with 200 mg/kg acetaminophen (APAP) and euthanized 0, 2, 4, 16, 24 and 36 h later. Biochemical and histological parameters indicated that liver injury peaked within 16 h after APAP treatment and resolved by 24 h. Compared to WT, M1R-deficient mice had reduced intrahepatic hemorrhage and hepatocyte necrosis, reflected by an attenuated rise in serum alanine aminotransferase levels. Livers of M1R-deficient mice showed reduced hepatocyte DNA fragmentation and attenuated expression of injury cytokines (Il-1α, Il-1β, Il-6 and Fasl). In all mice hepatic glutathione levels decreased after APAP injection, but they recovered more quickly in M1R-deficient mice. During the course of APAP-induced liver injury in M1R-deficient compared to WT mice, hepatic Nrf-2, Gclc and Nqo1 expression increased and nitrotyrosine generation decreased. APAP metabolic pathways were not altered by M1R deficiency; expression of hepatic Cyp2e1, Cyp1a2, Cyp3a11, Cyp3a13, Car and Pxr were similar in Chrm1−/− and WT mice. Finally, treatment of murine AML12 hepatocytes with a novel M1R antagonist, VU0255035, attenuated H2O2-induced oxidative stress, prevented GSH depletion and enhanced viability. We conclude that M1R modify hepatocyte responses to oxidative stress and that targeting M1R has therapeutic potential for toxic liver injury.
Keywords: acetaminophen, muscarinic receptors, liver, oxidative stress, G protein-coupled receptors
Introduction
Parasympathetic input from branches of the vagus nerve modulates hepatic function and the response to liver injury [1–6]. Vagus nerve transection prevents liver regeneration after partial hepatectomy, and reduces ductular proliferation and promotes cholangiocyte apoptosis after bile duct ligation [7–10]. In an animal model of cirrhosis, vagus nerve stimulation reduces portal vein pressures [11]. Despite the importance of vagal input for liver regeneration, the precise underlying mechanisms remain largely uncertain, primarily because the consequences of vagal stimulation are complex. These may be mediated by the release of many bioactive ligands, including acetylcholine, vasoactive intestinal peptide (VIP) and nitric oxide (NO), which interact with different post-neuronal receptors including cholinergic muscarinic receptors [12].
Although muscarinic G protein-coupled receptors (M1R–M5R) are expressed broadly [13], in the gastrointestinal tract M1 (M1R) and M3 (M3R) receptors predominate [14]. Earlier in vitro studies suggest that M3R activation protects variety of cells from injury-induced apoptosis [15, 16]. M3R are expressed in the liver and we showed previously that genetic ablation or inhibition of M3R in mice promotes liver injury by augmenting hepatocyte apoptosis and hepatic fibrogenesis whereas M3R activation attenuates chronic liver injury [17–19].
M1R expression and activation may also modulate cell survival, but this depends on the cell type examined [20, 21]. In HEK293 cells over-expressing human M1R, treatment with carbamylcholine, a non-selective muscarinic receptor agonist, stimulated cell death, an effect blocked by M1R antagonists [20]. In contrast, muscarinic stimulation of rat pheochromocytoma cells over-expressing M1R inhibited serum deprivation-induced caspase activation and apoptosis [21]. The role of M1R in regulating the response to liver injury is unknown and the focus of the present work.
For these studies, we used acetaminophen (APAP) to induced acute liver injury in mice. In the U.S., acetaminophen (APAP) overdose is the most common cause of acute liver injury and failure [22]. Therapeutic doses of APAP are metabolized to non-toxic metabolites [23] by pathways that are overwhelmed following an over-dose; APAP is then metabolized by cytochrome P450, predominantly 2e1, to a toxic metabolite N-acetyl-p-benzoquinone imine (NAPQI) which depletes hepatocyte GSH and accumulates to form protein adducts [24]. Subsequent activation of c-Jun n-terminal kinase (Jnk), overproduction of ROS, and H2O2 and peroxynitrite generation result in mitochondrial dysfunction and hepatocyte death [25, 26]. A few studies suggested that APAP induces hepatocyte apoptosis but most agree that hepatocyte necrosis is the predominant injury [27–30]. Although the mechanisms underlying APAP-induced liver injury is an area of active investigation, the role of muscarinic receptors has not been considered previously.
Here, we studied the role of M1R in hepatocyte necrosis using both an in vivo murine model of APAP-induced liver injury and an in vitro model of H2O2-induced injury. We detected M1R expression in both murine and human hepatocytes. In response to APAP overdose, M1R-deficient animals displayed enhanced anti-oxidant responses that attenuated liver injury compared to WT mice. This in vivo observation that M1R deficiency was protective was bolstered by our finding that treating murine AML12 hepatocytes with a selective M1R antagonist attenuated H2O2-induced oxidative stress and cell death.
Materials and Methods
Experimental Design and Animal Procedures
All animal studies were conducted in accordance with the Guide for the Care and Use of Laboratory Animals prepared by the United States National Academy of Sciences (National Institutes of Health) and approved by the Institutional Animal Care and Use Committee at the University of Maryland School of Medicine (Baltimore, MD). Chrm1−/− mice and their WT controls were generated as described previously [31]. All mice [genetic background, 129S6/SvEv × CF1 (50%:50%)] were housed under identical conditions in a pathogen-free environment with a 12:12 h light/dark cycle and free access to mouse chow and water. Mice were acclimatized for 1–2 weeks before treatment. Age-matched (8–10-wk-old) WT (N=33) and Chrm1−/− (N=33) male mice were fasted overnight and injected intraperitoneally with 200 mg/kg APAP (Sigma-Aldrich. St Louis, MO) dissolved in warm PBS (pH 7.4; Invitrogen, Carlsbad, CA). Mice were euthanized 0, 2, 4, 16, 24 and 36 h after APAP injection (N=3–5 mice each).
Blood and Tissue Collection
Mouse livers were harvested and sections stored in formalin and RNAlater, and snap frozen in liquid nitrogen for further analysis. To determine serum alanine aminotransferase (ALT), blood was collected by cardiac puncture and centrifuged in microcontainer tubes (Becton Dickinson, Franklin Lakes, NJ).
Assessment of liver injury
Liver injury was assessed by gross inspection for congestion, histological changes in hematoxylin and eosin (H&E)-stained sections and serum ALT levels.
Liver Congestion
At euthanasia, two investigators masked to study groups graded liver congestion as: 0, none; 1, mild; 2, moderate; 3, severe.
Histology
To assess and score hepatocyte necrosis, hemorrhage and vacuolation we used a previously validated semi-quantitative methof (0, none; 1, <10% of the total area; 2, <30% of the total area; 3, <50% of the total area; 4, >50% of the total area) [32]. Formalin-fixed, paraffin-embedded H&E-stained liver sections were analyzed by two investigators masked to study groups (NU and TW).
ALT Measurements
Serum ALT levels were measured using assay kit per manufacturer’s instructions (TECO Diagnostics Anaheim, CA).
TUNEL Staining
DNA fragmentation was assessed using a TUNEL staining kit per manufacturers instructions (DeadEnd™ Colorimetric TUNEL System, Promega, Fitchburg, WI). Briefly, liver sections were de-paraffinized with xylene (3× 5 min, 25°C) then rehydrated in a series of graded ethanol washes, normal saline and PBS. The sections were fixed with 10% buffered formalin in PBS for 15 min at room temperature, then permeabilized with proteinase K solution followed by PBS washes and fixation in 10% buffered formalin in PBS. Next, slides were incubated in equilibration buffer and labeled with the TdT reaction mix for 60 min in a humidified chamber. The reaction was terminated by immersing slides in saline-sodium citrate (2×) for 15 min at room temperature and PBS washes for 5 min. Endogenous peroxidases were blocked by immersing the slides in 0.3% H2O2 in PBS for 3–5 min at room temperature. Following incubation in Streptavidin HRP solution (1:500 in PBS) for 30 min at room temperature, sections were washed thrice in PBS, followed by staining with diaminobenzidine and counterstaining with hematoxylin. The resultant sections were dehydrated, mounted and examined using an i80 photomicroscope (Nikon, Tokyo, Japan) at 200× magnification. Sections were examined and photographed at the same microscope settings. In each section, at least 10 areas were examined and staining was expressed as the number of TUNEL-stained hepatocytes per high power field (HPF).
Immunohistochemistry
Peroxynitrite generation was assessed by staining for nitrotyrosine adducts using an anti-3-nitrotyrosine antibody—nitration of tyrosine is a biomarker for peroxynitrite generation. Paraffin-embedded liver sections were deparaffinized with xylene (3× 5 min, 25°C) and rehydrated in a series of graded ethanol washes and deionized H2O. After heat-induced antigen retrieval with citric acid, liver sections were treated with 2% H2O2 to prevent nonspecific peroxidase activity and with bovine serum albumin and goat serum for nonspecific protein binding. Then slides were incubated with polyclonal rabbit anti-nitrotyrosine antibody (Millipore, Billerica, MA; dilution 1:200) overnight at 4°C, washed thrice in PBS and incubated with secondary antibody (biotinylated anti-rabbit antibody) for 30 min at room temperature. Avidin-biotin reaction was performed using VECTASTAIN Elite ABC kit (Vector Laboratories, Burlingame, CA), followed by staining with diaminobenzidine and counterstaining with hematoxylin. The resultant sections were mounted and examined using an i80 photomicroscope (Nikon, Tokyo, Japan) at 100× magnification. Sections were examined and photographed at the same microscope settings. In each section, at least five areas were examined. Nitrotyrosine staining was expressed as the percentage of summed pixels per unit area of liver section (in arbitrary units) determined using Image-Pro Plus software (version 5.0; Media Cybernetics, Silver Spring, MD) as described previously [18]. The stained sections were evaluated independently by two investigators.
RNA Extraction and cDNA Synthesis
A piece of mouse liver (approx. 100 mg) was removed from RNAlater and homogenized in Trizol (Life Technologies, Grand Island, NY) using a Polytron PT2100 homogenizer (Kinematica, Switzerland). Homogenization and RNA extraction were performed using phenol chloroform phase separation. RNA quantity and purity were assessed using a Thermo Scientific 2000 Nanodrop Spectrophotometer (Thermo Scientific, Wilmington, DE); for all samples, A260/A280 was 1.8–2.0. cDNA was prepared from 1 µg RNA/reaction using RevertAid™ First Strand cDNA Synthesis Kit (Thermo Scientific, USA); mRNA was isolated from liver cell sub-populations and cDNA prepared using similar methods.
Quantitative Real-Time Polymerase Chain Reaction (qPCR)
Assays were performed in 96-well PCR plates using Quantifast SYBR green PCR kit (Qiagen, USA). The reaction volume of 25 µl contained 12.5 µl SYBR green master mix (2×), 1 µl cDNA (25 ng), 1 µl of each primer (10 pmol/µl) and 9.5 µl nuclease-free water. Primer sequences are listed in Table 1. The following two-step thermal cycling profile was used (StepOnePlus™ Real-Time PCR, Applied Biosystems, USA): Step I (cycling): 95°C for 5 min, 95°C for 10 s and 60°C for 30 s for 40 cycles. Step II (melting curve): 60°C for 15 s, 60°C 1 min and 95°C for 30 s. Fold changes in mRNA expression were assessed by the ΔΔCt method. The specific amplification of template was confirmed by melting curve analysis.
Table 1.
Primer sequences
| Gene | Forward | Reverse |
|---|---|---|
| Chrm1 | TCACCCGAGTCACCTCCAG | CACCTTCAGAGGATGTGAGGG |
| CHRM1 | CAGGCAACCTGCTGGTACTC | CGTGCTCGGTTCTCTGTCTC |
| Il-1α | CCTTACACCTACCAGAGT | GTTTGTCCACATCCTGATA |
| Il-1β | TCTATACCTGTCCTGTGTAATG | GCTTGTGCTCTGCTTGTG |
| Tnf-α | GTGGAACTGGCAGAAGAG | AATGAGAAGAGGCTGAGAC |
| Fas | TTCATACTCAAGGTACTAATAGCA | TTCAGGTTGGCATGGTTG |
| Fasl | AAGAAGGACCACAACACAA | TAATCCCATTCCAACCAGAG |
| Il-6 | CTTCTGGAGTACCATAGC | TCTGTTAGGAGAGCATTG |
| Gclc | AACACAGACCCAACCCAGAG | CCGCATCTTCTGGAAATGTT |
| Nrf-2 | CGAGATATACGCAGGAGAGGTAAGA | GCTCGACAATGTTCTCCAGCTT |
| Nqo1 | CAGATCCTGGAAGGATGGAA | TCTGGTTGTCAGCTGGAATG |
| Cyp2e1 | ACCTGCCCCCAGCTTTCC | TGAACACTGGCCCGAAGCGC |
| Cyp1a2 | GACATGGCCTAACGTGCAG | GGTCAGAAAGCCGTGGTTG |
| Cyp3a11 | CGCCTCTCCTTGCTGTCACA | CTTTGCCTTCTGCCTCAAGT |
| Cyp3a13 | CCTCTGCCTTTCTTGGGGACGAT | CCGCCGGTTTGTGAAGGTAGAGT |
| Car | CCCTGACAGACCCGGAGTTA | GCCGAGACTGTTGTTCCATAAT |
| Pxr | GATGGAGGTCTTCAAATCTGCC | GGCCCTTCTGAAAAACCCCT |
| Gapdh | ACAACTTTGGCATTGTGGAA | GATGCAGGGATGATGTTCTG |
| 18s | CCAGAGCGAAAGCATTTGCCAAGA | AGCATGCCAGAGTCTCGTTCGTTA |
| GAPDH | CTTTTGCGTCGCCAGCCGAG | CCAGGCGCCCAATACGACCA |
Semi-quantitative Reverse Transcription Polymerase Chain Reaction (RT-PCR)
Semi-quantitative RT-PCR was performed using a C1000 Thermal Cycler (Bio-Rad, Hercules, CA). The reaction mixture contained 12.5 µL of Promega PCR Master Mix containing Taq DNA polymerase (Promega Corporation, Madison, WI), 1 µL of cDNA, 2 µL each primer (40 pmol/µl), 1 µL each of forward and reverse primers for housekeeping genes (20 pmol/µl) and 5.5 µL of nuclease free water. Primer sequences for target genes are listed in Table 1. The following thermal cycling steps were used: denaturation at 95°C for 2 min, primer-dependent annealing at 55–60°C for 1 min, and extension at 72°C for 1 min. Optimal annealing temperature was determined by temperature gradient analysis of each primer set and 30 cycles were performed for each reaction. Ethidium-bromide-labeled PCR products were visualized using 2% agarose gel electrophoresis (Sigma Aldrich, St. Louis, MO), assessed by densitometry and normalized to 18s expression.
Immunoblotting
Liver samples were homogenized in RIPA lysis buffer (containing phosphatase and protease inhibiters) and total protein content was determined using the Bradford reagent (Sigma, USA). Forty µg protein from each sample was electrophoresed on a 10% sodium dodecyl sulfate-polyacrylamide gel and transferred onto a PVDF membrane (Bio-Rad, USA). The membrane was blocked using 5% skimmed milk (Bio-Rad) prepared in PBS-Tween-20 (1×) for 1 h at room temperature on a shaker. Then, the blots were incubated with rabbit anti-mouse primary antibodies (1:1000) for M1R (Alomone Labs), Jnk (Cell signaling, USA), p-Jnk (Cell Signaling) and Gclc (GeneTex, USA) overnight at 4°C with gentle shaking. Next day, blots were washed with PBST (1×) three times for 10 min each and incubated with goat anti-rabbit horseradish peroxidase secondary antibody (1:5000; Cell Signaling) for 60 min with gentle shaking at room temperature. At the end of incubation, blots were washed with PBST (1×) and developed with chemiluminescence reagent (Denville Scientific) using autoradiography films (Denville Scientific). Blots were stripped using stripping buffer (Thermo Scientific, USA) and re-probed with goat anti-rabbit β-actin antibody (1:5000; Cell Signaling, USA) to cinfirm equivalent loading. Scanned images of blots were used to quantify protein expression using NIH ImageJ software (http://rsb.info.nih.gov/ij/).
GSH measurement and Lipid Peroxidation
Mouse liver was homogenized in isolation buffer (250 mM sucrose containing 5 mM MOPS and 1 mM EDTA, all at pH 7.4 with 0.25 mg BSA/ml) using a Polytron homogenizer (PT2100) to obtain a 10% (w/v) homogenate. Liver homogenate was centrifuged at 650 g for 10 min at 4°C to remove cell debris. The resultant supernatant was centrifuged at 10,000 g for 10 min at 4°C to sediment mitochondria. Mitochondrial pellets were washed twice with and suspended in isolation buffer. Mitochondrial protein content was determined by the Bradford assay. Reduced glutathione (GSH) was measured spectrophotometrically by assessing the reduction of DTNB (dithiobis-2-nitrobenzoic acid) forming a yellow colored anion at 412 nm [33]. A standard was used for calculation and GSH was expressed in µg/mg protein. Hepatic mitochondrial lipid peroxidation (LPO) was assessed by malondialdehyde (MDA) formation [34]. Commercially available 1, 1, 3, 3-tetraethoxypropane was used as a standard for calculating MDA content and expressed as MDA formed (nmoles/mg protein).
Isolation of liver cell sub-populations
Mouse cholangiocytes were kindly provided by Dr. Gianfranco Alpini. Liver cells were isolated as described previously [35]. For stellate cell isolation, mouse livers were perfused in situ with Pronase E and Collagenase P in KRH/EGTA buffer. After this initial perfusion, the liver tissue was again subjected to enzymatic treatment with Pronase E and Collagenase P in vitro for 20 min at 37°C with stirring. After filtering and centrifugation of the stellate cells, a gradient was created and the stellate cells were again centrifuged. The interphase was harvested, spun and the resulting cells were incubated at 37°C in 5% CO2.
To isolate hepatocytes, the liver was digested as above and then minced. The resulting cells were filtered and rotated at 37°C for 5 min. Cells were placed on ice, centrifuge at 300 rpm three times and resuspended in culture media. Cells were plated on collagen-coated dishes and incubated at 37°C.
Endothelial cells were isolated using Dynabeads and anti-mouse CD146. The liver was harvested and placed in a 1% collagenase solution and incubated for one hour at 37°C with rocking. The tissue was then filtered, spun and centrifuged. The beads were washed three times and cells were added to the beads. The cells-bead solution was incubated at room temperature with rocking for 2 h. The endothelial cells were then washed using the magnetic separator in which the cells were bound to CD 146-probed beads. Cells are then suspended in culture media and placed onto a collagen-coated tissue culture dish.
Kupffer cells were isolated as described previously [36]. The liver was perfused in situ with Pronase E and Collagenase P in HBSS, and subsequently extracted, minced and centrifuged. The supernatant was collected and the pellet resuspended in HBSS and centrifuged again. The supernatant was collected and pellet discarded. The supernatant was centrifuged and the pellet was resuspended in culture media. The cells were plated onto a 100-mm tissue culture dish and incubated for 20–30 min then washed twice with PBS. New culture media was added and cells were incubated at 37°C and 5% CO2.
AML12 Cell culture
These non-tumorigenic mouse hepatocyte cells, were cultured at 37°C with 5% CO2 in a 1:1 mixture of Dulbecco's modified Eagle's and Ham's F12 medium with 0.005 mg/ml insulin, 0.005 mg/ml transferrin, 5 ng/ml selenium, 10% fetal bovine serum. Cells were sub-cultured (1:4 to 1:6) using a 0.25% (w/v) trypsin-0.53 mM EDTA solution.
MTT assay
AML12 cells (6.0 × 10³ cells/well) were maintained in 96-well plates in presence of 1 mM H2O2 or, in combination with 0.3–1 µM VU 0255035, a novel M1R antagonist (Tocris, USA) [37] or vehicle (DMSO). After 6 h, culture media was replaced with 100 µl of MTT (0.5 mg/ml in culture media) and incubated at 37°C. After 2.5 h the MTT solution was discarded, all wells were washed with PBS, 150 µl DMSO was added to each well and then allowed to stand at room temperature for 30 min with constant shaking. Absorbance was read at 540 nm (VersaMax Microplate Reader, Molecular Device).
Quantification of cellular GSH
Reduced glutathione (GSH) estimation in the cell lysate was performed by the method of Beutler et al [33]. AML12 cells (1 × 10⁵ cells/well) were maintained in six-well plates for 120 min in the presence of 1 mM H2O2 alone and in combination with VU 0255035 or vehicle (DMSO). At the end of the incubation, cells were lysed using a polytron homogenizer and mitochondrial and post-mitochondrial fractions were prepared using isolation buffer (250mM Sucrose, 10 mM Tris HCL pH 7.4, and 0.1mM EGTA). Precipitating reagent was added to mitochondrial and post-mitochondrial fractions and centrifuged at 3000 rpm for 15 min. Equal volumes of supernatant, 0.04 % dithionitrobenzoic acid (in 1% sodium citrate) and 0.3 M Na2HPO4 were mixed, and incubated at room temperature for 10 min. Absorbance was read at 412 nm (BioMate 3S Spectrophotometer; Thermo Scientific, USA). A GSH standard curve was used for calculation of cellular GSH content.
DCFH-DA staining
AML12 cells (1 × 10⁵ cells/well) were maintained in six-well plates for 60 or 120 min with H2O2 alone and in combination with VU 0255035 or DMSO. At the end of incubation, cells were washed twice with warm HBSS buffer and incubated with 25 µM 2, 7-dichlorodihydrofluorescein diacetate (DCFH-DA) at 37°C for 30 min in the dark. Cells were observed and photographed using a Zeiss LSM 510 META Inverted Confocal microscope at 10× magnification.
Measurement of intracellular ROS
H2O2-induced oxidative stress was evaluated using the CellROX green reagent as per the manufacturer's instructions. In 96-well plates AML12 cells (6.0 × 10³ cells/well) were maintained for 2 h in the presence of vehicle (DMSO), H2O2 (1 mM) and vehicle, H2O2 (1 mM) plus VU 0255035 (1 µM), or VU0255035 alone. At the end of incubation, 5 µM CellROX green reagent was added to each well and incubated for 30 min at 37°C. At the end of incubation, cells were washed with PBS three times and florescence intensity was recorded using excitation and emission wavelengths of 485/520 nm in a Synergy 2 Multi-Mode Microplate Reader (Bio-Tek, USA) and normalized for cell viability.
LDH release assay
LDH release was quantified in the cell culture supernatant using the Pierce LDH Cytotoxicity Assay Kit (Thermo Scientific, USA). In 96-well plates AML12 cells (6.0 × 10³ cells/well) were maintained for 2, 4 and 6 h in the presence of vehicle (DMSO), H2O2 (1 mM) plus vehicle, H2O2 (1 mM) plus VU 0255035 (1 µM), or VU0255035 alone. At the end of each incubation 50 µl culture media was transferred to a new 96-well plate and 50 µl of reaction mixture added. Plates were incubated in the dark at room temperature and 50 µl of stop solution added after 30 min. Absorbance was read at 490 and 680 nm on a VersaMax Microplate Reader (Molecular Device, USA).
Statistical Analysis
All data are expressed as mean ± S.E.M. Normality was determined using the Shapiro-Wilk test. Student's t test (normally distributed data) or the Mann-Whitney U test (nonparametric data) was used to determine significance. Analysis was performed using SigmaPlot (version 12.0; Systat Software, Inc. San Jose, CA). Significance was defined as p < 0.05.
Results
M1R expression in murine and human liver
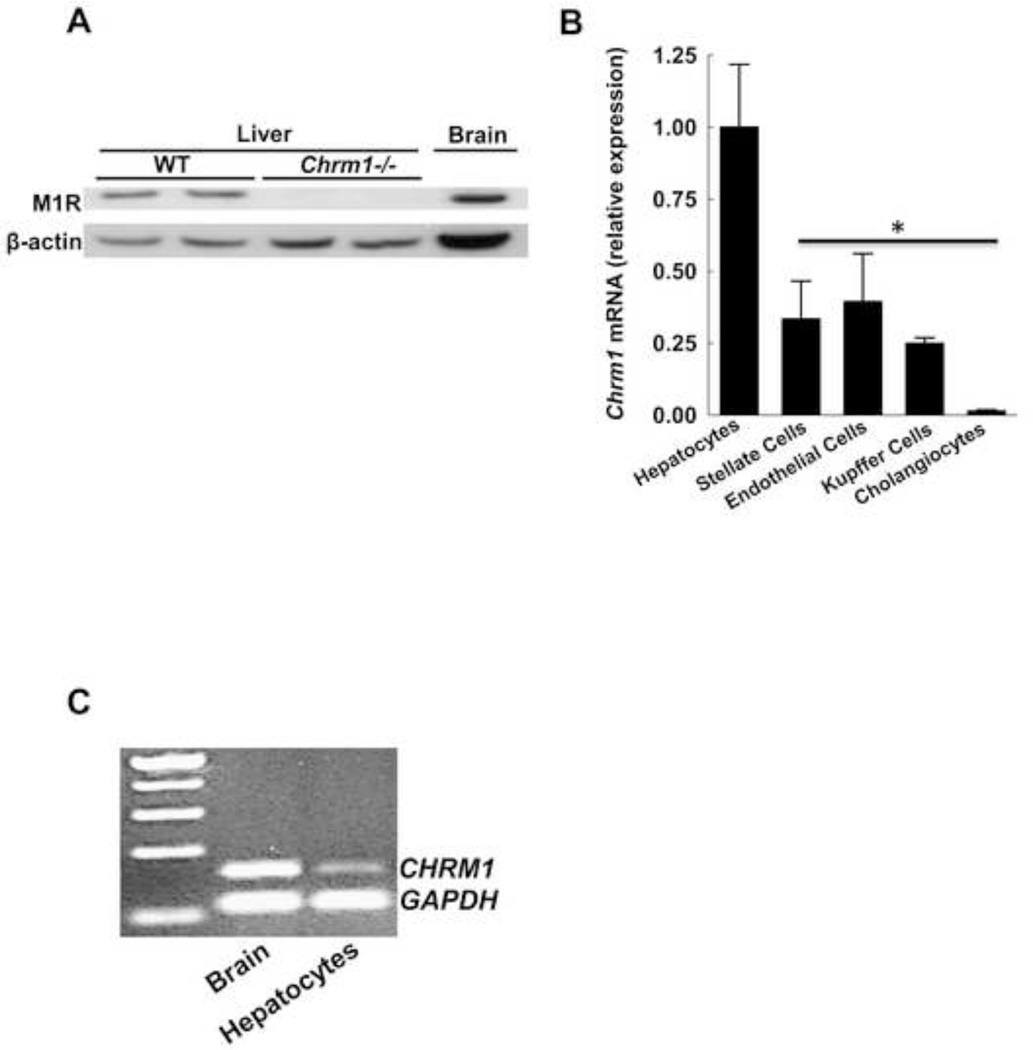
As shown by immunoblotting (Fig. 1A), M1R was expressed in livers from WT but not Chrm1−/− mice. To identify specific liver cell populations expressing M1R, qPCR was performed using mRNA from extracts of murine hepatocytes, stellate cells, sinusoidal endothelial cells, Kupffer cells and cholangiocytes. As shown in Figure 1B, the highest levels of mRNA for Chrm1 were detected in hepatocytes, with much lower levels of Chrm1 expression in cholangiocytes and stellate, endothelial, and Kupffer cells. We also detected CHRM1 expression in human hepatocytes (Fig. 1C). These data indicate the M1R is expressed in both mouse and human hepatocytes.
Figure 1.
Expression of M1R in murine and human livers. (A) Representative immunoblots show that M1R is expressed in total liver homogenates from two WT mice but not in two samples from M1R-deficient animals. Murine brain was used as a positive control. (B) qPCR for Chrm1 mRNA in liver cell sub-populations indicates dominant expression in hepatocytes. Results are mean ± S.E.M. * P < 0.05. (C) RT-PCR blot indicates that CHRM1 is expressed in primary human hepatocytes. Human brain mRNA was used as a positive control.
M1R deficiency in mice reduces APAP-induced elevation in serum ALT levels
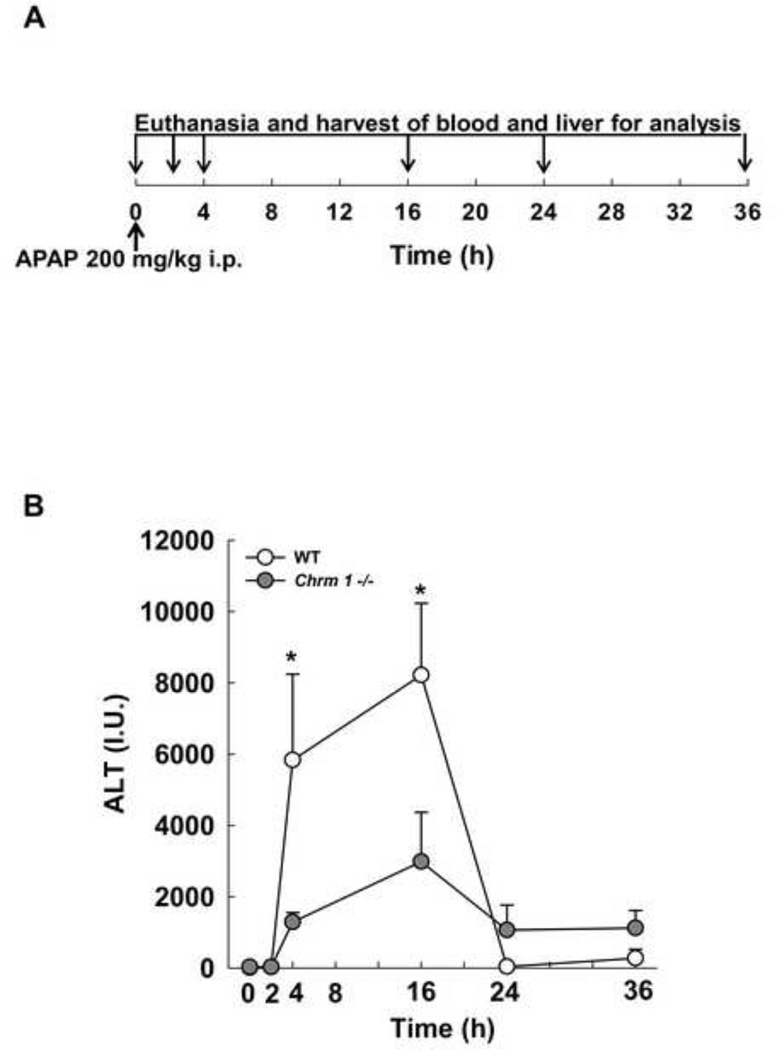
We used a well-established murine model of acetaminophen hepatotoxicity to study the role of M1R in the response to acute liver injury. Figure 2A depicts our study design (see Materials and Methods for details). As shown in Figure 2B, in WT mice after APAP injection, serum ALT increased quickly, peaking at 16 h and normalizing by 24 h. Compared to WT mice, M1R-deficient mice had lower serum ALT levels at 4 and 16 h and lower congestion scores at 16 h (0.6±0.4 in M1R-deficient vs. 3.0±0 in WT mice, p<0.01).
Figure 2.
(A) Study design: Age-matched WT and Chrm1−/− male mice were fasted overnight, treated with intraperitoneal APAP (200 mg/kg) in the morning and euthanized 0, 2, 4, 16, 24 and 36 h later. (B) Serum ALT levels were measured in APAP-treated mice at the indicated time-points (n = 3 mice at 0 h and 5 mice for each group at 2–36 h). Results are mean ± S.E.M., * P < 0.05.
M1R deficiency in mice reduces APAP-induced hepatocyte necrosis
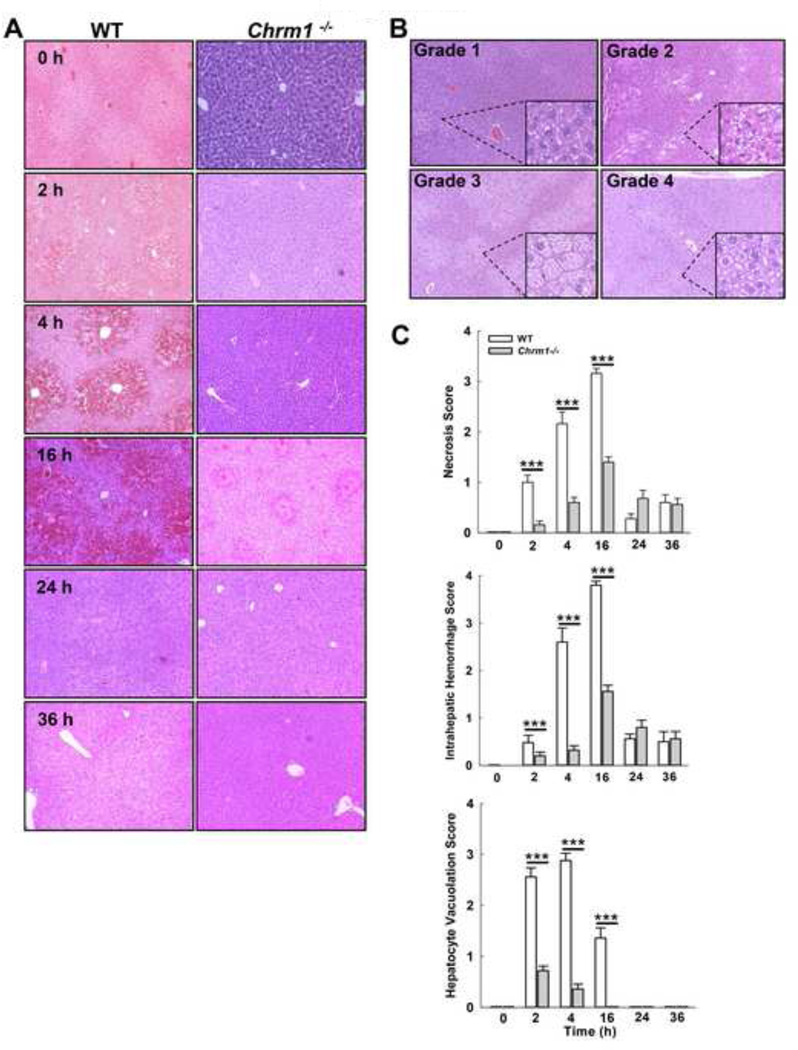
Analysis of H&E-stained liver sections after APAP treatment revealed that M1R-deficient mice had reduced hepatocyte necrosis, intrahepatic hemorrhage and hepatocyte vacuolation compared to WT mice (Fig. 3). Serum ALT levels correlated with hepatocyte necrosis and liver hemorrhage in both Chrm1−/− (r=0.96, p<0.01 and r=0.7, p=0.07) and WT mice (r=0.82, p=0.01 and 0.89, p<0.01). Like serum ALT levels, hepatic injury peaked by 16 h and largely resolved by 24 h. Based on these findings, further analysis focused on earlier time-points, 0 to 16 h.
Figure 3.
Effect of M1R deficiency on APAP-induced hepatocyte injury. (A) Representative photomicrographs (100×) of H&E-stained liver sections from WT and Chrm1−/− mice at indicated time-points. (B) Representative photomicrographs (200×) of vacuolation grades. (C) Summary data show that hepatocyte necrosis, intrahepatic hemorrhage and hepatocyte vacuolation were reduced in Chrm1−/−compared to WT mice (n = 3 mice at 0 h and 5 mice for each group at 2–36 h). Results are mean ± S.E.M., *** P<0.001.
M1R deficiency reduces APAP-induced hepatocyte DNA fragmentation
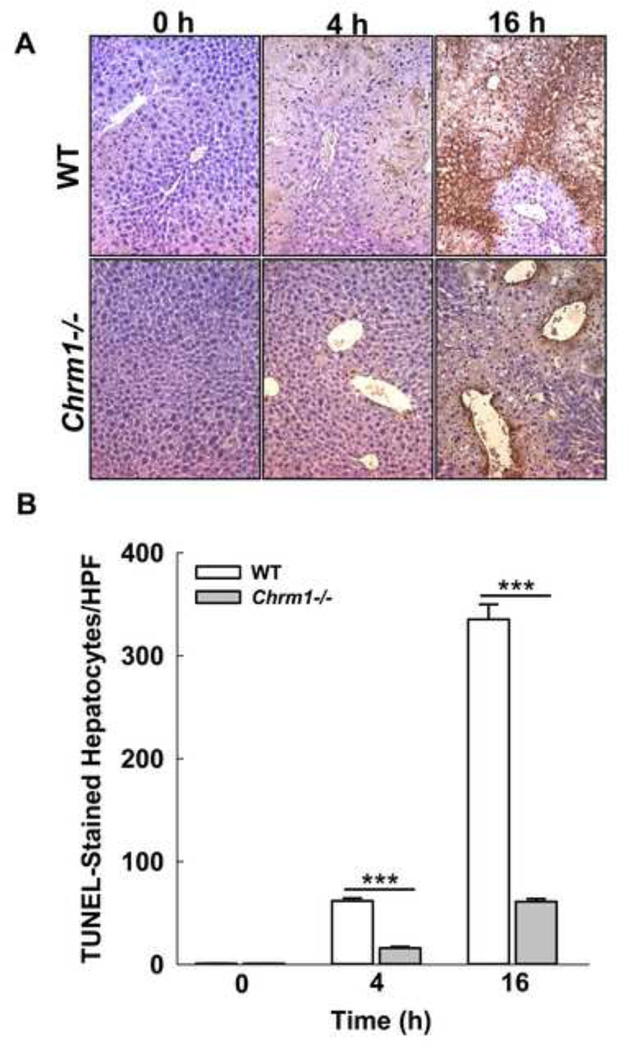
DNA strand breaks are a hallmark of APAP-induced hepatocyte necrosis [38]. To assess DNA fragmentation, we examined TUNEL-stained liver sections from APAP-treated Chrm1−/− and WT mice euthanized at 0, 4 and 16. The numbers of TUNEL-stained hepatocytes were markedly reduced in Chrm1−/− mice at both 4 h and 16 h (Fig. 4) indicating that M1R deficiency reduces APAP-induced DNA fragmentation, consistent with findings from morphometric analysis of H&E-stained liver sections.
Figure 4.
Effect of M1R deficiency on APAP-induced hepatocyte DNA fragmentation. (A) Representative photomicrographs of TUNEL-stained liver sections from WT and Chrm1−/− mice at 0, 4 and 16 h. (B) Summary data show that livers from Chrm1−/−mice had significantly reduced DNA fragmentation compared to livers from WT mice (4 h: 15.9 ± 1.4 vs. 61.7 ± 2.6 stained cells/HPF; 16 h: 61.1 ± 2.8 vs. 335.3 ± 14.6 cells/HPF; n = 3 mice at 0 h and 5 mice for each group at 2–36 h). Results are mean ± S.E.M., *** P<0.001.
M1R deficiency reduces APAP-induced inflammatory cytokine expression
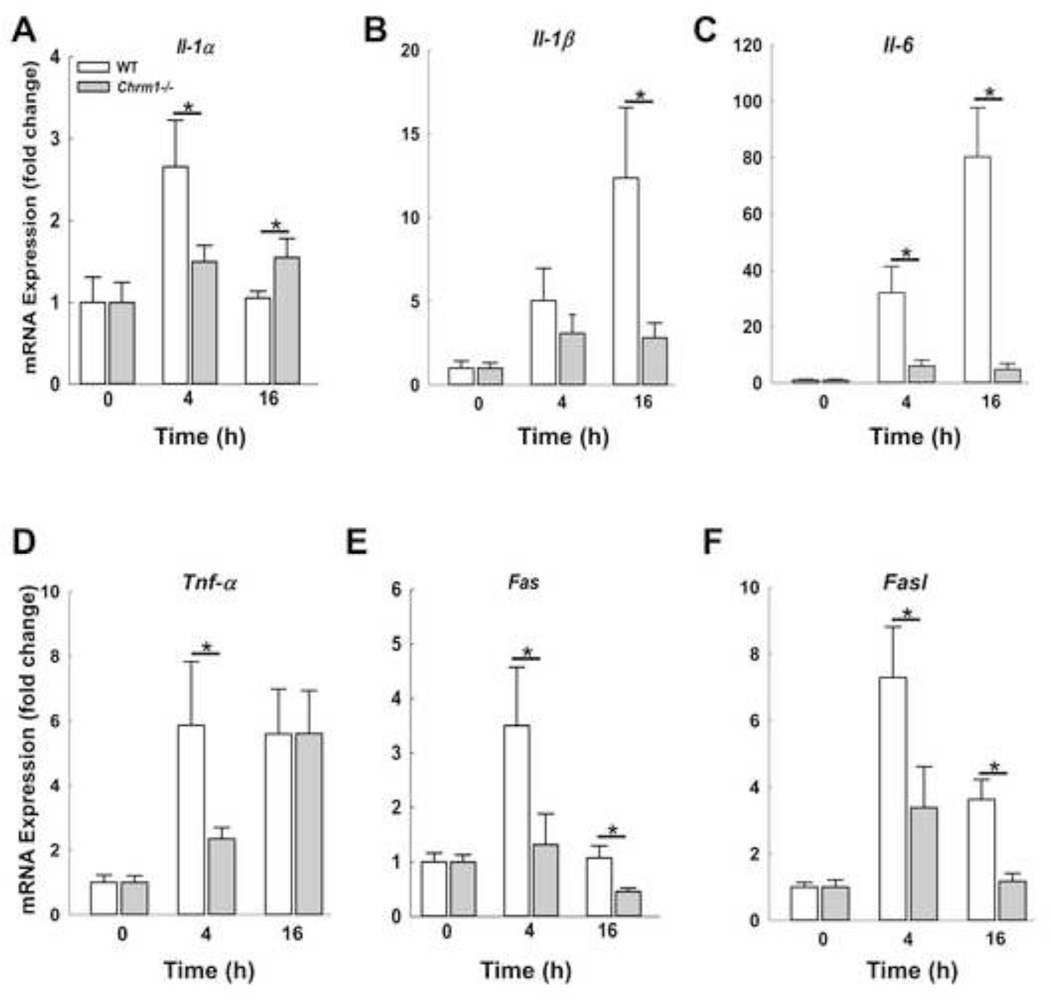
APAP hepatotoxicity is associated with sterile inflammation characterized by expression of various cytokines. Mitochondria release damage-associated molecular pattern (DAMP) molecules and chemokines that recruit inflammatory cells to the liver. Increased expression of inflammatory cytokines including Il-1α, Il-1β, Il-6, Tnf-α and Fasl correlate with increased neutrophil activation and acute liver injury [39, 40]. However, the precise role of cytokines in modulating hepatocyte injury is still under investigation [41]. We assessed the expression of Il-1α, Il-1β, Il-6, Tnf-α, and Fasl, and Fas in mouse livers at early (4 h) and peak injury (16 h). As shown in Figure 5, in WT mice, expression of Il-1α, Fasl and its receptor, peaked at 4 h and declined by 16 h while expression of Il-1β and Il-6 was maximal at 16 h. Expression of mRNA for Tnf-α was similar at both 4 and 16 h. In M1R-deficient compared to WT mouse livers, APAP-induced cytokine expression was significantly blunted at 4 and 16 h, with the sole exception of Tnf-α at 16 h. Overall, these findings were consistent with an attenuated cytokine responses in M1R-deficient mouse livers.
Figure 5.
Effect of M1R deficiency on expression of liver injury cytokines. Hepatic expression of (A) Il-1α, (B) Il-1β, (C) Il-6, (D) Tnf-α and (E) Fas and (F) Fasl was assessed by qPCR at indicated time-points. During the course of injury, the expression of cytokines increased, but to a lesser extent in Chrm1−/− compared to WT mouse livers (n = 3 mice at 0 h and 5 mice for each group at 4 and 16 h). Results are mean ± S.E.M., * P < 0.05.
M1R ablation did not change expression of cytochrome P450 (Cyp), Car and Pxr in mice livers
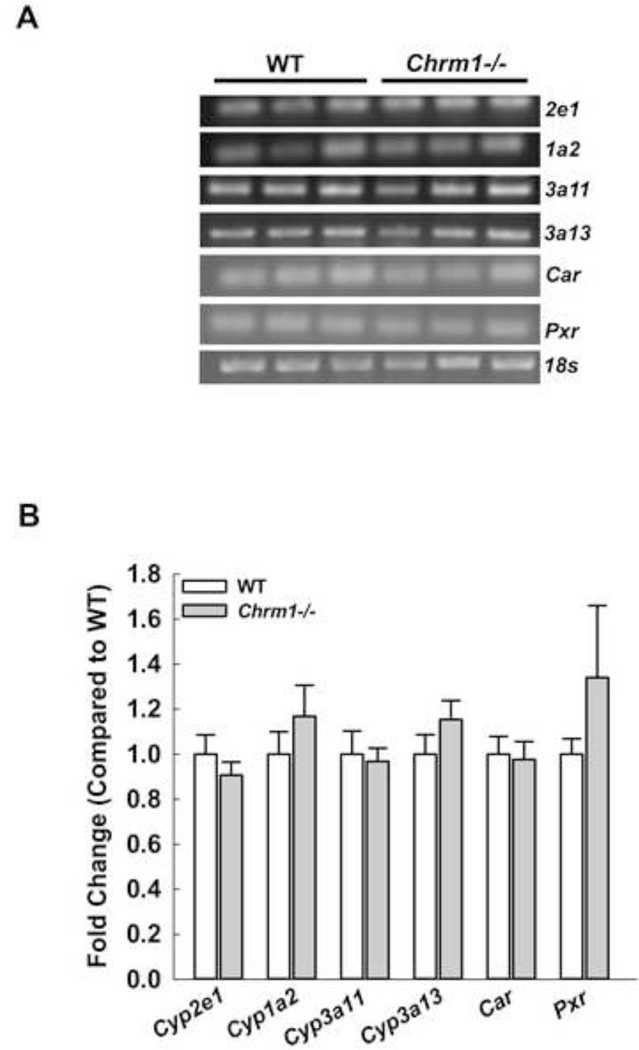
The toxic metabolite of APAP is largely generated by actions of Cyp2e1 and to a lesser extent by 1a2 and others. Mice lacking Cyp2e1 are highly resistant to liver toxicity [42] and mice lacking both Cyp2e1 and Cyp1a2 are almost totally resistant to liver toxicity [43]. To exclude the possibility that M1R-deficiency altered the liver’s ability to metabolize APAP, we measured mRNA expression of Cyp2e1, Cyp1a2, Cyp3a11, Cyp3a13 and their transcriptional regulators Car and Pxr. Expression of these molecules was similar in M1R-deficient and WT mice (Fig. 6), suggesting that M1R ablation does not alter hepatic expression of enzymes needed to metabolize APAP.
Figure 6.
Effect of M1R deficiency on cytochrome P450 expression. (A) RT-PCR blots for cytochrome P450 Cyp2e1, Cyp1a2, Cyp3a11, Cyp3a13, their transcriptional regulators Car and Pxr and 18s from livers of WT and Chrm1−/− mice. (B) Summary data indicate that M1R deficiency did not alter expression of cytochrome P450 or the regulators (n = 3 mice for each group). Results are mean ± S.E.M.
M1R deficiency promotes faster recovery of GSH levels following APAP injury
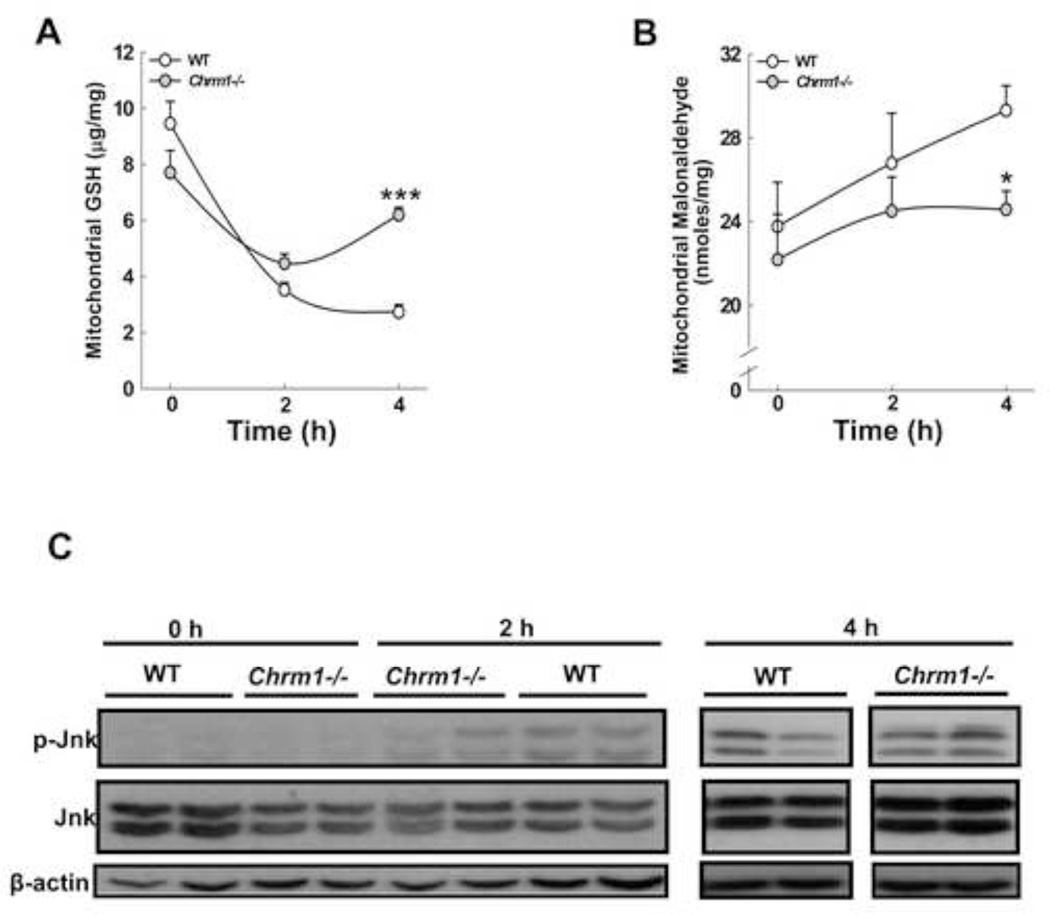
In the course of APAP hepatotoxicity, early GSH depletion, which peaks at 2 h, plays a major role in inducing oxidative stress. To determine the effect of M1R ablation on modulation of hepatotoxicity, we assessed the effects on mitochondrial GSH and lipid peroxidation. In the livers of WT mice, mitochondrial GSH levels decreased markedly by 4 h. In contrast, in the livers of Chrm1−/− mice, the decrease in GSH was blunted and GSH levels recovered by 4 h (Fig. 7A). In WT mice we observed a marginal increase in lipid peroxidation after APAP injection that was consistent with previous studies which indicated that lipid peroxidation plays only a limited role in APAP hepatotoxicity [44]. Nonetheless, lipid peroxidation was diminished in M1R-deficient compared to WT mice (Fig. 7B).
Figure 7.
Effect of M1R deficiency on GSH depletion, lipid peroxidation and Jnk activation. (A) GSH content in mitochondrial fractions was assayed at 0, 2 and 4 h. (B) At the same time-points, lipid peroxidation was determined by measuring malondialdehyde generation (n = 3 mice at 0 h, and 5 mice for each group at 2 and 4 h). Results are mean ± S.E.M., * P < 0.05, *** P<0.001. (C) Representative immunoblots for phospho-Jnk, total Jnk and β-actin (loading control) in mouse livers assessed at 0, 2 and 4 h after APAP injection (n = 2 mice for each group). Compared to WT, p-Jnk was reduced in Chrm1−/− mice livers only at 2 h.
M1R ablation and APAP-induced Jnk activation
In the course of APAP-induced hepatotoxicity, Jnk is activated following GSH depletion and translocates to mitochondria where it promotes peroxynitrite generation. We observed that 2 h after APAP injection Jnk phosphorylation was reduced in livers of M1R-deficient compared to WT mice but by 4 h Jnk phosphorylation was similar among all mice (Fig. 7C). Jnk activation was not detected at 16 h (not shown). Together, these data suggest that despite the absence of sustained differences in levels of Jnk activation, M1R deficiency curbed APAP-induced liver injury.
M1R deficiency reduces APAP-induced peroxynitrite generation
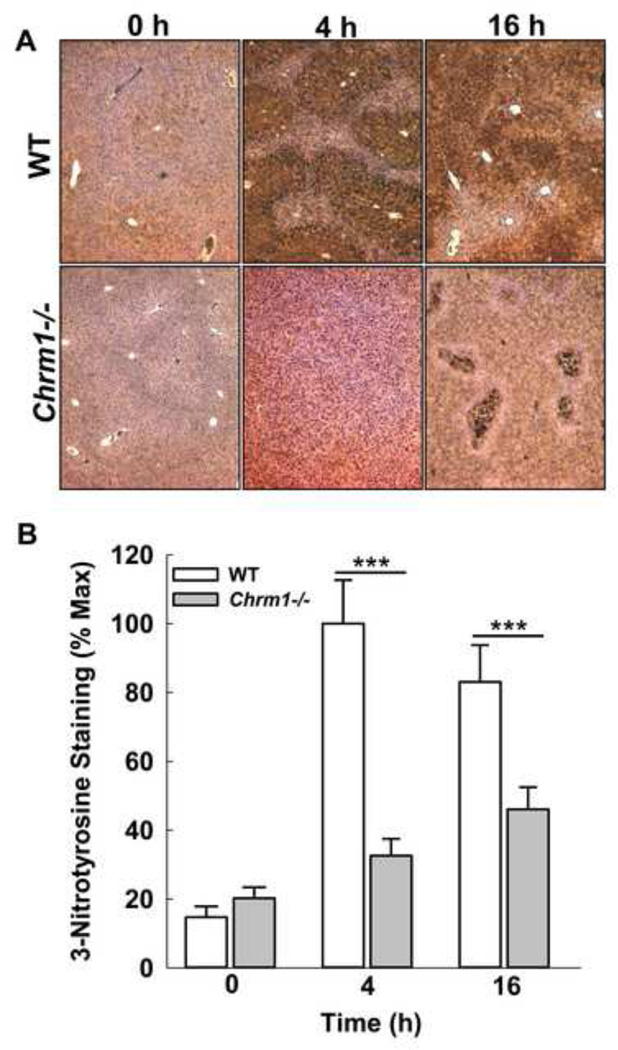
Activation of Jnk promotes peroxynitrite generation, a major cause of oxidative stress in APAP hepatotoxicity [45]. Peroxynitrite is generally detoxified by GSH whose depletion promotes protein nitration. To determine the impact of M1R ablation on peroxynitrite generation, liver sections were stained for nitrotyrosine adducts using anti-3-nitrotyrosine (3-NT) antibody. Compared to those from WT mice, liver sections from Chrm1−/− mice had reduced 3-NT staining at both 4 and 16 h (Fig. 8). These data indicate that despite similar Jnk activation, peroxynitrite generation was reduced in Chrm1−/− mice livers. Collectively, these data indicate that GSH recovery in Chrm1−/− mice is most likely responsible for reduced injury.
Figure 8.
Effect of M1R deficiency on APAP-induced peroxynitrite generation. Representative photomicrographs of 3-NT-stained liver sections from WT and Chrm1−/− mice at 0, 4 and 16 h. (B) Summary data indicated that livers from Chrm1−/− mice had significantly reduced nitrotyrosine adduct formation at both 4 and 16 h (n = 3 mice at 0 h, and 5 mice for each group at 4 and 16 h). Results are mean ± S.E.M., *** P<0.001.
M1R deficiency augments induction of cytoprotective genes
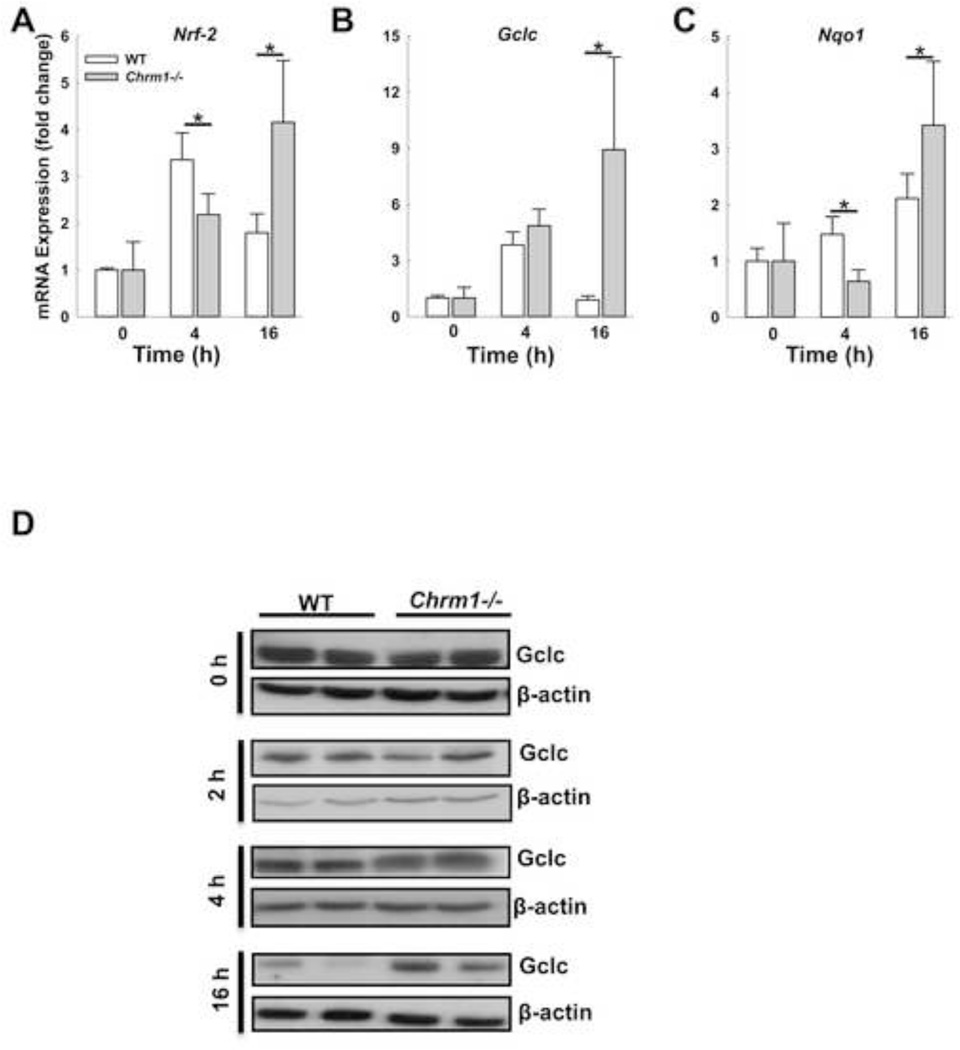
Nrf-2, an oxidative stress-sensitive transcription factor, modulates APAP-induced liver injury by regulating the expression of cytoprotective genes such as Nqo1 and Gclc [46]. To determine if Nrf-2 plays a role in M1R-mediated regulation of APAP hepatotoxicity, we assessed the expression of Nrf-2, Nqo1 and Gclc in mouse livers. In WT mice expression of Nrf-2 and Gclc increased by 4 h but decreased by 16 h, while the expression of Nqo1 increased two-fold by 16h (Fig. 9A–C). In Chrm1−/− mouse livers, the expression of Nrf-2, Gclc and Nqo1 was greatest at 16 h and more than that observed in WT mouse livers (Fig. 9A–C).
Figure 9.
Effect of M1R deficiency on transcription of Nrf-2 and Nrf-2-induced cytoprotective genes. In mouse livers, Nrf-2, Gclc and Nqo1 expression was determined by qPCR 0, 4 and 16 h after APAP injection. In the livers of WT mice, transcription of (A) Nrf-2 and (B) Gclc increased by 4 h and declined by 16 h. In livers of Chrm1−/− mice, transcription of (A) Nrf-2, (B) Gclc and (C) Nqo1 was greatest at 16 h when it exceeded that observed in WT mice (n = 3 mice at 0 h, and 5 mice at 4 and 16 h for each group). (D) Immunoblots show Gclc expression in livers from WT and Chrm1−/− mice at 0, 2, 4 and 16 h. β-actin was used as a loading control (two blots for each group are shown). Four h after APAP injection, Gclc expression was enhanced in livers from Chrm1−/− compared to those from WT mice. By 16 h, Gclc expression was reduced but remained higher in livers from Chrm1−/− mice. Results are mean ± S.E.M., * P<0.05 and ** P<0.01.
Since Gclc is the key enzyme involved in hepatic GSH synthesis, we further assessed Gclc protein expression by immunoblotting. As shown in Figure 9D, M1R deficiency alone did not alter Gclc protein expression (0 h). However, after APAP injection, while there was no difference at 2 h, at 4 h GCLC expression was greater in livers from Chrm1−/− compared to those from WT mice. At the peak of liver injury, 16 h after APAP injection, Gclc protein expression was markedly reduced in livers from both genotypes, but was nearly two-fold greater in Chrm1−/− compared to WT mouse livers (Fig. 9D). These data explain the recovery of GSH levels at 4 h, and provide a likely explanation for reduced APAP-induced liver injury in Chrm1−/− mice at both 4 and 16 h.
M1R inhibition reduces oxidative stress in vitro
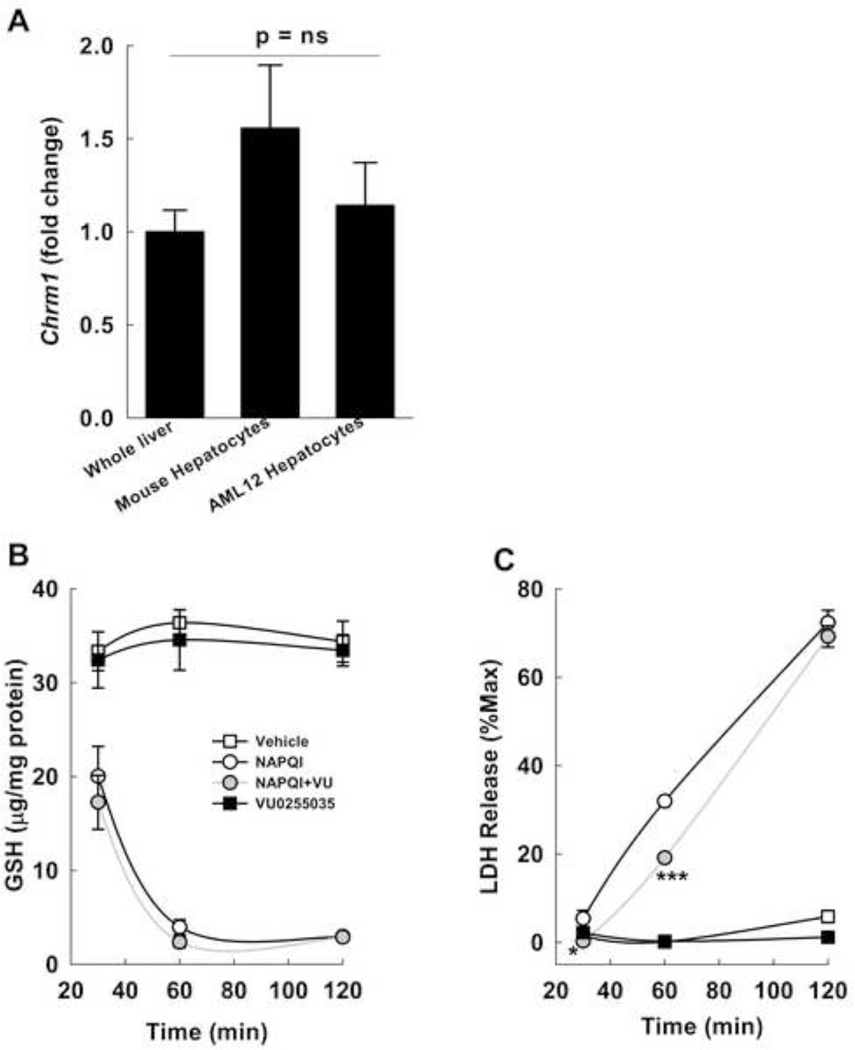
To confirm the role of hepatocyte M1R in modulating the response to oxidative stress, we assessed the effects of VU0255035, a novel M1R antagonist [37], on oxidative injury in AML12 hepatocytes. We verified that M1R expression in AML12 cells was similar to that in primary mouse hepatocytes and whole mouse liver (Fig. 10A).
Figure 10.
Effect of inhibiting M1R on NAPQI-induced oxidative stress. (A) Chrm1 expression in whole mouse liver, isolated mouse hepatocytes and non-transformed murine AML12 hepatocytes was assessed by PCR. Expression of M1R mRNA in AML12 hepatocytes was similar to that in mouse livers and isolated primary mouse hepatocytes. (B) Effect of VU0255035, a selective M1R antagonist, on NAPQI-induced GSH depletion in AML12 hepatocytes. AML12 hepatocytes were incubated for 2 h with vehicle (DMSO), 200 µM NAPQI, 1 µM VU0255035, and NAPQI plus VU0255035 and GSH was measured at 30, 60 and 120 min. (C) Effect of VU0255035 on cell death was assessed by measuring LDH in the culture media at 30, 60 and 120 min after incubation. Treatment with 1 µM VU0255035 significantly reduced NAPQI-induced LDH release at 30 and 60 min. Treatment with VU0255035 alone or vehicle had no effect. Cell lysis control was provided by the manufacturer and results are expressed as a percentage of this positive control (% Max). All treatments were performed in triplicate. Results are mean ± S.E.M. * P = 0.05, *** P < 0.001.
NAPQI is a key early mediator of APAP-induced toxicity. We assessed the effect of inhibiting M1R on NAPQI-induced GSH depletion and cell viability. NAPQI (200 µM) was highly toxic to AML12 cells and reduced GSH levels drastically within 2 h. While treatment with 1 µM VU0255035 did not alter GSH depletion (Fig. 10B), it reduced NAPQI-induced LDH release at both 30 (P=0.05) and 60 min (Fig. 10C). By 2 h NAPQI was equally and highly toxic to cells incubated with and without VU0255035. In view of the GSH depletion in livers from APAP-treated Chrm1−/− mice, these data indicate that M1R inhibition does not alter NAPQI-dependent GSH quenching yet confers cytoprotective effects by other mechanisms.
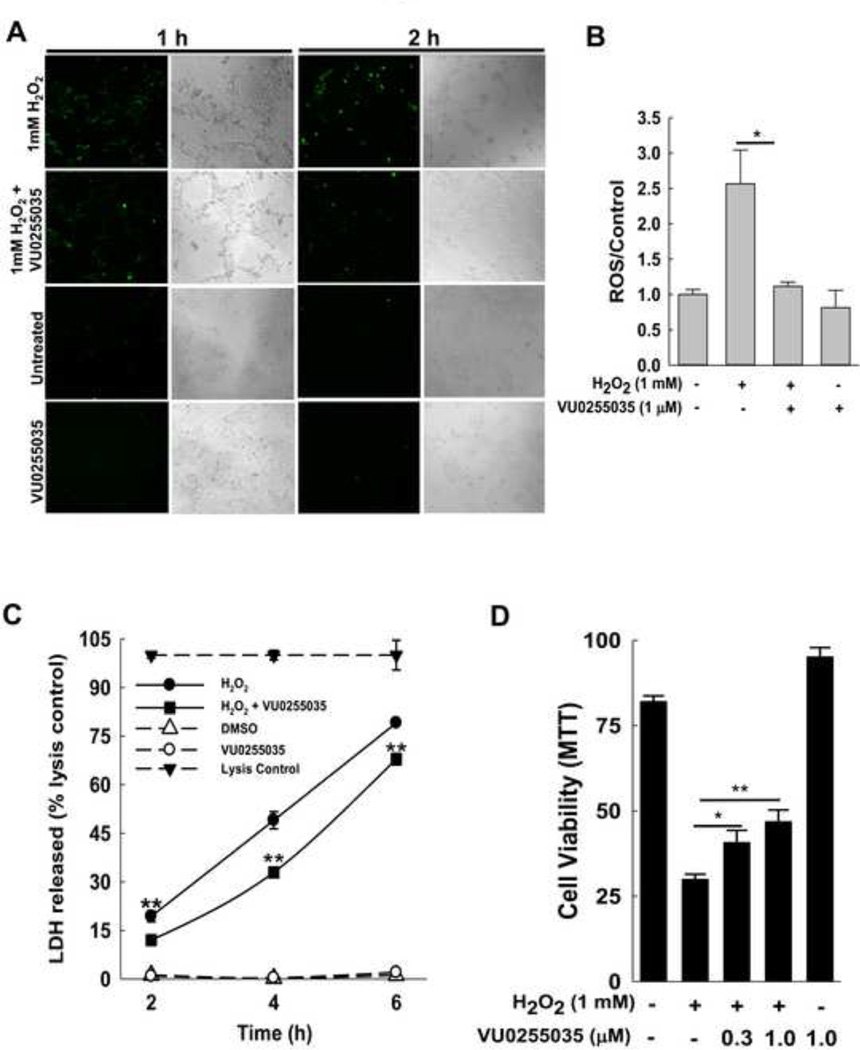
H2O2 is a major mediator of APAP-induced oxidative stress [25], and previous studies showed that 1 mM H2O2 induces hepatocyte necrosis in vitro [47, 48]. To determine the effect of M1R inhibition on intracellular oxidative stress in H2O2-treated AML12 cells, we first used confocal microscopy to assess oxidation of 2',7'-dichlorodihydrofluorescein diacetate to fluorescent DCF (green). Enhanced green fluorescence following treatment with 1 mM H2O2 was reduced by incubating cells with 1 µM VU0255035 for 1–2 h (Fig. 11A). We next used the CellROX green reagent to measure generation of ROS. Treatment with 1 µM VU0255035 for 2 h reduced H2O2-mediated ROS generation (Fig. 11B).
Figure 11.
Effect of inhibiting M1R on H2O2-induced oxidative stress in AML-12 hepatocytes. (A) Effect of VU0255035, a selective M1R antagonist, on H2O2-mediated oxidative stress in AML12 hepatocytes. AML12 hepatocytes were incubated for 1 and 2 h with vehicle (0.001% DMSO), 1 mM H2O2, 1 µM VU0255035, and H2O2 plus VU0255035. Cells were assayed for oxidative stress by confocal microscopy to assess oxidation of DCFH-DA to green fluorescent DCF. Representative photomicrographs indicate that AML12 hepatocytes co-treated with H2O2 plus VU0255035 had attenuated green fluorescence compared to cells treated with H2O2 alone. VU0255035 and vehicle (DMSO) alone did not alter fluorescence. Paired phase contrast images are shown. All treatments were performed in triplicate. (B) Effect of VU0255035 on H2O2-mediated oxidative stress in AML12 hepatocytes was confirmed using CellRox green reagent. AML12 hepatocytes were incubated for 2 h with vehicle (0.001% DMSO), 1 mM H2O2, 1 µM VU0255035, and H2O2 plus VU0255035. Cells were assayed for oxidative stress by assessing fluorescence normalized to viable cells. AML12 hepatocytes co-treated with H2O2 plus VU0255035 had attenuated fluorescence compared to cells treated with H2O2 alone. All treatments were performed in triplicate. (C) Effect of VU0255035 on cell death was assessed by measuring LDH released in the cell culture media 2, 4 and 6 h after incubation. Treatment with VU0255035 (1 µM) significantly reduced H2O2-induced LDH release. Treatment with VU0255035 or vehicle alone had no effect. A cell lysis control provided by the manufacturer was used for each time-point. (D) Effect on AML12 hepatocyte survival was assessed using the MTT assay. Incubation with 1 mM H2O2 for 6 h markedly reduced AML12 cell survival. Treatment with VU0255035 (0.3–1 µM) significantly enhanced cell survival. Treatment with VU0255035 alone had no effect. Results are mean ± S.E.M. * P<0.05 and ** P<0.01.
M1R inhibition enhances cell viability in vitro
To determine the effect of inhibiting M1R on H2O2-mediated cell death, LDH release was assessed in cells treated with 1 mM H2O2, alone and in the presence of 1 µM VU0255035. DMSO, the solvent for VU0255035, was added to all samples. As shown in Fig. 11C, treatment with VU0255035 (1 µM for 2–6 h) significantly reduced LDH release; incubation with VU0255035 alone had no effect. Using the MTT assay in hepatocytes incubated with H2O2, we found that treatment with VU0255035 (0.3 and 1 µM for 6 h) enhanced cell survival (Fig. 11D).
M1R inhibition prevents H2O2-mediated GSH depletion in vitro
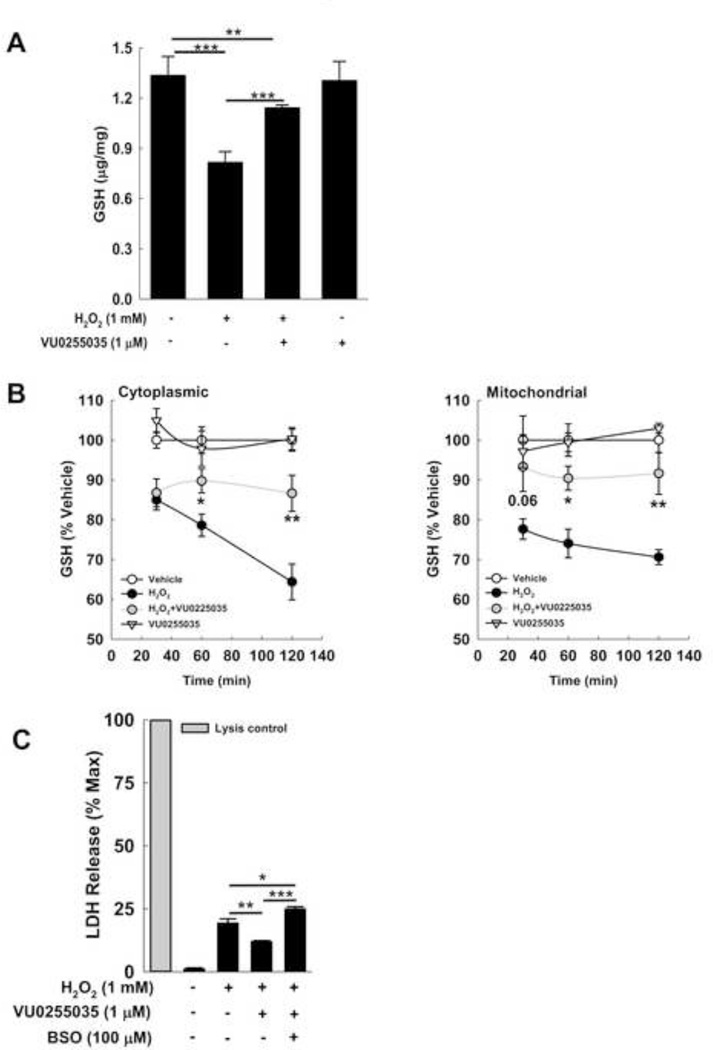
To assess the effect of inhibiting M1R on H2O2-mediated GSH depletion, we treated cells with 1 mM H2O2, alone and in the presence of 1 µM VU0255035. DMSO, the solvent for VU0255035, was added to all samples. Two-hour treatment with 1 µM VU0255035 prevented GSH depletion (Fig. 12A). To understand the impact on GSH kinetics, we assessed the effects of inhibiting M1R at early time points (30, 60 and 120 min) in both cytosolic and mitochondrial fractions (Fig. 12B). Unlike our findings with NAPQI, VU0255035 treatment prevented the decline in GSH in cytoplasmic and mitochondrial fractions. At 30 min, M1R inhibition did not alter cytoplasmic GSH content while preventing depletion of mitochondrial GSH, a finding that nearly achieved statistical significance. By 60 and 120 min, inhibiting M1R prevented the decline in GSH levels in both cytoplasmic and mitochondrial fractions. These data suggest that modulatory effects of M1R activity on hepatocyte stress vary according to the type of oxidative stimulant.
Figure 12.
Effect of inhibiting M1R on H2O2-mediated GSH depletion. (A) Effect of a highly selective M1R inhibitor, VU0255035, on H2O2-induced GSH depletion. In AML12 hepatocytes, GSH was measured 2 h after incubation with 1 mM H2O2. Compared to cells treated with vehicle (DMSO) alone, GSH levels were significantly reduced in H2O2-treated cells. Co-treatment with 1 µM VU0255035 prevented GSH depletion. In the absence of H2O2, VU0255035 had no effect. (B) To assess further the impact on GSH kinetics, we measured the effect of 1 µM VU0255035 on changes in GSH content in mitochondrial and non-mitochondrial (cytoplasmic) fractions of cells after 30-, 60- and 120-min treatment with H2O2. In both mitochondrial and cytoplasmic fractions treatment with VU0255035 prevented GSH depletion; the effect appeared more pronounced in the mitochondrial fraction. (C) Effect of GCLC inhibition on cytoprotective effects of VU0255035. AML12 cell were exposed to vehicle alone, H2O2 alone, and H2O2 plus VU0255035, with or without pre-incubation with BSO (100 µM) for 18 h. Pre-incubating cells with BSO abolished the effects of VU0255035 on LDH release. Results are mean ± S.E.M. * P<0.05, ** P<0.01 and *** P<0.001.
Finally, we assessed the effect of GCLC inhibition on VU0255035-mediated cytoprotection. We measured the effect of 1 µM VU0255035 on 1 mM H2O2-induced LDH release from cells pre-treated with or without 100 µM BSO (a GCLC inhibitor) for 18 h. VU0255035-mediated cytoprotection was lost in cells pre-incubated with BSO; LDH release from these cells was similar to that from cells treated with 1 mM H2O2 alone (Fig. 12C). These findings support a major mechanistic role for GSH in M1R inhibitor-induced cytoprotection. Collectively, these in vitro data are consistent with our in vivo findings and support an important role for M1R in modulating anti-oxidant responses.
Discussion
Previously we demonstrated that M3R are expressed in the liver and that M3R deficiency in mice enhances chronic liver injury [18]. These findings provided the first evidence that muscarinic receptors may play an important role in modulating liver injury, and provided strong evidence that M3R expression and activation in particular protect the liver from injury. The present work indicates, surprisingly, an opposite role for M1R; M1R expression appears to enhance acute liver injury. Key observations support this conclusion. In mice treated with a toxic dose of APAP, M1R deficiency is associated with: (1) reduced hepatocyte necrosis, intrahepatic hemorrhage and serum ALT levels; (2) reduced hepatic expression of injury cytokines; (3) reduced hepatocyte DNA fragmentation; (4) enhanced recovery of liver GSH levels; (5) reduced liver peroxynitrite generation; (6) increased liver transcription of Nrf-2, Nqo1 and Gclc; and (7) preserved hepatic Gclc expression. Moreover, selectively inhibiting M1R activation in AML12 hepatocytes reduced H2O2-induced oxidative stress and GSH depletion, and promoted cell survival.
APAP is a commonly used over-the-counter analgesic [49]. When ingested at recommended doses, APAP is a safe and effective, however it can cause severe liver injury at higher doses. APAP hepatotoxicity is one of the most common causes of liver injury [50]. Each year in the U.S., APAP overdose results in more than 50,000 emergency room visits and more than 25,000 hospitalizations [51, 52]. N-acetyl-cysteine (NAC), the lone antidote, is effective only when administered early after overdose. NAC replenishes GSH to scavenge reactive metabolites and prevent the activation of the necrosis signaling cascade i.e. Jnk activation, peroxynitrite generation and mitochondrial damage—events that lead to loss of mitochondrial membrane potential, release of endonucleases and hepatocyte DNA fragmentation [23, 24]. Since APAP hepatotoxicity in mice mimics that in humans, we investigated the role of M1R in modulating APAP-induced liver injury by assessing the effects of M1R deficiency on key events in necrosis signaling.
Early in APAP liver injury, hepatocyte GSH scavenge NAPQI and peroxynitrite. Consistent with previous reports, we observed that after APAP injection, hepatic GSH continued to decline in WT but not M1R-deficient mice. In other cell types, M1R stimulation was shown to enhance Jnk activation and, despite GSH depletion, inhibition of Jnk, is known to prevent APAP hepatotoxicity [25, 53]. Thus, we hypothesized that M1R ablation would reduce Jnk activation. Contrary to our expectations, after APAP treatment Jnk phosphorylation was similar in livers from WT and M1R-deficient mice. Nonetheless, nitrotyrosine adduct formation was reduced in the livers of Chrm1−/− mice. Taken together, these data suggest that in M1R deficiency had minimal impact on Jnk activation and that the reduced peroxynitrite generation and liver injury were most likely consequences of enhanced GSH recovery.
In APAP hepatotoxicity, oxidative stress activates transcription factors that induce genes with anti-oxidant stress response elements e.g. Nrf-2 induces expression of Gclc and Nqo1 [54, 55]. Nrf-2 knockout mice exhibit enhanced APAP hepatotoxicity [56], whereas increased activation of Nrf-2 is protective [46, 57, 58]. In our study, APAP hepatotoxicity was associated with early induction of Nrf-2 as well as Gclc and Nqo1; which declined in WT mice by 16 h but continued to increase in Chrm1−/− mice. Within 4 h of APAP injection, despite similar increases in Gclc mRNA, Gclc protein expression was enhanced only in livers from Chrm1−/− mice. We were surprised by this finding, nonetheless it explains the GSH recovery observed in Chrm1−/−mice by 4 h. Although the mechanism underlying this finding is as yet uncertain, we speculate it may result from Gclc mRNA stabilization in Chrm1−/− mice. Although Gclc protein expression declined by 16 h, it remained 2-fold greater in livers from Chrm1−/− mice compared to those from WT mice. These findings indicate that M1R deficiency enabled hepatocytes to handle APAP-induced oxidative stress by sustained activation of Nrf-2-sensitive signaling, thereby reducing late liver injury.
Finally, to confirm the role of hepatocyte M1R in modulating oxidative stress, we assessed the effects of VU0255035, a novel M1R antagonist, on oxidative injury in AML12 cells. VU0255035 has >75-fold selectivity for M1R over other muscarinic receptor subtypes (M2R–M5R) [37]. AML12 are non-transformed hepatocytes derived from a mouse transgenic for human TGF-α. Compared to mouse livers, AML12 cells express cyp2e1 in markedly low levels (ΔCT 17 vs. −1 respectively, p<0.001). Since Cyp2e1 is the major enzyme required to metabolize APAP to toxic metabolites, we used NAPQI and H2O2, major mediators of APAP-induced liver injury [25, 28], instead of APAP to assess the effects of inhibiting M1R activation.
Pharmacological inhibition of M1R in AML12 cells did not alter NAPQI-induced GSH depletion. GSH depletion and H2O2 generation precede Jnk activation [25], which was similar in Chrm1−/− and WT mice. Collectively, these data indicate that inhibiting M1R did not alter early GSH depletion. Although, inhibiting M1R in AML12 cells did not alter NAPQI-induced GSH depletion, it attenuated LDH release at both 30 and 60 min, thereby indicating GSH-independent protection from NAPQI-induced oxidative stress.
In contrast to its effects on NAPQI treatment, inhibiting M1R prevented H2O2-induced GSH depletion, oxidative stress and LDH release (Fig 12 A & B). The protective effect of inhibiting M1R on H2O2-induced LDH release was lost in cells pre-incubated with BSO (Fig. 12C). Based on these findings, we conclude that while inhibiting M1R reduces oxidative stress by regulating Gclc expression, other anti-oxidant mechanisms are also activated and contribute to reduced cellular injury (e.g. upregulation of NQO1 expression in APAP-treated Chrm1−/−mice). Hence, changes in GSH levels may not be reliable as a sole indicator of the oxidative state. Collectively, these experiments confirmed that pharmacological inhibition of M1R activity in vitro reduced oxidative stress-induced injury, an effect similar to that observed with M1R deficiency in vivo.
The role of immune response in regulating APAP-induced liver injury is controversial [59–61]. While APAP-induced hepatotoxicity is consistently associated with increased expression of inflammatory cytokines, the role of specific cytokines in modulating hepatocyte injury is not well understood. We observed that livers from Chrm1−/− mice had reduced APAP-induced expression of inflammatory cytokines. Moreover, histological analysis of H&E-stained liver sections revealed that 4 and 16 h after APAP injection, infiltration of neutrophils was reduced in Chrm1−/− compared to WT mice (data not shown). Based on these findings and the kinetics of changes in GSH, Nrf-2 and Gclc, we believe that reduced expression of inflammatory cytokines in livers of M1R-deficient mice is a consequence and not the cause of reduced injury.
While our study demonstrates a role for M1R in modulating hepatocyte injury, it has limitations. In our in vivo experiments we used a sub-lethal dose of APAP (200 mg/kg) which did not allow us to obtain survival data regarding the benefits of M1R deficiency. Nonetheless, hepatocyte necrosis was observed to a lesser extent in Chrm1−/− compared to WT mice. In vitro, inhibiting M1R activation attenuated but did not abolish cell death following doses of H2O2 that induce non-reversible hepatocyte necrosis. In future studies, to gauge the therapeutic potential of targeting M1R we will use higher doses of APAP and assess the survival benefits of ablating M1R expression and treating mice with chemical inhibitors of M1R activation.
We will also attempt to elucidate the molecular mechanisms whereby M1R deficiency and inhibition induce Nrf-2 and Gclc expression, thereby hastening recovery of GSH levels. M1R, like M3R, trigger intracellular signaling via Gq/11 and PLC activation; see reference [62] for details. Although little is known about the constitutive activity of M1R [35, 63] the present results suggest that selectively stimulating M1R activation would worsen APAP-induced liver toxicity. Whereas it would be of interest to confirm this speculation, M1R-selective agonists are not currently available; like acetylcholine, currently available MR agonists are non-selective and activate all five muscarinic receptors (M1R–M5R).
In summary, although a role for GPCRs in modulating apoptosis is well-established, herein we provide novel evidence that a GPCR can also modulate necrotic liver injury. To our knowledge, this is the first report of GPCR-mediated modulation of APAP hepatotoxicity. Our findings indicate that by promoting GSH recovery, sustaining up-regulated Nrf-2 expression, and enhancing Gclc expression, either M1R deficiency or inactivation attenuate oxidative liver injury. The therapeutic potential of these observations remains to be determined.
Highlights.
M1 muscarinic receptors (M1R) are expressed in mouse and human hepatocytes.
M1R deficiency in mice ameliorates acetaminophen-induced liver injury.
M1R-deficient mice mounted anti-oxidant response to acute liver injury.
Inhibition of M1R in AML12 cells in vitro attenuated H2O2-induced injury.
M1R is a potential target to treat acute toxic liver injury.
Acknowledgements
We thank Dr. Hongbing Wang (University of Maryland School of Pharmacy) for providing human primary hepatocyte mRNA, Dr. Neeraj Saxena (University of Maryland School of Medicine) for technical assistance with RT-PCR, Dr. Gianfranco Alpini (Texas A&M University) for providing mouse cholangiocytes and Dr. Michael Duncan (Georgia Regents University) for providing AML12 cells. We also thank Dr. Jürgen Wess (NIH, NIDDK) for providing the M1 receptor mutant mice. This work was supported by the National Institutes of Health (Grant T32-DK067872, K08-DK081479) and the Baltimore Research and Education Foundation (S.K.).
Abbreviations
- APAP
Acetaminophen
- ALT
Alanine aminotransferase
- BSO
Buthionine sulfoximine
- DTNB
Dithiobis-2-nitrobenzoic acid
- Gclc
Glutamate cysteine ligase catalytic subunit
- GPCR
G-protein coupled receptor
- HPF
High Power Field
- Il
Interleukin
- JNK
c-Jun N-terminal kinase
- M1R
M1 muscarinic receptors
- M3R
M3 muscarinic receptors
- NAPQI
N-acetyl-p-benzoquinone imine
- NAC
N-acetyl-cysteine
- Nqo1
NAD(P)H dehydrogenase, quinone 1
- 3-NT
3-Nitrotyrosine
- NO
Nitric oxide
- Nrf-2
Nuclear factor, erythroid derived 2, like 2
- PVDF
Polyvinylidene fluoride
- PBST
Phosphate buffered saline with tween 20
- ROS
Reactive Oxygen Species
- S.E.M.
Standard error of the mean
- TUNEL
Terminal deoxynucleotidyl transferase dUTP nick end labeling
- Tnf
Tumor necrosis factor
- VIP
Vasoactive intestinal polypeptide
- WT
Wild-type
Footnotes
Publisher's Disclaimer: This is a PDF file of an unedited manuscript that has been accepted for publication. As a service to our customers we are providing this early version of the manuscript. The manuscript will undergo copyediting, typesetting, and review of the resulting proof before it is published in its final citable form. Please note that during the production process errors may be discovered which could affect the content, and all legal disclaimers that apply to the journal pertain.
References
- 1.Kaminski DL, Dorighi J, Jellinek M. Effect of electrical vagal stimulation on canine hepatic bile flow. The American journal of physiology. 1974;227:487–493. doi: 10.1152/ajplegacy.1974.227.2.487. [DOI] [PubMed] [Google Scholar]
- 2.Jackson PA, Cardin S, Coffey CS, Neal DW, Allen EJ, Penaloza AR, Snead WL, Cherrington AD. Effect of hepatic denervation on the counterregulatory response to insulin-induced hypoglycemia in the dog. American journal of physiology. Endocrinology and metabolism. 2000;279:E1249–E1257. doi: 10.1152/ajpendo.2000.279.6.E1249. [DOI] [PubMed] [Google Scholar]
- 3.Marzioni M, LeSage GD, Glaser S, Patel T, Marienfeld C, Ueno Y, Francis H, Alvaro D, Tadlock L, Benedetti A, Marucci L, Baiocchi L, Phinizy JL, Alpini G. Taurocholate prevents the loss of intrahepatic bile ducts due to vagotomy in bile duct-ligated rats. American journal of physiology. Gastrointestinal and liver physiology. 2003;284:G837–G852. doi: 10.1152/ajpgi.00398.2002. [DOI] [PubMed] [Google Scholar]
- 4.Shimazu T. Regulation of glycogen metabolism in liver by the autonomic nervous system. V. Activation of glycogen synthetase by vagal stimulation. Biochimica et biophysica acta. 1971;252:28–38. doi: 10.1016/0304-4165(71)90089-4. [DOI] [PubMed] [Google Scholar]
- 5.Kiba T, Tanaka K, Endo O, Inoue S. Role of vagus nerve in increased DNA synthesis after hypothalamic ventromedial lesions in rat liver. The American journal of physiology. 1992;262:G483–G487. doi: 10.1152/ajpgi.1992.262.3.G483. [DOI] [PubMed] [Google Scholar]
- 6.Tanaka K, Ohkawa S, Nishino T, Niijima A, Inoue S. Role of the hepatic branch of the vagus nerve in liver regeneration in rats. The American journal of physiology. 1987;253:G439–G444. doi: 10.1152/ajpgi.1987.253.4.G439. [DOI] [PubMed] [Google Scholar]
- 7.Ohtake M, Sakaguchi T, Yoshida K, Muto T. Hepatic branch vagotomy can suppress liver regeneration in partially hepatectomized rats. HPB surgery : a world journal of hepatic, pancreatic and biliary surgery. 1993;6:277–286. doi: 10.1155/1993/59691. [DOI] [PMC free article] [PubMed] [Google Scholar]
- 8.Kiba T, Tanaka K, Numata K, Hoshino M, Inoue S. Facilitation of liver regeneration after partial hepatectomy by ventromedial hypothalamic lesions in rats. Pflugers Archiv : European journal of physiology. 1994;428:26–29. doi: 10.1007/BF00374748. [DOI] [PubMed] [Google Scholar]
- 9.LeSag EG, Alvaro D, Benedetti A, Glaser S, Marucci L, Baiocchi L, Eisel W, Caligiuri A, Phinizy JL, Rodgers R, Francis H, Alpini G. Cholinergic system modulates growth, apoptosis, and secretion of cholangiocytes from bile duct-ligated rats. Gastroenterology. 1999;117:191–199. doi: 10.1016/s0016-5085(99)70567-6. [DOI] [PubMed] [Google Scholar]
- 10.Cassiman D, Libbrecht L, Sinelli N, Desmet V, Denef C, Roskams T. The vagal nerve stimulates activation of the hepatic progenitor cell compartment via muscarinic acetylcholine receptor type 3. The American journal of pathology. 2002;161:521–530. doi: 10.1016/S0002-9440(10)64208-3. [DOI] [PMC free article] [PubMed] [Google Scholar]
- 11.Bockx I, Verdrengh K, Vander Elst I, van Pelt J, Nevens F, Laleman W, Cassiman D. High-frequency vagus nerve stimulation improves portal hypertension in cirrhotic rats. Gut. 2012;61:604–612. doi: 10.1136/gutjnl-2011-301396. [DOI] [PubMed] [Google Scholar]
- 12.Chang HY, Mashimo H, Goyal RK. Musings on the wanderer: what's new in our understanding of vago-vagal reflex? IV. Current concepts of vagal efferent projections to the gut. American journal of physiology. Gastrointestinal and liver physiology. 2003;284:G357–G366. doi: 10.1152/ajpgi.00478.2002. [DOI] [PubMed] [Google Scholar]
- 13.Von Rosenvinge EC, Raufman JP. Muscarinic receptor signaling in colon cancer. Cancers. 2011;3:971–981. doi: 10.3390/cancers3010971. [DOI] [PMC free article] [PubMed] [Google Scholar]
- 14.Shah N, Khurana S, Cheng K, Raufman JP. Muscarinic receptors and ligands in cancer. American journal of physiology. Cell physiology. 2009;296:C221–C232. doi: 10.1152/ajpcell.00514.2008. [DOI] [PMC free article] [PubMed] [Google Scholar]
- 15.Yan GM, Lin SZ, Irwin RP, Paul SM. Activation of muscarinic cholinergic receptors blocks apoptosis of cultured cerebellar granule neurons. Molecular pharmacology. 1995;47:248–257. [PubMed] [Google Scholar]
- 16.De Sarno P, Shestopal SA, King TD, Zmijewska A, Song L, Jope RS. Muscarinic receptor activation protects cells from apoptotic effects of DNA damage, oxidative stress, and mitochondrial inhibition. The Journal of biological chemistry. 2003;278:11086–11093. doi: 10.1074/jbc.M212157200. [DOI] [PMC free article] [PubMed] [Google Scholar]
- 17.Li JH, Gautam D, Han SJ, Guettier JM, Cui Y, Lu H, Deng C, O’Hare J, Jou W, Gavrilova O, Buettner C, Wess J. Hepatic muscarinic acetylcholine receptors are not critically involved in maintaining glucose homeostasis in mice. Diabetes. 2009;58:2776–2787. doi: 10.2337/db09-0522. [DOI] [PMC free article] [PubMed] [Google Scholar]
- 18.Khurana S, Shah N, Cheng K, Shiu B, Samimi R, Belo A, Shant J, Drachenberg C, Wess J, Raufman JP. Scopolamine treatment and muscarinic receptor subtype-3 gene ablation augment azoxymethane-induced murine liver injury. The Journal of pharmacology and experimental therapeutics. 2010;333:639–649. doi: 10.1124/jpet.109.165118. [DOI] [PMC free article] [PubMed] [Google Scholar]
- 19.Khurana S, Jadeja R, Twaddell W, Cheng K, Rachakonda V, Saxena N, Raufman JP. Effects of modulating M3 muscarinic receptor activity on azoxymethane-induced liver injury in mice. Biochemical pharmacology. 2013;86:329–338. doi: 10.1016/j.bcp.2013.05.010. [DOI] [PMC free article] [PubMed] [Google Scholar]
- 20.Graham ES, Woo KK, Aalderink M, Fry S, Greenwood JM, Glass M, Dragunow M. M1 muscarinic receptor activation mediates cell death in M1-HEK293 cells. PloS one. 2013;8:e72011. doi: 10.1371/journal.pone.0072011. [DOI] [PMC free article] [PubMed] [Google Scholar]
- 21.Leloup C, Michaelson DM, Fisher A, Hartmann T, Beyreuther K, Stein R. M1 muscarinic receptors block caspase activation by phosphoinositide 3-kinase- and MAPK/ERK-independent pathways. Cell death and differentiation. 2000;7:825–833. doi: 10.1038/sj.cdd.4400713. [DOI] [PubMed] [Google Scholar]
- 22.Ostapowicz G, Fontana RJ, Schiodt FV, Larson A, Davern TJ, Han SH, McCashland TM, Shakil AO, Hay JE, Hynan L, Crippin JS, Blei AT, Samuel G, Reisch J, Lee WM, Group USALFS. Results of a prospective study of acute liver failure at 17 tertiary care centers in the United States. Annals of internal medicine. 2002;137:947–954. doi: 10.7326/0003-4819-137-12-200212170-00007. [DOI] [PubMed] [Google Scholar]
- 23.Srivastava A, Maggs JL, Antoine DJ, Williams DP, Smith DA, Park BK. Role of reactive metabolites in drug-induced hepatotoxicity. Handbook of experimental pharmacology. 2010:165–194. doi: 10.1007/978-3-642-00663-0_7. [DOI] [PubMed] [Google Scholar]
- 24.Han D, Shinohara M, Ybanez MD, Saberi B, Kaplowitz N. Signal transduction pathways involved in drug-induced liver injury. Handbook of experimental pharmacology. 2010:267–310. doi: 10.1007/978-3-642-00663-0_10. [DOI] [PubMed] [Google Scholar]
- 25.Hanawa N, Shinohara M, Saberi B, Gaarde WA, Han D, Kaplowitz N. Role of JNK translocation to mitochondria leading to inhibition of mitochondria bioenergetics in acetaminophen-induced liver injury. The Journal of biological chemistry. 2008;283:13565–13577. doi: 10.1074/jbc.M708916200. [DOI] [PMC free article] [PubMed] [Google Scholar]
- 26.Knight TR, Ho YS, Farhood A, Jaeschke H. Peroxynitrite is a critical mediator of acetaminophen hepatotoxicity in murine livers: protection by glutathione. The Journal of pharmacology and experimental therapeutics. 2002;303:468–475. doi: 10.1124/jpet.102.038968. [DOI] [PubMed] [Google Scholar]
- 27.Hu B, Colletti LM. CXC receptor-2 knockout genotype increases X-linked inhibitor of apoptosis protein and protects mice from acetaminophen hepatotoxicity. Hepatology. 2010;52:691–702. doi: 10.1002/hep.23715. [DOI] [PMC free article] [PubMed] [Google Scholar]
- 28.Jaeschke H, Bajt ML. Intracellular signaling mechanisms of acetaminophen-induced liver cell death. Toxicological sciences : an official journal of the Society of Toxicology. 2006;89:31–41. doi: 10.1093/toxsci/kfi336. [DOI] [PubMed] [Google Scholar]
- 29.Schulze-Osthoff K, Bantel H. Necrosis versus apoptosis in acetaminophen-induced hepatotoxicity. Hepatology. 2011;53:1070. doi: 10.1002/hep.24027. [DOI] [PubMed] [Google Scholar]
- 30.Jaeschke H, Gujral JS, Bajt ML. Apoptosis and necrosis in liver disease. Liver international : official journal of the International Association for the Study of the Liver. 2004;24:85–89. doi: 10.1111/j.1478-3231.2004.0906.x. [DOI] [PubMed] [Google Scholar]
- 31.Fisahn A, Yamada M, Duttaroy A, Gan JW, Deng CX, McBain CJ, Wess J. Muscarinic induction of hippocampal gamma oscillations requires coupling of the M1 receptor to two mixed cation currents. Neuron. 2002;33:615–624. doi: 10.1016/s0896-6273(02)00587-1. [DOI] [PubMed] [Google Scholar]
- 32.Gujral JS, Knight TR, Farhood A, Bajt ML, Jaeschke H. Mode of cell death after acetaminophen overdose in mice: apoptosis or oncotic necrosis? Toxicological sciences : an official journal of the Society of Toxicology. 2002;67:322–328. doi: 10.1093/toxsci/67.2.322. [DOI] [PubMed] [Google Scholar]
- 33.Beutler E, Duron O, Kelly BM. Improved method for the determination of blood glutathione. The Journal of laboratory and clinical medicine. 1963;61:882–888. [PubMed] [Google Scholar]
- 34.Buege JA, Aust SD. Microsomal lipid peroxidation. Methods in enzymology. 1978;52:302–310. doi: 10.1016/s0076-6879(78)52032-6. [DOI] [PubMed] [Google Scholar]
- 35.Costa T, Cotecchia S. Historical review: Negative efficacy and the constitutive activity of G-protein-coupled receptors. Trends in pharmacological sciences. 2005;26:618–624. doi: 10.1016/j.tips.2005.10.009. [DOI] [PubMed] [Google Scholar]
- 36.Yang L, Kwon J, Popov Y, Gajdos GB, Ordog T, Brekken RA, Mukhopadhyay D, Schuppan D, Bi Y, Simonetto D, Shah VH. Vascular endothelial growth factor promotes fibrosis resolution and repair in mice. Gastroenterology. 2014;146:1339–1350. doi: 10.1053/j.gastro.2014.01.061. e1331. [DOI] [PMC free article] [PubMed] [Google Scholar]
- 37.Sheffler DJ, Williams R, Bridges TM, Xiang Z, Kane AS, Byun NE, Jadhav S, Mock MM, Zheng F, Lewis LM, Jones CK, Niswender CM, Weaver CD, Lindsley CW, Conn PJ. A novel selective muscarinic acetylcholine receptor subtype 1 antagonist reduces seizures without impairing hippocampus-dependent learning. Molecular pharmacology. 2009;76:356–368. doi: 10.1124/mol.109.056531. [DOI] [PMC free article] [PubMed] [Google Scholar]
- 38.Bajt ML, Cover C, Lemasters JJ, Jaeschke H. Nuclear translocation of endonuclease G and apoptosis-inducing factor during acetaminophen-induced liver cell injury. Toxicological sciences : an official journal of the Society of Toxicology. 2006;94:217–225. doi: 10.1093/toxsci/kfl077. [DOI] [PubMed] [Google Scholar]
- 39.Ju C. Damage-associated molecular patterns: their impact on the liver and beyond during acetaminophen overdose. Hepatology. 2012;56:1599–1601. doi: 10.1002/hep.25920. [DOI] [PubMed] [Google Scholar]
- 40.Ju C, Reilly TP, Bourdi M, Radonovich MF, Brady JN, George JW, Pohl LR. Protective role of Kupffer cells in acetaminophen-induced hepatic injury in mice. Chemical research in toxicology. 2002;15:1504–1513. doi: 10.1021/tx0255976. [DOI] [PubMed] [Google Scholar]
- 41.Jaeschke H. Innate immunity and acetaminophen-induced liver injury: why so many controversies? Hepatology. 2008;48:699–701. doi: 10.1002/hep.22556. [DOI] [PubMed] [Google Scholar]
- 42.Lee SS, Buters JT, Pineau T, Fernandez-Salguero P, Gonzalez FJ. Role of CYP2E1 in the hepatotoxicity of acetaminophen. The Journal of biological chemistry. 1996;271:12063–12067. doi: 10.1074/jbc.271.20.12063. [DOI] [PubMed] [Google Scholar]
- 43.Zaher H, Buters JT, Ward JM, Bruno MK, Lucas AM, Stern ST, Cohen SD, Gonzalez FJ. Protection against acetaminophen toxicity in CYP1A2 and CYP2E1 double-null mice. Toxicology and applied pharmacology. 1998;152:193–199. doi: 10.1006/taap.1998.8501. [DOI] [PubMed] [Google Scholar]
- 44.Knight TR, Fariss MW, Farhood A, Jaeschke H. Role of lipid peroxidation as a mechanism of liver injury after acetaminophen overdose in mice. Toxicological sciences : an official journal of the Society of Toxicology. 2003;76:229–236. doi: 10.1093/toxsci/kfg220. [DOI] [PubMed] [Google Scholar]
- 45.Saito C, Lemasters JJ, Jaeschke H. c-Jun N-terminal kinase modulates oxidant stress and peroxynitrite formation independent of inducible nitric oxide synthase in acetaminophen hepatotoxicity. Toxicology and applied pharmacology. 2010;246:8–17. doi: 10.1016/j.taap.2010.04.015. [DOI] [PMC free article] [PubMed] [Google Scholar]
- 46.Okawa H, Motohashi H, Kobayashi A, Aburatani H, Kensler TW, Yamamoto M. Hepatocyte-specific deletion of the keap1 gene activates Nrf2 and confers potent resistance against acute drug toxicity. Biochemical and biophysical research communications. 2006;339:79–88. doi: 10.1016/j.bbrc.2005.10.185. [DOI] [PubMed] [Google Scholar]
- 47.Saberi B, Shinohara M, Ybanez MD, Hanawa N, Gaarde WA, Kaplowitz N, Han D. Regulation of H(2)O(2)-induced necrosis by PKC and AMP-activated kinase signaling in primary cultured hepatocytes. American journal of physiology. Cell physiology. 2008;295:C50–C63. doi: 10.1152/ajpcell.90654.2007. [DOI] [PMC free article] [PubMed] [Google Scholar]
- 48.Conde de laRosa L, Schoemaker MH, Vrenken TE, Buist-Homan M, Havinga R, Jansen PL, Moshage H. Superoxide anions and hydrogen peroxide induce hepatocyte death by different mechanisms: involvement of JNK and ERK MAP kinases. Journal of hepatology. 2006;44:918–929. doi: 10.1016/j.jhep.2005.07.034. [DOI] [PubMed] [Google Scholar]
- 49.Kaufman DW, Kelly JP, Rosenberg L, Anderson TE, Mitchell AA. Recent patterns of medication use in the ambulatory adult population of the United States: the Slone survey. JAMA : the journal of the American Medical Association. 2002;287:337–344. doi: 10.1001/jama.287.3.337. [DOI] [PubMed] [Google Scholar]
- 50.Larson AM, Polson J, Fontana RJ, Davern TJ, Lalani E, Hynan LS, Reisch JS, Schiodt FV, Ostapowicz G, Shakil AO, Lee WM Acute Liver Failure Study G. Acetaminophen-induced acute liver failure: results of a United States multicenter, prospective study. Hepatology. 2005;42:1364–1372. doi: 10.1002/hep.20948. [DOI] [PubMed] [Google Scholar]
- 51.Nourjah P, Ahmad SR, Karwoski C, Willy M. Estimates of acetaminophen (Paracetomal)-associated overdoses in the United States. Pharmacoepidemiology and drug safety. 2006;15:398–405. doi: 10.1002/pds.1191. [DOI] [PubMed] [Google Scholar]
- 52.Budnitz DS, Lovegrove MC, Crosby AE. Emergency department visits for overdoses of acetaminophen-containing products. American journal of preventive medicine. 2011;40:585–592. doi: 10.1016/j.amepre.2011.02.026. [DOI] [PubMed] [Google Scholar]
- 53.Mitchell FM, Russell M, Johnson GL. Differential calcium dependence in the activation of c-Jun kinase and mitogen-activated protein kinase by muscarinic acetylcholine receptors in rat 1a cells. The Biochemical journal. 1995;309(Pt 2):381–384. doi: 10.1042/bj3090381. [DOI] [PMC free article] [PubMed] [Google Scholar]
- 54.Chan K, Han XD, Kan YW. An important function of Nrf2 in combating oxidative stress: detoxification of acetaminophen. Proceedings of the National Academy of Sciences of the United States of America. 2001;98:4611–4616. doi: 10.1073/pnas.081082098. [DOI] [PMC free article] [PubMed] [Google Scholar]
- 55.Reisman SA, Csanaky IL, Aleksunes LM, Klaassen CD. Altered disposition of acetaminophen in Nrf2-null and Keap1-knockdown mice. Toxicological sciences : an official journal of the Society of Toxicology. 2009;109:31–40. doi: 10.1093/toxsci/kfp047. [DOI] [PMC free article] [PubMed] [Google Scholar]
- 56.Enomoto A, Itoh K, Nagayoshi E, Haruta J, Kimura T, O’Connor T, Harada T, Yamamoto M. High sensitivity of Nrf2 knockout mice to acetaminophen hepatotoxicity associated with decreased expression of ARE-regulated drug metabolizing enzymes and antioxidant genes. Toxicological sciences : an official journal of the Society of Toxicology. 2001;59:169–177. doi: 10.1093/toxsci/59.1.169. [DOI] [PubMed] [Google Scholar]
- 57.Patterson AD, Carlson BA, Li F, Bonzo JA, Yoo MH, Krausz KW, Conrad M, Chen C, Gonzalez FJ, Hatfield DL. Disruption of Thioredoxin Reductase 1 Protects Mice from Acute Acetaminophen-Induced Hepatotoxicity through Enhanced NRF2 Activity. Chemical research in toxicology. 2013 doi: 10.1021/tx4001013. [DOI] [PMC free article] [PubMed] [Google Scholar]
- 58.Ni HM, Boggess N, McGill MR, Lebofsky M, Borude P, Apte U, Jaeschke H, Ding WX. Liver-specific loss of Atg5 causes persistent activation of Nrf2 and protects against acetaminophen-induced liver injury. Toxicological sciences : an official journal of the Society of Toxicology. 2012;127:438–450. doi: 10.1093/toxsci/kfs133. [DOI] [PMC free article] [PubMed] [Google Scholar]
- 59.Jaeschke H, Williams CD, Ramachandran A, Bajt ML. Acetaminophen hepatotoxicity and repair: the role of sterile inflammation and innate immunity. Liver international : official journal of the International Association for the Study of the Liver. 2012;32:8–20. doi: 10.1111/j.1478-3231.2011.02501.x. [DOI] [PMC free article] [PubMed] [Google Scholar]
- 60.Chen CJ, Kono H, Golenbock D, Reed G, Akira S, Rock KL. Identification of a key pathway required for the sterile inflammatory response triggered by dying cells. Nature medicine. 2007;13:851–856. doi: 10.1038/nm1603. [DOI] [PubMed] [Google Scholar]
- 61.Williams CD, Farhood A, Jaeschke H. Role of caspase-1 and interleukin-1beta in acetaminophen-induced hepatic inflammation and liver injury. Toxicology and applied pharmacology. 2010;247:169–178. doi: 10.1016/j.taap.2010.07.004. [DOI] [PMC free article] [PubMed] [Google Scholar]
- 62.Lanzafame AA, Christopoulos A, Mitchelson F. Cellular signaling mechanisms for muscarinic acetylcholine receptors. Receptors & channels. 2003;9:241–260. [PubMed] [Google Scholar]
- 63.Burstein ES, Spalding TA, Brann MR. Pharmacology of muscarinic receptor subtypes constitutively activated by G proteins. Molecular pharmacology. 1997;51:312–319. doi: 10.1124/mol.51.2.312. [DOI] [PubMed] [Google Scholar]


