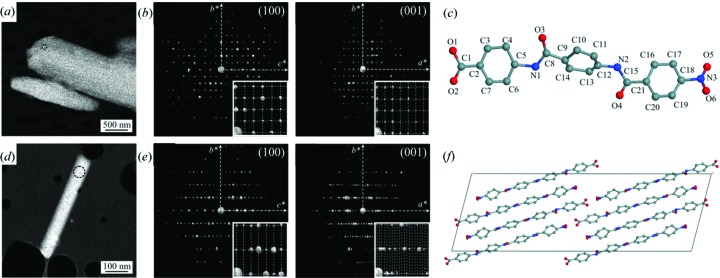
Figure 10.
Crystals of (a) OPBA3 and (d) OPBA4. Views of the reciprocal volume along the main zone axes of (b) OPBA3 and (e) OPBA4 obtained from ADT. Structures of (c) OPBA3 and (d) OPBA4 from ADT data using SIR. Reprinted (adapted) from Gorelik, van de Streek et al. (2012 ▶).

