

Abstract
Background
Experimental studies demonstrate that high aortic pressure in late systole relative to early systole causes greater myocardial remodeling and dysfunction, for any given absolute peak systolic pressure.
Methods and Results
We tested the hypothesis that late systolic hypertension, defined as the ratio of late (last one third of systole) to early (first two thirds of systole) pressure–time integrals (PTI) of the aortic pressure waveform, independently predicts incident heart failure (HF) in the general population. Aortic pressure waveforms were derived from a generalized transfer function applied to the radial pressure waveform recorded noninvasively from 6124 adults. The late/early systolic PTI ratio (L/ESPTI) was assessed as a predictor of incident HF during median 8.5 years of follow‐up. The L/ESPTI was predictive of incident HF (hazard ratio per 1% increase=1.22; 95% CI=1.15 to 1.29; P<0.0001) even after adjustment for established risk factors for HF (HR=1.23; 95% CI=1.14 to 1.32: P<0.0001). In a multivariate model that included brachial systolic and diastolic blood pressure and other standard risk factors of HF, L/ESPTI was the modifiable factor associated with the greatest improvements in model performance. A high L/ESPTI (>58.38%) was more predictive of HF than the presence of hypertension. After adjustment for each other and various predictors of HF, the HR associated with hypertension was 1.39 (95% CI=0.86 to 2.23; P=0.18), whereas the HR associated with a high L/E was 2.31 (95% CI=1.52 to 3.49; P<0.0001).
Conclusions
Independently of the absolute level of peak pressure, late systolic hypertension is strongly associated with incident HF in the general population.
Keywords: arterial hemodynamics, heart failure, late systolic load, left ventricular afterload
Introduction
Heart failure (HF) affects ≈2.4% of the US population and 10% of individuals aged >75 years. The burden of HF has increased markedly over the last few years. Data from the American Heart Association1–2 indicated that the number of new HF cases in the United States increased from 348 000 in 2000 to 670 000 in 2007, representing a 93% increase over this time period. A recent American Heart Association policy statement estimated that the number of people with HF in the United States may increase from 5 million in 2012 to >8 million in 2030.3 Once HF ensues, mortality is high, with 50% of Medicare beneficiaries not surviving 3 years after an HF hospitalization.4 Similarly, HF is associated with a markedly impaired quality of life5–8 and high societal costs.3 Therefore, characterizing the risk factors for the development of new‐onset HF is an important goal, in order to design better preventive strategies.
A series of animal and human studies have linked late systolic load with myocardial remodeling and dysfunction.9–21 Experimental data in rat models demonstrate that, for any given level of left ventricular (LV) peak systolic pressure, an afterload pattern that results in predominantly late‐systolic hypertension, rather than early‐systolic hypertension, causes greater LV remodeling and fibrosis.13 Studies in healthy instrumented dogs have shown that balloon inflations in the ascending aorta during late systole impair diastolic relaxation more than early systolic inflation, for any given increase in peak systolic LV pressure.9,19–21 More recently, it has been shown that late systolic hypertension assessed from a carotid pressure waveform16 or an invasively measured aortic pressure waveform18 is associated with impaired early diastolic relaxation in humans. This implicates the loading sequence (early versus late systolic) as a potential mechanistic determinant of myocardial dysfunction in humans, independent of the absolute systolic blood pressure level. However, whether late systolic hypertension predicts the risk of incident HF in the general population is unknown. In this study, we tested the hypothesis that a simple surrogate of the loading sequence, defined as the ratio of late systolic (last one third of systole) to early systolic (first two thirds of systole) pressure‐time integrals (PTI) of the central pressure waveform, is independently associated with an increased risk of incident HF in a multiethnic sample from general population free of clinically manifest cardiovascular disease at baseline.
Methods
Study Population
The Multiethnic Study of Atherosclerosis enrolled 6814 men and women aged 45 to 84 years who identified themselves as white, African American, Hispanic, or Chinese and were free of clinically apparent cardiovascular disease, from 6 US communities between 2000 and 2002.22 The study was approved by the institutional review boards of participating centers, and participants gave informed consent.
Data Collection
Standardized questionnaires were used to obtain information about cardiovascular risk factors and medication use. Resting blood pressure was measured 3 times with subjects in the seated position with a Dinamap‐Pro100 oscillometric sphygmomanometer (GE Medical Systems, Waukesha, WI). The average of the last 2 measurements was used. Hypertension was defined as systolic blood pressure ≥140 mm Hg, diastolic blood pressure ≥90 mm Hg, or antihypertensive medication use.23 Serum total cholesterol, high‐density‐lipoprotein (HDL) cholesterol, and glucose were measured after a 12‐hour fast. Diabetes mellitus was defined as fasting glucose ≥126 mg/dL or hypoglycemic medication use.24
Hemodynamic Measurements
Radial arterial waveforms were recorded during 30 s at baseline, using the HDI/PulseWave‐CR2000 tonometry device (Hypertension Diagnostics, Eagan, MN), digitized at 200 Hz and exported for offline processing using custom‐designed software written in Matlab (The Mathworks, Natick, MA). All pressure waveforms were visually inspected by an investigator (J.A.C.) for quality and physiologic consistency. We excluded averaged waveforms that met any of the following criteria: (1) A nonphysiologic appearance (usually from bigeminy, trigeminy, or contamination of the signal average by aberrantly recorded complexes); (2) Cardiac cycle duration variation ≥10%; (3) Pulse height (beat‐to‐beat pulse pressure) variation ≥20%; and (4) Less than 10 adequately recorded cycles available for signal averaging.
A generalized transfer function25 was applied to the radial pressure waveform to obtain a central pressure waveform, as previously described.17 The aortic augmentation index was computed as the second/first systolic peak×100. Derived aortic pressure tracings were also analyzed by measuring the area under the central pressure curve (pressure–time integral) during the first (PTI1), second (PTI2) and last (PTI3) one third of systole, as previously described.16 We computed a dimensionless ratio of PTI3/(PTI1+PTI2) as a quantitative index of late systolic hypertension (Figure 1). This ratio, which we call late/early systolic pressure–time‐integral (L/ESPTI) was multiplied by 100 and thus represents PTI3 expressed as a percentage of PTI1+PTI2. Examples of central pressure waveforms demonstrating high and low L/ESPTI are shown in Figure 2.
Figure 1.

Assessment of early vs late aortic systolic pressure. The tonometric radial pressure waveform (left) is used to derive an aortic pressure waveform (right). The duration of the systolic portion of the aortic pressure waveform was then split in 3 equal tertiles to compute the area under the curve (pressure–time integral [PTI]) corresponding to each tertile (PTI1, PTI2, and PTI3). The late/early systolic PTI (L/ESPTI) was then computed as PTI3/(PTI1+PTI2). AIx indicates augmentation index; P1, first systolic peak; P2, second systolic peak; 1, 2 and 3, 1st, 2nd and 3rd pressure‐time integrals of systole, respectively.
Figure 2.

Examples of central pressure waveforms demonstrating a high (top row) and low (bottom row) late/early systolic pressure–time integral (L/ESPTI). AIx indicates Augmentation index.
Event Adjudication
In addition to 4 on‐site examinations, a telephone interviewer contacted participants every 9 to 12 months to inquire about incident cardiovascular events. Two physicians independently reviewed copies of medical records and death certificates for hospitalizations and outpatient cardiovascular diagnoses, for blinded end‐point classification using prespecified criteria.26 The diagnosis of HF was established by “definite” criteria, which required clinical symptoms (eg, dyspnea) or signs (eg, edema), a physician HF diagnosis, and medical treatment for HF in addition to (1) pulmonary edema/congestion by chest radiograph and/or (2) dilated ventricle or poor LV function by echocardiography or ventriculography, or evidence of LV diastolic dysfunction.
Statistical Analysis
We examined the association between hemodynamic measures and time to HF using the Kaplan–Meier method and Cox regression. Model goodness‐of‐fit was assessed with the Akaike's information criterion (AIC) and Bayesian information criterion.27–28 Model discrimination was assessed with the Harrel's c‐index (which is analogous to the area under the receiver‐operator‐characteristic curve).27,29 Improvements in subject reclassification by L/ESPTI were further assessed using the category‐free net reclassification improvement,27,29–30 which depends on the increased probability that a new model will categorize case subjects as higher risk and decreased probability that it will categorize control subjects as lower risk, compared to a base model. We also computed the integrated discrimination improvement, which expresses the improvement in discrimination slopes (mean difference in predicted probabilities between case and control participants) between the base model and new model.27,29–31 Various indices of model performance were used to (1) assess the added predictive value of L/ESPTI, and (2) compare the predictive value of L/ESPTI to that of well‐established risk factors.27
We also compared the risk associated with late systolic hypertension (as defined from the L/ESPTI) versus the risk associated with hypertension, defined by standard criteria JNC‐7 based on brachial systolic and diastolic blood pressure.23 We therefore defined a “high” L/ESPTI based on a cut point chosen to match the prevalence of “high L/ESPTI” to the prevalence of hypertension (defined by standard criteria) in the sample. Since the prevalence of hypertension in the sample at baseline was 45%, a “high L/ESPTI” was defined as a value above the 55th percentile of L/ESPTI (58.38%). Tests were 2‐sided with α=0.05. Analyses were performed using SPSS v17 (SPSS Inc, Chicago, IL). Net reclassification improvement and integrated discrimination improvement were computed using the R package survIDINRI.32
Results
Of 6336 participants who underwent radial tonometry, 6152 (97.1%) had technically adequate data. Twenty‐eight participants had no follow‐up information, leaving 6124 participants in the analysis. Table 1 shows baseline characteristics of participants included in this study. The L/ESPTI ratio was weakly correlated with systolic blood pressure (R2=0.116; P<0.0001), heart rate (R2=0.11; P<0.0001), age (R=0.15; P<0.0001), and was greater in women (59.9%; 95% CI=59.8 to 60) than men (58.3%; 95% CI=58.2 to 58.4; P<0.0001). A significant difference between men and women was present after adjustment for race, diabetes, blood pressure, body height and weight, smoking, glomerular filtration rate, antihypertensive medication use, total cholesterol and HDL cholesterol (adjusted mean for women=59.4%; 95% CI=59.3 to 59.5; adjusted mean for men=58.8; 95% CI=58.7 to 58.9; P<0.0001).
Table 1.
Baseline Characteristics of Study Participants (n=6124)
| Characteristic | Median (IQR) or Count (%) |
|---|---|
| Number of HF events | 135 (2.2) |
| Age, y | 62 (53 to 70) |
| Sex | |
| Male | 2918 (47.6) |
| Female | 3207 (52.4) |
| Ethnicity | |
| White | 2319 (37.9) |
| African American | 1659 (27.1) |
| Chinese American | 751 (12.23) |
| Hispanic American | 1396 (22.8) |
| Body mass index, kg/m2 | 27.5 (24.5 to 31.2) |
| Total cholesterol, mg/dL | 192 (171 to 215) |
| LDL cholesterol, mg/dL | 116 (96 to 136) |
| HDL cholesterol, mg/dL | 48 (40 to 59) |
| Triglycerides, mg/dL | 111 (78 to 160) |
| Diabetes mellitus | 776 (12.7) |
| Current smoking | 2222 (36.3) |
| Hypertension | 2729 (44.6) |
| Estimated glomerular filtration rate, mL·min−1·1.73 m−2 | 79.7 (69.6 to 92) |
| Hypertension medication use | 2269 (37.0) |
| Brachial SBP, mm Hg | 123.5 (111 to 139.5) |
| Brachial DBP, mm Hg | 72 (65 to 78.5) |
| L/ESPTI, % | 59 (57.2 to 60.9) |
| Heart rate, bpm | 63 (57 to 70) |
DBP indicates diastolic blood pressure; HDL, high‐density lipoprotein; HF, heart failure; IQR, interquartile range; L/ESPTI, late/early systolic pressure–time integral; LDL, low‐density lipoprotein; SBP, systolic blood pressure.
During the course of follow‐up (median: 8.47 years, interquartile range: 7.74 to 8.64), 135 participants experienced a first episode of HF. Hazard ratios (HR) for incident HF associated with a 1% increase in L/ESPTI in unadjusted analysis and various adjusted models are shown in Table 2. Standardized HR (ie, corresponding to 1 SD increase in L/E) are also shown. In unadjusted analyses (Model 1), a greater L/E ratio predicted a higher risk of incident HF (HR per 1% increase=1.22; 95% CI=1.15 to 1.29; P<0.0001). The HR per SD increase in the L/E ratio was 1.74 (95% CI=1.49 to 2.04; P<0.0001). These estimates were robust to multivariable adjustment for various confounders (Models 2 to 4, Table 2). In a model that included age, ethnicity, gender, diabetes mellitus, systolic and diastolic blood pressure, body mass index, antihypertensive medication use, total cholesterol, HDL cholesterol, current smoking, heart rate, estimated glomerular filtration rate, and traditional systolic indices derived from pulse‐wave analysis (aortic augmentation index and pulse pressure amplification; Model 4, Table 2), the adjusted HR per 1% increase in the L/ESPTI ratio was 1.24 (1.14 to 1.34: P<0.0001) and the standardized HR was 1.82 (95% CI=1.45 to 2.28). In this model, neither aortic augmentation index (standardized HR=0.94; 95% CI=0.76 to 1.15; P=0.53) nor pulse pressure amplification (standardized HR=0.94; 95% CI=0.73 to 1.33; P=0.94) were predictive of incident HF.
Table 2.
Results of Cox Proportional Hazards Models Examining the Relationship Between the L/ESPTI at Baseline and the Risk of Heart Failure During Follow‐Up (Number of Events=135)
| Hazard Ratio Per 1% Increase in L/ESPTI (95% CI) | Standardized Hazard Ratio (95% CI)* | P Value | |
|---|---|---|---|
| Model 1 | 1.22 (1.15 to 1.29) | 1.74 (1.49 to 2.04) | <0.0001 |
| Model 2 | 1.27 (1.18 to 1.36) | 1.95 (1.60 to 2.36) | <0.0001 |
| Model 3 | 1.22 (1.14 to 1.32) | 1.76 (1.44 to 2.16) | <0.0001 |
| Model 4 | 1.24 (1.14 to 1.34) | 1.82 (1.45 to 2.28) | <0.0001 |
Model 1 is unadjusted (n=6124). Model 2 (n=6124) is adjusted for age, ethnicity, gender, and heart rate. Model 3 (n=6107) is additionally adjusted for diabetes mellitus, systolic and diastolic blood pressure, and body mass index. Model 4 (n=6098) is additionally adjusted for antihypertensive medication use, total cholesterol, HDL cholesterol, current smoking, estimated glomerular filtration rate, aortic augmentation index, and aortic‐to‐radial pulse pressure amplification. HDL indicates high‐density lipoprotein; L/ESPTI, late/early systolic pressure–time integral.
The standardized hazard ratio (HR) is the HR per 1‐SD increase in L/ESPTI. The SD for L/ESPTI is 2.8%.
Table 3 shows the significant predictors of HF in model 4, along with standardized HR, Wald statistics, and other measures of improvements in model performance (Bayesian information criterion, Akaike's information criterion, and c‐index) by each significant independent predictor of HF in this model. Of all the variables in this model, L/ESPTI was the modifiable factor associated with the highest standardized HR, Wald statistic, the greatest reduction in Akaike's information criterion and Bayesian information criterion, and the greatest improvements in c‐statistics. These improvements in model performance were also greater than those provided by both systolic and diastolic blood pressure together (bottom of Table 3). The addition of L/ESPTI to a model containing all other variables shown in Table 3 resulted in a category‐free net reclassification improvement of 0.24 (95% CI=0.05 to 0.45; P=0.027) and an integrated discrimination improvement of 0.015 (95% CI=0.003 to 0.04; P<0.0001).
Table 3.
Predictors of Incident Heart Failure in Multivariable Analysis (n=6098)
| Full Model With Adjusted HR (c‐Index=0.81) | ||||||
|---|---|---|---|---|---|---|
| Standardized HR* | Wald Statistic | P Value | Change in BIC* | Change in AIC* | Change in c‐Index* | |
| Age | 1.54 (1.22 to 1.95) | 12.968 | <0.0001 | −8.4 | −11.30 | 0.015 |
| Male gender | 2.05 (1.63 to 2.58) | 37.234 | <0.0001 | −33.5 | −36.40 | 0.031 |
| Body mass index | 1.29 (1.06 to 1.56) | 6.618 | 0.01 | −1.4 | −4.30 | 0.01 |
| Diabetes mellitus | 1.20 (1.04 to 1.37) | 6.442 | 0.011 | −1.2 | −4.10 | 0.01 |
| Systolic blood pressure | 1.28 (1.00 to 1.62) | 3.961 | 0.047 | 1.0 | −1.90 | 0.005 |
| Diastolic blood pressure | 0.77 (0.60 to 0.99) | 4.264 | 0.039 | 0.6 | −2.30 | 0.005 |
| Heart rate | 1.45 (1.20 to 1.75) | 15.261 | <0.0001 | −9.7 | −12.60 | 0.011 |
| L/ESPTI | 1.78 (1.45 to 2.17) | 30.948 | <0.0001 | −23.8 | −26.70 | 0.016 |
| Systolic and diastolic blood pressure added together* | — | — | — | 0.10 | −2.80 | 0.005 |
All models are adjusted for ethnicity, antihypertensive medication use, total cholesterol, high‐density lipoprotein cholesterol, current smoking, and estimated glomerular filtration rate. Only significant predictors of heart failure are shown. HR indicates hazard ratio; L/ESPTI, late/early systolic pressure–time integral.
SDs are as follows: age, 10.2 years; body mass index, 5.5 kg/m2; systolic blood pressure, 21.4 mm Hg; diastolic blood pressure, 10.3 mm Hg; heart rate, 10 bpm; L/ESPTI, 2.8%.
AIC, Akaike's information criterion; BIC, Bayesian information criterion. For both, larger decreases (changes with negative sign) indicate a larger improvement in model fit.
Larger increases indicate a larger improvement in model performance.
This row presents improvements in model performance when both systolic and diastolic blood pressure are added to a model containing all other variables contained in the full model.
Figure 3 shows the HR associated with hypertension (prevalence=45%) or a high L/ESPTI (ie, >0.594 or 59.4%; prevalence=45%) in various Cox models. All models include the presence of hypertension and a high L/ESPTI as predictors of HF. In unadjusted analyses, both hypertension (HR=2.61; 95% CI=1.79 to 3.81; P<0.0001) and a high L/ESPTI (HR=2.08; 95% CI=1.44 to 3.01; P<0.0001) were significant independent predictors of HF. A high L/ESPTI was a robust independent predictor of HF with increasing adjustment for confounders. In contrast, hypertension did not significantly predict HF in a model that adjusted for a high L/E and various confounders (age, ethnicity, gender, heart rate, diabetes mellitus, body mass index, antihypertensive medication use, total cholesterol, HDL cholesterol, current smoking, and estimated glomerular filtration rate; Model 4 in Figure 3). In this model, the HR associated with hypertension was 1.39 (95% CI=0.86 to 2.23; P=0.18), whereas the HR associated with a high L/E was 2.31 (95% CI=1.52 to 3.49; P<0.0001). The cumulative hazard for HF among participants stratified according to the presence or absence of hypertension or a high L/ESPTI, adjusted for age, ethnicity, gender, heart rate, diabetes mellitus, body mass index, antihypertensive medication use, total cholesterol, HDL cholesterol, current smoking, and estimated glomerular filtration rate is shown in Figure 4. It can be seen that participants with a high L/E demonstrated the highest hazard for HF, even in the absence of hypertension, whereas participants with a low L/E (both normotensive and hypertensive) comprised the strata with the lowest hazard for HF.
Figure 3.
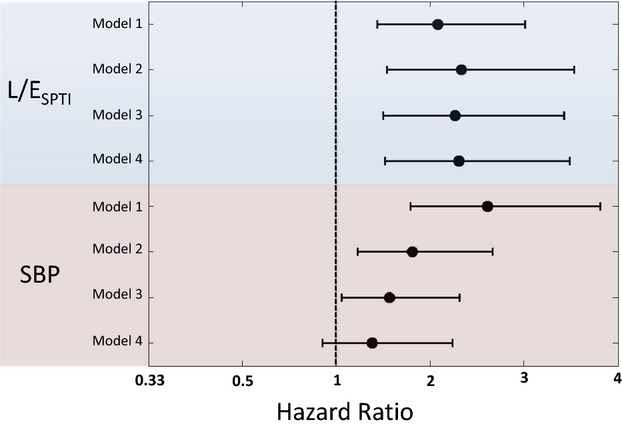
Hazard ratio associated with hypertension or a high L/ESPTI in various Cox models. All models include the presence of hypertension and a high L/ESPTI as predictors of HF. Model 1 (n=6124) includes no additional covariables. Model 2 (n=6124) is adjusted for age, ethnicity, gender, and heart rate. Model 3 (n=6107) is additionally adjusted for diabetes mellitus and body mass index. Model 4 (n=6098) is additionally adjusted for antihypertensive medication use, total cholesterol, HDL cholesterol, current smoking, estimated glomerular filtration rate, aortic augmentation index, and aortic‐to‐radial pulse pressure amplification. HDL indicates high‐density lipoprotein; HF, heart failure; L/ESPTI, late/early systolic pressure–time integral; SBP, systolic blood pressure.
Figure 4.

Cumulative hazard curves for HF among participants stratified according to the presence or absence of hypertension (prevalence=45%) or a high L/ESPTI (set empirically to an identical prevalence of 45% based on E/LSPTI). Curves are adjusted for age, ethnicity, gender, heart rate, diabetes mellitus, body mass index, antihypertensive medication use, total cholesterol, HDL cholesterol, current smoking, and estimated glomerular filtration rate. The numbers of participants in each stratum are as follows: No HTN/Low L/ESPTI=2214; HTN/Low L/ESPTI=1155; No HTN/High L/ESPTI=1182; HTN/High L/ESPTI=1574. HDL indicates high‐density lipoprotein; HF, heart failure; L/ESPTI, late/early systolic pressure time integral; HTN, hypertension; CHF, congestive heart failure.
There was no evidence of effect modification by gender (P for interaction=0.26) or age (P for interaction=0.96) regarding the association between L/ESPTI and incident HF.
Discussion
Our study demonstrates that late systolic central hypertension, assessed noninvasively via analysis of a central pressure waveform derived from radial tonometry, is an important independent risk factor for new‐onset HF among adults in the general population. In our large multiethnic sample of adults free of clinically apparent cardiovascular disease at baseline, a simple ratio of late versus early central pressure in systole (L/ESPTI) was a strong predictor of incident HF independent of brachial systolic and diastolic blood pressure levels and other established predictors of HF, and was associated with important improvements in model performance and a significant population‐attributable risk of HF.
For any given level of systolic blood pressure, a pattern characterized by prominent late‐systolic load has been unequivocally demonstrated to exert deleterious effects on LV structure and function in animal models,9,13,33 observations that have been supported by human studies.15–16 Consistent with these mechanistic data, our study indicates that late systolic hypertension is an independent predictor of HF risk.
The aortic pressure profile is determined by the interactions between the left ventricle and the load imposed by the arterial tree.33 The hemodynamic determinants of late systolic versus early systolic hypertension are different. Early systolic pressure is a function of the pulsatile increase in pressure as a result of the interaction between the LV and the proximal aortic characteristic impedance, whereas late systolic pressure is more dependent on the total compliance of the arterial tree and wave reflections.14 Wave reflections arise at multiple sites of impedance mismatch along the arterial tree (such as points of branching or change in wall diameter or material properties)33–34 and merge into a net reflected wave, which increases late systolic pressure and reduces late systolic flow in the aorta. These arterial phenomena in turn relate differentially to the LV wall stress at different time points during ejection.35 During early ejection, active development of fiber cross‐bridges occurs in the electrically activated myocardium and peak myocardial wall stress occurs,36 at a time when systolic pressure coexists with quasidiastolic geometry. Myocardial fiber shortening and ejection of blood determine a progressive change in LV geometry, which causes a drop in myocardial stress during mid‐to‐late systole. This phenomenon, which appears to be favorable for the myocardium to reduce the late systolic load imposed by wave reflections, is, however, of variable magnitude and may be insufficient and/or compromised in the setting of low or low‐normal LV ejection fraction or in the presence of pronounced late systolic arterial load.35–38 Indeed, an elevation of late systolic LV wall stress relative to early wall stress has been shown to be independently associated with diastolic dysfunction in middle‐aged adults.39
We have previously shown than reflection magnitude estimated with a physiologic flow approach independently predicts the risk of incident HF in this cohort.17 Such an approach is based on the relatively low variability of the flow waveform between individuals. It represents an approximation, which depends on the assumption of a physiologic flow waveform (rather than relying on measured flow). Furthermore, it does not directly assess the timing of arterial pressure during systole. In contrast, the approach undertaken in the current study does not require the use of any assumptions about flow waveform morphology and provides a direct quantification of early versus late systolic central hypertension. Furthermore, in contrast to augmentation index, this index does not rely heavily on the high‐frequency components of the pulse wave contour, which tend to be more susceptible to noise and which relate less consistently between the radial and aortic locations.
Our study should be interpreted in the context of its strengths and limitations. To our knowledge, this is the first study to demonstrate an association between late systolic central hypertension and incident HF. Other strengths of our investigation include the multiethnic community‐based sample, standardized assessments, and careful event adjudication using definitive criteria for HF. However, it is important to acknowledge several limitations. Our observational study cannot prove a causal link between late systolic hypertension and HF, although our observational data should be interpreted in the context of previous experimental studies, which demonstrate a cause–effect relationship between late systolic load and myocardial remodeling and dysfunction.9–11,13,18–21 We did not measure aortic pressure directly, but rather derived it from a generalized transfer function, designed to reproduce the features of the central pressure waveform. This approach has limitations, because it assumes a fixed relationship between the harmonic components of pressure between the aorta and the radial artery. However, this relationship is actually variable, particularly for the higher harmonics of pressure. Since participants had no known cardiovascular disease at baseline, this cohort represents a particularly healthy sample of the population at large which is, however, ideal for examining early vascular changes predisposing to new‐onset HF. Finally, our study did not assess how the L/ESPTI relates to incident HF with preserved ejection fraction versus HF with reduced ejection fraction. This should be the focus of future research.
In summary, in an ethnically diverse population free of cardiovascular disease at baseline, late systolic hypertension was independently associated with incident HF. The systolic LV loading sequence may represent an important novel risk factor for HF and a potential therapeutic target for primary HF prevention.
Acknowledgments
A full list of participating Multiethnic Study of Atherosclerosis investigators and institutions can be found at http://www.mesa-nhlbi.org. We thank the other investigators, the staff, and the participants of Multiethnic Study of Atherosclerosis for their valuable contributions.
Sources of Funding
This research was supported by contracts N01‐HC‐95159 through N01‐HC‐95169 from the National Heart, Lung, and Blood Institute and RR‐024156 as well as American Heart Association Grants 0885031N, R01‐HL‐098382, and R21‐AG043802.
Disclosures
Dr Chirinos receives research funding related to arterial hemodynamics from the National Institutes of Health and the Department of Veterans Affairs VISN‐4 (significant), has received no‐cost equipment loans from Atcor Medical, Fukuda‐Denchi, IEM, and HealthStats (modest), and has received consulting honoraria (modest) from Fukuda‐Denchi. Other authors have no conflicts of interest to disclose. Dr. Chirinos is named as inventor on a University of Pennsylvania patent application for the use of inorganic nitrate and nitrite for the treatment of Heart Failure with Preserved Ejection Fraction.
References
- Lam CS, Donal E, Kraigher‐Krainer E, Vasan RS. Epidemiology and clinical course of heart failure with preserved ejection fraction. Eur J Heart Fail. 2011; 13:18-28. [DOI] [PMC free article] [PubMed] [Google Scholar]
- Lloyd‐Jones DM, Hong Y, Labarthe D, Mozaffarian D, Appel LJ, Van Horn L, Greenlund K, Daniels S, Nichol G, Tomaselli GF, Arnett DK, Fonarow GC, Ho PM, Lauer MS, Masoudi FA, Robertson RM, Roger V, Schwamm LH, Sorlie P, Yancy CW, Rosamond WD. Defining and setting national goals for cardiovascular health promotion and disease reduction: the American Heart Association's strategic Impact Goal through 2020 and beyond. Circulation. 2010; 121:586-613. [DOI] [PubMed] [Google Scholar]
- Heidenreich PA, Albert NM, Allen LA, Bluemke DA, Butler J, Fonarow GC, Ikonomidis JS, Khavjou O, Konstam MA, Maddox TM, Nichol G, Pham M, Pina IL, Trogdon JG. Forecasting the impact of heart failure in the United States: a policy statement from the American Heart Association. Circ Heart Fail. 2013; 6:606-619. [DOI] [PMC free article] [PubMed] [Google Scholar]
- Barker WH, Mullooly JP, Getchell W. Changing incidence and survival for heart failure in a well‐defined older population, 1970–1974 and 1990–1994. Circulation. 2006; 113:799-805. [DOI] [PubMed] [Google Scholar]
- Cully JA, Phillips LL, Kunik ME, Stanley MA, Deswal A. Predicting quality of life in veterans with heart failure: the role of disease severity, depression, and comorbid anxiety. Behav Med. 2010; 36:70-76. [DOI] [PubMed] [Google Scholar]
- Gott M, Barnes S, Parker C, Payne S, Seamark D, Gariballa S, Small N. Predictors of the quality of life of older people with heart failure recruited from primary care. Age Ageing. 2006; 35:172-177. [DOI] [PubMed] [Google Scholar]
- Moser DK, Doering LV, Chung ML. Vulnerabilities of patients recovering from an exacerbation of chronic heart failure. Am Heart J. 2005; 150:984. [DOI] [PubMed] [Google Scholar]
- Stewart AL, Greenfield S, Hays RD, Wells K, Rogers WH, Berry SD, McGlynn EA, Ware JE., Jr Functional status and well‐being of patients with chronic conditions. Results from the Medical Outcomes Study. JAMA. 1989; 262:907-913. [PubMed] [Google Scholar]
- Gillebert TC, Lew WY. Influence of systolic pressure profile on rate of left ventricular pressure fall. Am J Physiol. 1991; 261:H805-H813. [DOI] [PubMed] [Google Scholar]
- Su JB, Hittinger L, Laplace M, Crozatier B. Loading determinants of isovolumic pressure fall in closed‐chest dogs. Am J Physiol. 1991; 260:H690-H697. [DOI] [PubMed] [Google Scholar]
- Gillebert TC, Leite‐Moreira AF, De Hert SG. Load dependent diastolic dysfunction in heart failure. Heart Fail Rev. 2000; 5:345-355. [DOI] [PubMed] [Google Scholar]
- Zile MR, Gaasch WH. Mechanical loads and the isovolumic and filling indices of left ventricular relaxation. Prog Cardiovasc Dis. 1990; 32:333-346. [DOI] [PubMed] [Google Scholar]
- Kobayashi S, Yano M, Kohno M, Obayashi M, Hisamatsu Y, Ryoke T, Ohkusa T, Yamakawa K, Matsuzaki M. Influence of aortic impedance on the development of pressure‐overload left ventricular hypertrophy in rats. Circulation. 1996; 94:3362-3368. [DOI] [PubMed] [Google Scholar]
- Nichols WW, Michael O'Rourke, Vlachopolous C. McDonald's Blood Flow in Arteries. Theoretical, Experimental and Clinical Principles. 20116th edHodder Arnold; 2011 [Google Scholar]
- Hashimoto J, Westerhof BE, Westerhof N, Imai Y, O'Rourke MF. Different role of wave reflection magnitude and timing on left ventricular mass reduction during antihypertensive treatment. J Hypertens. 2008; 26:1017-1024. [DOI] [PubMed] [Google Scholar]
- Borlaug BA, Melenovsky V, Redfield MM, Kessler K, Chang HJ, Abraham TP, Kass DA. Impact of arterial load and loading sequence on left ventricular tissue velocities in humans. J Am Coll Cardiol. 2007; 50:1570-1577. [DOI] [PubMed] [Google Scholar]
- Chirinos JA, Kips JG, Jacobs DR, Jr, Brumback L, Duprez DA, Kronmal R, Bluemke DA, Townsend RR, Vermeersch S, Segers P. Arterial wave reflections and incident cardiovascular events and heart failure: MESA (Multiethnic Study of Atherosclerosis). J Am Coll Cardiol. 2012; 60:2170-2177. [DOI] [PMC free article] [PubMed] [Google Scholar]
- Fujimoto N, Onishi K, Tanabe M, Dohi K, Funabiki K, Kurita T, Yamanaka T, Nakajima K, Ito M, Nobori T, Nakano T. Nitroglycerin improves left ventricular relaxation by changing systolic loading sequence in patients with excessive arterial load. J Cardiovasc Pharmacol. 2005; 45:211-216. [DOI] [PubMed] [Google Scholar]
- Kohno F, Kumada T, Kambayashi M, Hayashida W, Ishikawa N, Sasayama S. Change in aortic end‐systolic pressure by alterations in loading sequence and its relation to left ventricular isovolumic relaxation. Circulation. 1996; 93:2080-2087. [DOI] [PubMed] [Google Scholar]
- Hori M, Inoue M, Kitakaze M, Tsujioka K, Ishida Y, Fukunami M, Nakajima S, Kitabatake A, Abe H. Loading sequence is a major determinant of afterload‐dependent relaxation in intact canine heart. Am J Physiol. 1985; 249:H747-H754. [DOI] [PubMed] [Google Scholar]
- Hori M, Inoue M, Kitakaze M, Kitabatake A, Abe H. Altered loading sequence as an underlying mechanism of afterload dependency of ventricular relaxation in hearts in situ. Jpn Circ J. 1985; 49:245-254. [DOI] [PubMed] [Google Scholar]
- Bild DE, Bluemke DA, Burke GL, Detrano R, Diez Roux AV, Folsom AR, Greenland P, Jacob DR, Jr, Kronmal R, Liu K, Nelson JC, O'Leary D, Saad MF, Shea S, Szklo M, Tracy RP. Multi‐ethnic study of atherosclerosis: objectives and design. Am J Epidemiol. 2002; 156:871-881. [DOI] [PubMed] [Google Scholar]
- Chobanian AV, Bakris GL, Black HR, Cushman WC, Green LA, Izzo JL, Jr, Jones DW, Materson BJ, Oparil S, Wright JT, Jr, Roccella EJ. The Seventh Report of the Joint National Committee on Prevention, Detection, Evaluation, and Treatment of High Blood Pressure: the JNC 7 report. JAMA. 2003; 289:2560-2572. [DOI] [PubMed] [Google Scholar]
- Report of the expert committee on the diagnosis and classification of diabetes mellitus. Diabetes Care. 2003; 26(suppl 1):S5-S20. [DOI] [PubMed] [Google Scholar]
- Karamanoglu M, O'Rourke MF, Avolio AP, Kelly RP. An analysis of the relationship between central aortic and peripheral upper limb pressure waves in man. Eur Heart J. 1993; 14:160-167. [DOI] [PubMed] [Google Scholar]
- Bluemke DA, Kronmal RA, Lima JA, Liu K, Olson J, Burke GL, Folsom AR. The relationship of left ventricular mass and geometry to incident cardiovascular events: the MESA (Multi‐Ethnic Study of Atherosclerosis) study. J Am Coll Cardiol. 2008; 52:2148-2155. [DOI] [PMC free article] [PubMed] [Google Scholar]
- Cook NR, Ridker PM. Advances in measuring the effect of individual predictors of cardiovascular risk: the role of reclassification measures. Ann Intern Med. 2009; 150:795-802. [DOI] [PMC free article] [PubMed] [Google Scholar]
- Volinsky CT, Raftery AE. Bayesian information criterion for censored survival models. Biometrics. 2000; 56:256-262. [DOI] [PubMed] [Google Scholar]
- Pencina MJ, D'Agostino RB, Sr, D'Agostino RB, Jr, Vasan RS. Evaluating the added predictive ability of a new marker: from area under the ROC curve to reclassification and beyond. Stat Med. 2008; 27:157-172.‐ [DOI] [PubMed] [Google Scholar]
- Pencina MJ, D'Agostino RB, Sr, Steyerberg EW. Extensions of net reclassification improvement calculations to measure usefulness of new biomarkers. Stat Med. 2011; 30:11-21. [DOI] [PMC free article] [PubMed] [Google Scholar]
- Pencina MJ, D'Agostino RB, Vasan RS. Statistical methods for assessment of added usefulness of new biomarkers. Clin Chem Lab Med. 2010; 48:1703-1711. [DOI] [PMC free article] [PubMed] [Google Scholar]
- Uno H, Tian L, Cai T, Kohane IS, Wei LJ. A unified inference procedure for a class of measures to assess improvement in risk prediction systems with survival data. Stat Med. 2013; 32:2430-2442. [DOI] [PMC free article] [PubMed] [Google Scholar]
- Nichols WW, O'Rourke MF. McDonald's Blood Flow in Arteries. Theoretical, Experimental and Clinical Principles. 20055 edOxford, UK: Oxford University Press; 2005 [Google Scholar]
- Chirinos JA, Segers P. Noninvasive evaluation of left ventricular afterload: part 2: arterial pressure‐flow and pressure‐volume relations in humans. Hypertension. 2010; 56:563-570. [DOI] [PubMed] [Google Scholar]
- Chirinos JA, Segers P, Gillebert TC, Gupta AK, De Buyzere ML, De Bacquer D, St John‐Sutton M, Rietzschel ER. Arterial properties as determinants of time‐varying myocardial stress in humans. Hypertension. 2012; 60:64-70. [DOI] [PubMed] [Google Scholar]
- Chirinos JA, Segers P, Gupta AK, Swillens A, Rietzschel ER, De Buyzere ML, Kirkpatrick JN, Gillebert TC, Wang Y, Keane MG, Townsend R, Ferrari VA, Wiegers SE, St John Sutton M. Time‐varying myocardial stress and systolic pressure‐stress relationship: role in myocardial‐arterial coupling in hypertension. Circulation. 2009; 119:2798-2807. [DOI] [PubMed] [Google Scholar]
- Shah SJ, Wasserstrom JA. Increased arterial wave reflection magnitude: a novel form of stage B heart failure? J Am Coll Cardiol. 2012; 60:2178-2181. [DOI] [PubMed] [Google Scholar]
- Chowienczyk P, Shah A. Myocardial wall stress: from hypertension to heart tension. Hypertension. 2012; 60:10-11. [DOI] [PubMed] [Google Scholar]
- Chirinos JA, Segers P, Rietzschel ER, De Buyzere ML, Raja MW, Claessens T, De Bacquer D, St John Sutton M, Gillebert TC. Early and late systolic wall stress differentially relate to myocardial contraction and relaxation in middle‐aged adults: the Asklepios study. Hypertension. 2013; 61:296-303. [DOI] [PubMed] [Google Scholar]