

Abstract
Background
Brain‐derived neurotrophic factor (BDNF) is a pleiotropic peptide involved in maintaining endothelial integrity. It is unknown if circulating BDNF levels are associated with risk of cardiovascular disease (CVD).
Methods and Results
We prospectively investigated the association of circulating BDNF levels with cardiovascular events and mortality in 3687 participants (mean age 65 years, 2068 women) from the Framingham Heart Study (FHS). Using a common nonsynonomous single nucleotide polymorphism (SNP) in the BDNF gene (rs6265), we then performed a Mendelian randomization experiment in the CARDIoGRAM (Coronary ARtery DIsease Genome‐Wide Replication And Meta‐Analysis) consortium (>22 000 coronary artery disease [CAD] cases, >60 000 controls) to investigate whether SNP rs6265 was associated with CAD in CARDIoGRAM and, if so, whether the effect estimate differed from that predicted based on FHS data. On follow‐up (median 8.9 years), 467 individuals (261 women) in FHS experienced a CVD event, and 835 (430 women) died. In multivariable‐adjusted Cox regression, serum BDNF was associated inversely with CVD risk (hazard ratio [HR] per 1‐SD increase 0.88, 95% CI 0.80 to 0.97, P=0.01) and with mortality (HR 0.87, 95% CI 0.80 to 0.93, P=0.0002). SNP rs6265 was associated with BDNF concentrations (0.772 ng/mL increase per minor allele copy) in FHS. In CARDIoGRAM, SNP rs6265 was associated with CAD (odds ratio 0.957, 95% CI 0.923 to 0.992), a magnitude consistent with the predicted effect (HR per minor allele copy 0.99, 95% CI 0.98 to 1.0; P=0.06 for difference between predicted and observed effect).
Conclusion
Higher serum BDNF is associated with a decreased risk of CVD and mortality. Mendelian randomization suggests a causal protective role of BDNF in the pathogenesis of CVD.
Keywords: cardiovascular disease, growth factors, Mendelian randomization, mortality, risk factors
Introduction
Cardiovascular disease (CVD) is the leading cause of death in the developed countries, and clinical risk factors for CVD (eg, obesity, dyslipidemia, diabetes, and a sedentary lifestyle) have been known for decades. Nevertheless, the molecular basis of CVD is complex and linked to a broad range of biological pathways, including lipid and glucose metabolism, inflammation, vascular repair, and angiogenesis. Brain‐derived neurotrophic factor (BDNF) is a pleiotropic peptide mediator involved in the regulation of appetite and physical activity and in neuroplasticity.1 Heterozygous BDNF knockout mice consume almost 50% more food than do their wild‐type littermates and are obese.2 Independent of its effect on energy homeostasis, BDNF has been implicated in angiogenesis and the maintenance of vascular integrity in recent reports.3 Thus, conditional BDNF knockout mice have greater myocardial damage after experimental infarction compared with wild‐type mice.4 These observations raise the possibility that BDNF may play a role in the pathogenesis of CVD.
Indeed, limited epidemiological data suggest that higher circulating BDNF levels may be associated with a lower prevalence of cardiovascular risk factors and with a lower mortality in small samples.5–6 Conversely, patients with unstable angina have been reported to have increased BDNF levels in the coronary circulation compared with individuals with stable angina, suggesting that BDNF may detrimentally influence plaque stability.7 Taken together, epidemiological data on the relation between BDNF and CVD are sparse and conflicting. Thus, we prospectively investigated the association of circulating BDNF levels with cardiovascular events and mortality in the community‐based Framingham Heart Study (FHS) cohort. To assess a potentially causal relation between BDNF levels and CVD, we performed a Mendelian randomization analysis by using the CARDIoGRAM (Coronary ARtery DIsease Genome‐Wide Replication And Meta‐Analysis) meta‐sample.
Methods
Study Samples
Framingham Heart Study (FHS)
The FHS sample for the present investigation was derived from the Original and Offspring cohorts8–9 and is based on the 23rd FHS Original cohort examination (1992–1996) and the 7th Offspring cohort examination (1998–2001). The FHS started in 1948 with the recruitment of 5209 individuals from the general population residing in the Framingham, MA, area, referred to as the Original cohort. Participants in this cohort are evaluated at the FHS clinic approximately every 2 years, including a detailed medical history, physical examination, blood pressure assessment, ECG, and phlebotomy for the measurement of vascular risk factors. The Framingham Offspring study began in 1971 with the recruitment of 5124 individuals who were the offspring of the Original Cohort or the offsprings' spouses.9 Follow‐up examinations in the study clinic are performed approximately once every 4 years.
Of 1026 Original cohort participants attending examination cycle 23, we excluded 357 who did not have available BDNF measurements (>225 participants had visits at home and blood was not drawn; additionally, serum samples drawn in the first 4 months of the examination cycle were not available for this assay due to storage‐related problems). Of 3539 Offspring cohort participants attending examination cycle 7, we excluded 3 participants for lack of follow‐up data and an additional 518 who did not have available BDNF measurements (due to lack of sufficient amounts of serum aliquots), resulting in a final sample size of 3687 (669 Original cohort, 3018 Offspring cohort participants).
Physical activity was assessed (in the Offspring cohort only) by using a structured questionnaire and then quantified as a physical activity index, which is calculated based on weighted frequencies and duration of the reported activities as detailed previously.10 Depression was assessed (in the Offspring cohort only) using the Center for Epidemiological Studies–Depression Scale (CESD), which is an accepted tool to screen for depressive symptoms in observational cohort settings.11
The study was approved by the Boston University Medical Center Institutional Review Board; written informed consent was obtained from all participants.
Biomarker measurements in the FHS cohort
Serum BDNF levels were determined by using Quantikine ELISA kits obtained from R&D Systems after a 20‐fold dilution in polypropylene tubes with Calibrator Diluent RD6P included in the kits. The sensitivity of the assay is estimated to be at or below 0.0625 ng/mL. The intra‐ and inter‐assay coefficients of variation were 3.8% to 6.2% and 7.6% to 11.3%, respectively. High‐sensivity C‐reactive protein (hsCRP) was measured (only in the Offspring cohort) by using a nephelometer (Dade Behring).12 Brain natriuretic peptide (BNP) was measured only in the Offspring cohort at examination cycle 6 (not 7), by using an immunoradiometric assay (Shionogi) as previously described.13
Genotyping in FHS
Single nucleotide polymorphism (SNP) rs6265 was directly genotyped on the Illumina Beadstation 500G genotyping system by using Illumina FastTrack Services and the Golden Gate assay workflow protocol. The sample success rate was 99.44%, locus success rate was 97.4%, genotype call rate was 99.72%, reproducibility was 100%, and Mendelian consistency 99.99%. Minor allele frequency of rs6265 was 0.19 in FHS. Genotypes are available at http://www.ncbi.nlm.nih.gov/gap.
Outcome events in FHS
A “cardiovascular event” was defined as angina pectoris, coronary insufficiency (prolonged angina with documented ECG changes), myocardial infarction, stroke (ischemic or hemorrhagic) or transient ischemic attack, incident heart failure, intermittent claudication, or death secondary to CVD. All cardiovascular events were adjudicated by a panel of 2 or 3 investigators on review of hospital records, medical office notes, and Framingham clinic visit notes, by using standardized criteria that have been described previously.14
Mendelian randomization in the CARDIoGRAM meta‐sample
We assessed the association of the major functional genetic variant within the BDNF gene (rs6265) with coronary artery disease (CAD) in the CARDIoGRAM consortium.15 CARDIoGRAM is a meta‐analysis of genome‐wide association data for CAD including myocardial infarction and consists of 14 population‐based cohorts and case‐control samples, including in total >22 000 cases and >60 000 controls.15 We chose CARDIoGRAM for our Mendelian randomization experiment because it is the largest consortium of CAD outcomes with availability of genetic data for the BDNF locus, thereby maximizing our statistical power. We are unaware of larger consortia that have evaluated a composite outcome of CVD (paralleling our primary outcome in FHS) or consortia that have assessed all‐cause mortality in a genome‐wide context with availability of BDNF SNP data. Minor allele frequency of SNP rs6265 was 0.18 in CARDIoGRAM.
Statistical Analyses
BDNF levels were normally distributed. Age‐ and sex‐adjusted incidence rates of CVD and all‐cause mortality across quartiles of serum BDNF were calculated by using direct standardization by sex and age strata of <60, 60 to 74 and ≥75 years. We then estimated Cox proportional hazards regression models to further explore the relation of BDNF with CVD incidence and all‐cause mortality after confirming the assumption of proportionality of hazards for both outcomes. We assessed 2 models: (1) adjusting only for age and sex and (2) additionally adjusting for standard CVD risk factors16 (ie, age, sex, smoking, systolic blood pressure, hypertension treatment, total and high‐density lipoprotein cholesterol, diabetes mellitus, and body mass index [BMI]). All models were stratified by study cohort (Original versus Offspring). We adjusted for BMI (although it has been an inconsistent component of CVD risk prediction algorithms) because of the potential association of BDNF with BMI.17 Using interaction terms, we assessed potential effect modification by age, BMI, or study cohort in our multivariable models. However, these terms were statistically nonsignificant (all P>0.05 for both outcomes). To further explore any potential nonlinear relation of BDNF levels with CVD events and mortality, we constructed multivariable‐adjusted (covariates of model 2) nonparametric restricted cubic splines (with 3 knots at the quartiles of the BDNF distribution).18 To further assess a potential role of smoking, we adjusted our multivariable models for lifetime smoking exposure in pack‐years (instead of current smoking status). We also investigated whether current smoking modifies the relation between serum BDNF and events by introducing an interaction term (smoking×BDNF) into our multivariable models.
In exploratory analyses, we additionally adjusted our Cox models for other novel CVD biomarkers (ie, hsCRP and BNP) and for physical activity (by using the physical activity index) and depression (using the CESD score). These analyses were limited to the Offspring cohort because these variables were measured only in this cohort. All analyses were performed by using SAS version 9.2 (SAS Institute). A P value of <0.05 was considered statistically significant.
To assess the contribution of BDNF levels to CVD risk prediction, we compared performance metrics of a model incorporating standard CVD risk factors (multivariable Cox regression model 2) to a model that additionally included serum BDNF. We assessed increment in the c‐statistic, the integrated discrimination improvement (IDI), and the continuous net reclassification improvement (NRI), all calculated as previously described.19–20
Mendelian randomization experiment
Mendelian randomization is based on the fact that alleles of genetic variants (here, rs6265, a known functional variant in exon 2 of the BDNF gene) are transmitted randomly during conception from the parents to their offspring.21 Because rs6265 alters BDNF levels, individuals are randomly assigned to genetically elevated or reduced BDNF levels.21–22 Importantly, the random allocation of alleles during meiosis is independent of traditional CVD risk factors and the CVD disease process itself. Therefore, estimates from Mendelian randomization studies are insensitive to (nongenetic) confounders and reverse causality.23 Thus, if lower BDNF levels cause CVD, one can estimate the predicted relative CVD risk increase that goes along with genetically reduced BDNF levels, based on (1) the association of rs6265 with circulating BDNF levels and (2) the association of circulating BDNF levels with incident CVD. Accordingly, first we related the SNP rs6265 to circulating BDNF levels by using a linear regression model (adjusted for age and sex) assuming an additive genetic model. Next, based on the association of the SNP with BDNF levels, and in turn the association between circulating BDNF levels and incident CVD, we estimated the predicted strength of association between SNP rs6265 and CVD in age‐ and sex‐adjusted Cox regression models. Third, we evaluated the strength of association of the SNP rs6265 with CAD in the CARDIoGRAM consortium.15 These analyses were again performed adjusting for age and sex (prior to meta‐analysis). Last, we compared the predicted risk for CVD (based on FHS data) for this SNP with the observed relative risk for CAD in CARDIoGRAM by using the 2‐sample t test.
Results
Study Sample
The characteristics of our study sample are provided in Table 1. Our sample was middle‐aged to elderly, with a moderate cardiovascular risk profile. Clinical characteristics, stratified by later CVD event status, are listed in Table 2. Participants with CVD events were older and had a more adverse cardiovascular risk profile than those without a future event. The age‐ and sex‐adjusted correlations of serum BDNF levels with clinical cardiovascular risk factors are given in Table 3.
Table 1.
Characteristics of the Study Sample
| Characteristics | Total (N=3687) |
|---|---|
| Age, y | 65±11 |
| Women, n (%) | 2068 (56.1) |
| Body mass index, kg/m2 | 27.9±5.2 |
| Systolic blood pressure, mm Hg | 130±20 |
| Diastolic blood pressure, mm Hg | 73±10 |
| Antihypertensive medication, n (%) | 1354 (36.8) |
| Total cholesterol, mg/dL | 201±37 |
| HDL cholesterol, mg/dL | 53±17 |
| Statin medication, n (%) | 618 (16.8) |
| Current smokers, n (%) | 422 (11.5) |
| Type 2 diabetes, n (%) | 421 (11.5) |
| Prevalent cardiovascular disease, n (%) | 586 (15.9) |
| Physical activity index* | 37.7±6.4 |
| CESD score* | 5.3±6.7 |
| High sensitivity CRP, mg/L, median (interquartile range)* | 2.0 (1.0, 4.9) |
| BNP, ng/L, median (interquartile range)* | 7.7 (4.0, 16.5) |
| Serum BDNF, ng/mL | 23.5 (8.3) |
| Quartile 1, mean (range) | 1.7–17.8 |
| Quartile 2, mean (range) | 17.9–23.2 |
| Quartile 3, mean (range) | 23.2–28.8 |
| Quartile 4, mean (range) | 28.8–64.9 |
Values are mean±SD unless indicated otherwise. HDL indicates high‐density lipoprotein; CESD, Center of Epidemiological Study–Depression Scale; CRP, C‐reactive protein; BNP, B‐type natriuretic peptide; BDNF indicates brain‐derived neurotrophic factor.
Offspring cohort only (n=3018).
Table 2.
Baseline Characteristics of the Study Sample, Stratified by Incident CVD Status During Follow‐up
| Characteristic at Baseline | Incident CVD During Follow‐up | |
|---|---|---|
| No (n=2574) | Yes (n=467) | |
| Age, y | 61±11 | 72±10 |
| Body mass index, kg/m2 | 27.8±5.3 | 28.2±5.3 |
| Systolic blood pressure, mm Hg | 127±19 | 139±20 |
| Diastolic blood pressure, mm Hg | 74±10 | 73±10 |
| Antihypertensive medication, n (%) | 724 (28) | 222 (47) |
| Total cholesterol, mg/dL | 203±36 | 203±37 |
| HDL cholesterol, mg/dL | 55±17 | 51±16 |
| Statin medication, n (%) | 313 (12) | 79 (17) |
| Current smokers, n (%) | 296 (12) | 59 (13) |
| Type 2 diabetes, n (%) | 207 (8) | 71 (15) |
Values are mean±SD unless indicated otherwise. CVD indicates cardiovascular disease; HDL, high‐density lipoprotein.
Table 3.
Correlation Between Serum BDNF and Cardiovascular Risk Factors
| Trait | Correlation |
|---|---|
| Body mass index | 0.011 |
| Systolic blood pressure | 0.013 |
| Diastolic blood pressure | 0.048* |
| Total cholesterol | 0.086† |
| HDL cholesterol | 0.006 |
| Log CRP* | 0.002 |
| Log BNP* | −0.062† |
Data are age‐ and sex‐adjusted partial Pearson correlation coefficients. BDNF indicates brain‐derived neurotrophic factor; HDL, high‐density lipoprotein; CRP, C‐reactive protein; BNP, brain natriuretic peptide.
*P<0.01, †P<0.001.
Offspring cohort only (n=3018).
Serum BDNF and Incidence of CVD Events
The age‐ and sex‐adjusted incidence rates for cardiovascular events during a median follow‐up of 8.5 years, stratified by quartiles of BDNF, are provided in Table 4 (upper half). CVD incidence decreased monotonically across quartiles of BDNF. The results of the proportional hazards regression models relating BDNF levels to CVD incidence are shown in Table 5 (upper half) and Figure 1 (top panel). Each 1‐SD increase in serum BDNF was associated with a 9% to 12% reduced hazard for CVD events. Subjects in the highest quartile of BDNF had a 27% to 32% lower risk for cardiovascular events compared with those in the lowest BDNF quartile. Exploratory analyses additionally adjusting for hsCRP and BNP showed similar results (Table 6). Also, additional adjustment for physical activity index and depressive symptoms (using a CESD score ≥16 to define depression) did not alter our results (hazard ratio for incident CVD per 1‐SD increase in BDNF 0.86, 95% CI 0.76 to 0.97; P=0.01). To further assess the role of smoking behavior, we adjusted our multivariable models for lifetime smoking exposure in pack‐years, which did not influence our findings (data not shown). Similarly, effect estimates did not differ between smokers and nonsmokers (P>0.05 for interaction; data not shown).
Table 4.
BDNF, Cardiovascular Events, and Mortality—Event Rates by BDNF Quartiles
| BDNF | No. of Events/No. at Risk | Person‐years Follow‐up | Incidence Rate per 1000 Person‐years (SE) |
|---|---|---|---|
| Cardiovascular events | |||
| Quartile 1 | 133/737 | 5471 | 26.0 (2.3) |
| Quartile 2 | 129/746 | 5901 | 22.7 (2.1) |
| Quartile 3 | 109/757 | 6215 | 20.4 (2.0) |
| Quartile 4 | 96/801 | 6419 | 20.3 (2.2) |
| All‐cause mortality | |||
| Quartile 1 | 257/921 | 7676 | 31.0 (1.9) |
| Quartile 2 | 237/922 | 8153 | 26.3 (1.7) |
| Quartile 3 | 182/922 | 8286 | 23.0 (1.7) |
| Quartile 4 | 159/922 | 8195 | 23.7 (1.9) |
BDNF indicates brain‐derived neurotrophic factor.
Standardized to the sex‐ and age‐ group (<60, 60–74, >=75 years) distribution of the study sample.
Table 5.
Serum BDNF, Cardiovascular Events, and Mortality—Cox Regression Models
| Cardiovascular Events* | Age‐ and Sex‐Adjusted Model | Multivariable Model* | ||
|---|---|---|---|---|
| Hazard Ratio (95% CI) | P Value | Hazard Ratio (95% CI) | P Value | |
| Continuous trait | ||||
| 1‐SD increase | 0.91 (0.82 to 1.00) | 0.045 | 0.88 (0.80 to 0.97) | 0.01 |
| Quartiles | ||||
| Quartile 1 | 1.00 | Referent | 1.00 | Referent |
| Quartile 2 | 0.90 (0.70 to 1.15) | 0.39 | 0.92 (0.72 to 1.17) | 0.48 |
| Quartile 3 | 0.78 (0.60 to 1.00) | 0.049 | 0.73 (0.56 to 0.95) | 0.02 |
| Quartile 4 | 0.73 (0.56 to 0.95) | 0.02 | 0.68 (0.52 to 0.89) | 0.005 |
| Trend across quartiles | 0.01 | 0.001 | ||
| All‐Cause Mortality | Age‐ and Sex‐Adjusted Model | Multivariable Model* | ||
|---|---|---|---|---|
| Hazard Ratio (95% CI) | P Value | Hazard Ratio (95% CI) | P Value | |
| Continuous trait | ||||
| 1‐SD increase | 0.86 (0.79 to 0.92) | <0.0001 | 0.87 (0.80 to 0.93) | 0.0002 |
| Quartiles | ||||
| Quartile 1 | 1.00 | Referent | 1.00 | Referent |
| Quartile 2 | 0.83 (0.69 to 0.99) | 0.03 | 0.85 (0.71 to 1.02) | 0.08 |
| Quartile 3 | 0.69 (0.57 to 0.84) | 0.0002 | 0.71 (0.58 to 0.86) | 0.0006 |
| Quartile 4 | 0.71 (0.59 to 0.87) | 0.0009 | 0.74 (0.60 to 0.91) | 0.004 |
| Trend across quartiles | <0.0001 | 0.0005 | ||
BDNF indicates brain‐derived neurotrophic factor, cardiovascular disease.
Models derived from 3041 individuals without CVD at baseline.
Adjusted for age, sex, smoking, systolic blood pressure, hypertension treatment, total and high‐density lipoprotein cholesterol, diabetes mellitus, and body mass index and stratified by cohort status.
Adjusted for age, sex, smoking, systolic blood pressure, hypertension treatment, total and high‐density lipoprotein cholesterol, diabetes mellitus, body mass index, and CVD at baseline and stratified by cohort status.
Figure 1.
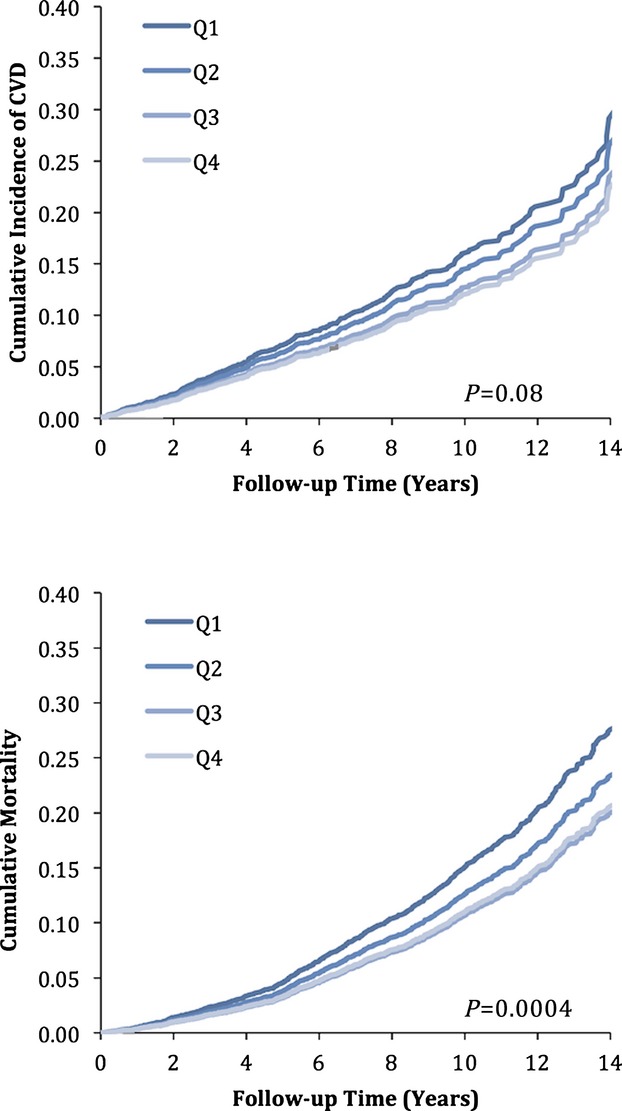
Age‐ and sex‐adjusted cumulative incidence of cardiovascular events (top panel) and all‐cause mortality (bottom panel), stratified by quartiles of serum BDNF. BDNF indicates brain‐derived neurotrophic factor; CVD, cardiovascular disease.
Table 6.
Serum BDNF, Cardiovascular Events, and Mortality—Additional Adjustment for hsCRP and BNP
| CVD Incidence* | Mortality* | |||
|---|---|---|---|---|
| Hazards Ratio (95% CI) | P Value | Hazards Ratio (95% CI) | P Value | |
| Continuous trait | ||||
| 1‐SD increase | 0.85 (0.75 to 0.96) | 0.007 | 0.84 (0.75 to 0.94) | 0.002 |
| Quartiles | ||||
| Quartile 1 | 1.00 | Referent | 1.00 | Referent |
| Quartile 2 | 0.95 (0.69 to 1.31) | 0.76 | 0.81 (0.61 to 1.09) | 0.17 |
| Quartile 3 | 0.74 (0.52 to 1.03) | 0.08 | 0.68 (0.49 to 0.94) | 0.02 |
| Quartile 4 | 0.60 (0.43 to 0.86) | 0.005 | 0.69 (0.50 to 0.94) | 0.02 |
| Trend across quartiles | 0.002 | 0.009 | ||
BDNF indicates brain‐derived neurotrophic factor; BNP, brain natriuretic peptide; hsCRP, high‐sensivity C‐reactive protein; CVD, cardiovascular disease.
Based on 270 events in 2439 participants of the Framingham Offspring cohort free of CVD at baseline. Models adjusted for age, sex, smoking, systolic blood pressure, hypertension treatment, total and high‐density lipoprotein cholesterol, diabetes mellitus, body mass index, hsCRP, and BNP.
Based on 311 events in 2811 participants of the Framingham Offspring cohort. Models adjusted for age, sex, smoking, systolic blood pressure, hypertension treatment, total and high‐density lipoprotein cholesterol, diabetes mellitus, body mass index, prevalent CVD, hsCRP, and BNP.
In multivariable‐adjusted splines (Figure 2, top panel), serum BDNF was linearly and inversely associated with CVD risk.
Figure 2.
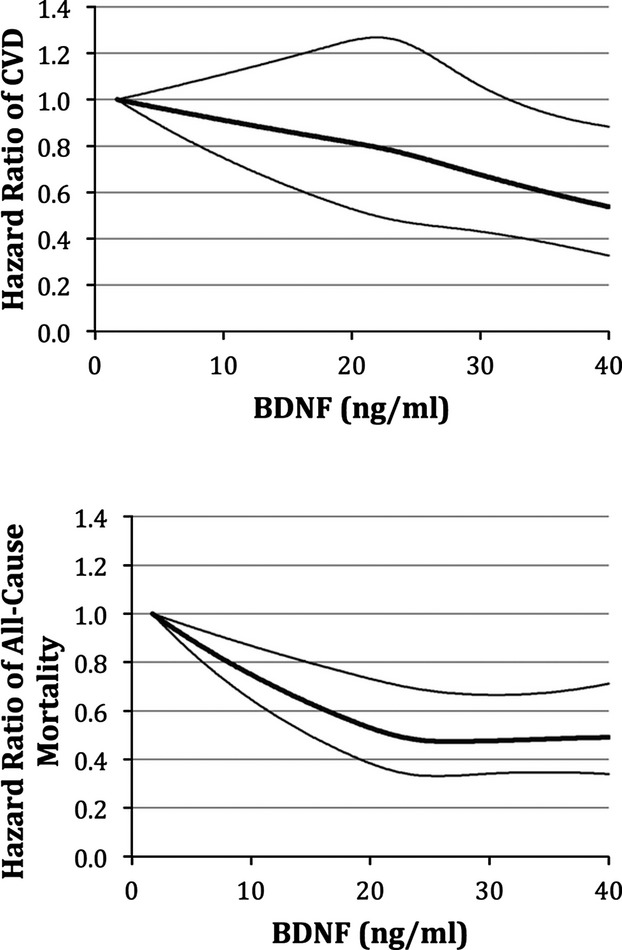
Relations of serum BDNF with cardiovascular events (top panel) and all‐cause mortality (bottom panel)—multivariable adjusted spline regression. BDNF indicates brain‐derived neurotrophic factor; CVD, cardiovascular disease.
Serum BDNF and All‐Cause Mortality
The age‐ and sex‐adjusted incidence rates for all‐cause mortality during a median follow‐up of 8.9 years, stratified by quartiles of the BDNF distribution, are shown in Table 4 (lower half). The results of the Cox regression models are displayed in Table 5 (lower half) and Figure 1 (bottom panel). Each 1‐SD increase in BDNF was associated with a 13% to 14% reduced hazard of death. Individuals in the highest quartile of BDNF had a 26% to 29% lower risk of death compared with those in the lowest quartile. Our findings remained robust in models additionally adjusting for hsCRP and BNP (Table 6) and for physical activity index and the CESD score (hazard ratio for death per 1‐SD increase in BDNF=0.87, 95% CI 0.77 to 0.97; P=0.02). Again, adjustment for life‐time smoking exposure did not alter findings (data not shown), nor did effect estimates differ between smokers and nonsmokers (P>0.05 for interaction).
Increasing serum BDNF showed a linear relationship with lower all‐cause mortality through most of the distribution of values, although the relationship plateaued at the upper end of the distribution (Figure 2, bottom panel).
BDNF and CVD Risk Prediction
BDNF did not significantly increase the c‐statistic of our standard risk factor model for cardiovascular events (area under the curve 0.756 versus 0.759, P=0.99). However, both IDI (0.004, 95% CI 0.001 to 0.006, P<0.05) and category‐free NRI (0.198, 95% CI 0.049 to 0.352, P<0.05) were statistically significant. Similarly, serum BDNF did not improve the c‐statistic of our standard risk factor model for mortality (area under the curve 0.793 versus 0.810, P=0.97); however, IDI (0.005, 95% CI 0.002 to 0.008, P<0.05) and category‐free NRI (0.225, 95% CI 0.120 to 0.325, P<0.05) were statistically significant.
Mendelian Randomization
To assess whether the association between circulating BDNF levels and CVD may be causal, we used a known functional genetic variant in the BDNF gene (rs6265) and performed a Mendelian randomization experiment as detailed earlier.21
We genotyped rs6265 in 3089 Framingham participants and assessed its association with circulating BDNF levels. By assuming an additive genetic model and adjusting for age and sex, each copy of the minor T allele was associated with 0.772 ng/mL higher BDNF levels (95% CI 0.242 to 1.303, P=0.0043; Figure 3). Based on the effect estimate for the association between circulating BDNF levels and incident CVD reported earlier here (Table 5), an increase of 0.772 ng/mL in BDNF levels translates into a predicted hazard ratio for CVD of 0.991 (95% CI 0.982 to 1.000, P=0.045) per T allele. The actual observed age‐ and sex‐adjusted odds ratio for CAD associated with 1 T allele of rs6265 in CARDIoGRAM was 0.957 (0.923 to 0.992, P=0.016) and did not differ significantly from the predicted effect size derived from the Framingham cohort (P=0.062 for difference between observed and predicted effect size; Figure 3), suggesting that the association between BDNF and CVD risk is likely causal.
Figure 3.
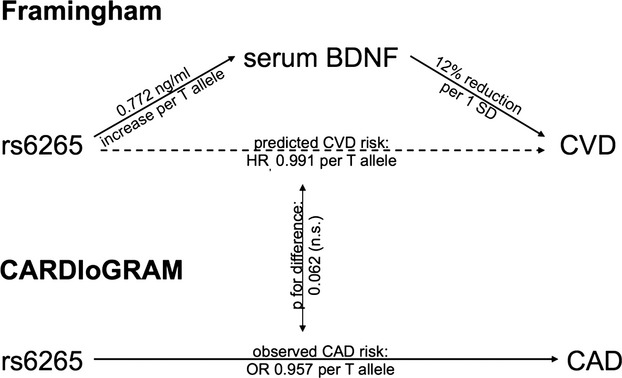
Mendelian randomization experiment. BDNF indicates brain‐derived neurotrophic factor; CAD, coronary artery disease; CVD, cardiovascular disease; HR, hazard ratio.
Discussion
We prospectively investigated the relation of serum BDNF concentrations with CVD events and mortality in a large community‐based sample. We observed that higher levels of BDNF are associated with lower risk of both CVD events and death, independent of standard risk factors, including markers of low‐grade inflammation, BMI, physical activity, and depression. Individuals in the highest quartile of BDNF had an ≈25% to 30% lower adjusted risk for future CVD events and death compared with those in the lowest quartile. The biologic plausibility, demonstration of a dose‐response relation (in quartile‐based analyses and splines), consistency of association across multiple analyses, the temporal relation (BDNF levels were measured before the outcomes of interest), and the results of the Mendelian randomization experiment are consistent with the notion that the association is indeed a causal one.24
Epidemiological Data on BDNF and CVD
Existing epidemiological data regarding the relation of circulating BDNF concentrations with CVD and mortality are sparse and inconclusive. A small case‐control study of 31 patients with acute coronary syndrome and 19 healthy controls conducted by Manni and collegues observed lower plasma levels of BDNF in the acute coronary syndrome cases compared with the controls, possibly suggesting a protective role of BDNF.25 Krabbe and collegues reported that plasma BDNF was inversely associated with mortality in a sample of 188 elderly women.6 Recently, Jian and collegues investigated plasma BDNF concentrations in 885 patients with angina.5 They observed a cross‐sectional association of BDNF levels with CVD risk factors in a protective direction. Furthermore, higher BDNF levels were prospectively associated with a lower incidence of major coronary events in their high‐risk referral sample.5 Recently, Hallden and collegues reported in a large sample of smokers that a polymorphism in the BDNF (rs4923461) gene is associated with all‐cause and cardiovascular mortality but not with incident CVD.26 Serum BDNF was not measured in their study.
To our knowledge, our study is the first prospective analysis in a large community‐based cohort demonstrating that higher serum BDNF levels are associated with a decreased risk for future CVD events and mortality.
Possible Mechanisms
BDNF, a member of the neurotrophin family, is involved in the regulation of a broad range of physiological functions including neuronal development and plasticity, food intake, and physical activity.27 As noted earlier, heterozygous BDNF knockout mice consume more food than do their wild‐type littermates and are obese.2 At the same time, these BDNF knockout mice are hyperactive, not lethargic, despite their obesity. This observation has led to the concept that BDNF may be released in response to a challenging environment with high locomotor and intellectual requirements and scarce food.27 Altered BDNF levels have been reported in various neuropsychiatric diseases; for example, depression appears to be associated with decreased serum BDNF concentrations.28
Besides its important role in neurobiology, there is increasing evidence that BDNF is also involved in cardiovascular health and atherosclerosis. BDNF is expressed in vascular endothelial cells,29 macrophages, and smooth muscle cells of atherosclerotic coronary arteries.7 In one study, patients with unstable angina have been reported to have increased BDNF levels in the coronary circulation compared with individuals with stable angina, possibly suggesting that BDNF may be involved in stability of the atherosclerotic plaque.7 In the same study, BDNF administration increased NAPD(H) oxidase activity of human coronary artery smooth muscle cells in vitro, suggesting that BDNF may indeed have a detrimental effect on plaque stability. Nevertheless, the clinical relevance of these observations remains to be elucidated.
Conversely, BDNF has been shown to play a crucial role in the development and maintenance of the cardiac vasculature. BDNF deficiency in mice impairs the survival of endothelial cells in myocardial arteries and capillaries, leading to early postnatal death.3 Conditional BDNF knockout mice with experimental myocardial infarction showed larger areas of fibrosis and impaired revascularization and, as a consequence, greater impairment of systolic function than controls.4 These differences appeared consequent to altered expression of BDNF in the brain (not in the heart) in response to the ischemic event, stimulated via cardiac afferent autonomous nerves after myocardial infarction.
Of note, polymorphisms in the BDNF gene have been associated with BMI in recent genome‐wide association studies.30 We, therefore, adjusted our multivariable models for BMI and diabetes, which did not alter our findings, rendering obesity an unlikely explanation for associations observed in our study. Similarly, polymorphisms in the BDNF gene have been associated with smoking behavior, with the A/C Met allele at rs6265 associated with both lower BDNF levels and a slightly increased risk of being a smoker.26,31 We therefore extensively investigated the potential impact of smoking on our findings using different statistical approaches. We did not find evidence for a relevant role of smoking in the relation between BDNF and CVD or mortality.
Taken together, it seems feasible that circulating BDNF levels are protective by maintaining vascular integrity and that these protective systemic effects outweigh potential detrimental local effects on plaque stability.
We observed that higher BDNF levels are linearly associated with lower risk for CVD events, whereas the protective association with all‐cause mortality abates at higher BDNF levels. This may suggest that the protective cardiovascular effects of high BDNF levels may be counterbalanced by potential detrimental effects on non‐CVD; for example, high BDNF levels may promote cancer cell growth.32
Clinical Implications
Our data indicate that measuring BDNF only marginally improves cardiovascular risk prediction. BDNF measurements did not improve the area under the receiver operating characteristic curve (for cardiovascular events); only IDI and NRI were nominally significant. Thus, it is unlikely that serum BDNF is of relevant clinical value for diagnosing or predicting CVD. However, our findings may be of pathophysiological interest. Indeed, modulating BDNF signaling may be a promising therapeutic concept. Of note, the relatively modest effect of SNP rs6265 on BDNF levels and CVD risk does not necessarily translate into a trivial role of the BDNF protein in the pathogenesis of CVD. In fact, most common SNPs reported in recent genome‐wide association studies have only modest effect sizes, but therapeutic modulation of the respective proteins may have a far greater impact. For example, SNP rs2479409 in PCSK9 is associated with an ≈2 mg/dL alteration in LDL cholesterol levels (per allele), but PCSK9 antibodies lower LDL cholesterol by almost 60 mg/dL.33–34
Given the pivotal role of BDNF in neuroplasticity, until now therapeutic applications of BDNF (agonists) have mainly been motivated by neurovascular and neurodegenerative diseases. In this context, an oral selective BDNF agonist derived from plant flavonoids showed promising results in mouse models of stroke and Parkinson's disease.35 Further investigations are warranted to clarify whether BDNF agonists or pharmacological interventions aimed at increasing circulating BDNF may be applicable for reducing cardiovascular risk. In particular, it remains to be shown whether the potential cardioprotective effects of BDNF outweigh the theoretical potential to promote cancer growth.
Limitations
Some limitations of our investigation should be discussed. Our FHS sample is primarily white of European ancestry and middle‐aged to elderly. We estimated association of SNP rs6265 with serum BDNF in this homogeneous but age‐ and ethnicity‐restricted sample, whereas the association of the SNP with CAD was explored in the far larger, and relatively more heterogeneous, CARDIoGRAM consortium. Measuring serum BDNF in CARDIoGRAM was not feasible. The effect size for the SNP was somewhat stronger in CARDioGRAM relative to that estimated in FHS (although the 2 were not statistically different). This may be due to the possibility that the SNP captures effects at a tissue level (as opposed to blood levels) and likely reflects lifelong exposure as opposed to a single‐occasion peripheral blood measurement that may be more susceptible to regression dilution bias. Moreover, our FHS study sample is of limited size. We therefore a priori decided to analyze a very broad end point to maximize statistical power. Our study sample was not sufficiently powered to derive meaningful results for specific cardiovascular end points. Larger analyses will be necessary to address these questions.
Conclusions
Higher serum BDNF is associated with a decreased risk of cardiovascular events and mortality. Mendelian randomization supports a causal protective effect of BDNF on CVD. If confirmed, our findings raise the possibility that pharmacological interventions aimed at increasing systemic BDNF signaling may be a promising tool for modulating cardiovascular risk.
Supplementary Material
Appendix The CARDIogram consortium.
Sources of Funding
This work was supported by the National Heart, Lung, and Blood Institute's Framingham Heart Study (N01‐HC‐25195). BDNF measurements were supported by the National Institute on Aging (AG031287; Seshadri). Funding sources for the CARDIoGRAM consortium are detailed in Appendix S1.
Disclosures
Drs Kaess, Preis, Lieb, Beiser, Yang, Chen, Hengstenberg, Erdmann, Schunkert, Seshadri, and Vasan report no conflicts of interest. Disclosures of members of the CARDIoGram consortium are listed in Appendix S1.
References
- Caporali A, Emanueli C. Cardiovascular actions of neurotrophins. Physiol Rev. 2009; 89:279-308. [DOI] [PMC free article] [PubMed] [Google Scholar]
- Kernie SG, Liebl DJ, Parada LF. BDNF regulates eating behavior and locomotor activity in mice. EMBO J. 2000; 19:1290-1300. [DOI] [PMC free article] [PubMed] [Google Scholar]
- Donovan MJ, Lin MI, Wiegn P, Ringstedt T, Kraemer R, Hahn R, Wang S, Ibanez CF, Rafii S, Hempstead BL. Brain derived neurotrophic factor is an endothelial cell survival factor required for intramyocardial vessel stabilization. Development. 2000; 127:4531-4540. [DOI] [PubMed] [Google Scholar]
- Okada S, Yokoyama M, Toko H, Tateno K, Moriya J, Shimizu I, Nojima A, Ito T, Yoshida Y, Kobayashi Y, Katagiri H, Minamino T, Komuro I. Brain‐derived neurotrophic factor protects against cardiac dysfunction after myocardial infarction via a central nervous system‐mediated pathway. Arterioscler Thromb Vasc Biol. 2012; 32:1902-1909. [DOI] [PubMed] [Google Scholar]
- Jiang H, Liu Y, Zhang Y, Chen ZY. Association of plasma brain‐derived neurotrophic factor and cardiovascular risk factors and prognosis in angina pectoris. Biochem Biophys Res Commun. 2011; 415:99-103. [DOI] [PubMed] [Google Scholar]
- Krabbe KS, Mortensen EL, Avlund K, Pedersen AN, Pedersen BK, Jorgensen T, Bruunsgaard H. Brain‐derived neurotrophic factor predicts mortality risk in older women. J Am Geriatr Soc. 2009; 57:1447-1452. [DOI] [PubMed] [Google Scholar]
- Ejiri J, Inoue N, Kobayashi S, Shiraki R, Otsui K, Honjo T, Takahashi M, Ohashi Y, Ichikawa S, Terashima M, Mori T, Awano K, Shinke T, Shite J, Hirata K, Yokozaki H, Kawashima S, Yokoyama M. Possible role of brain‐derived neurotrophic factor in the pathogenesis of coronary artery disease. Circulation. 2005; 112:2114-2120. [DOI] [PubMed] [Google Scholar]
- Kannel WB, Dawber TR, Kagan A, Revotskie N, Stokes J., III Factors of risk in the development of coronary heart disease–six year follow‐up experience. The Framingham Study. Ann Intern Med. 1961; 55:33-50. [DOI] [PubMed] [Google Scholar]
- Kannel WB, Feinleib M, McNamara PM, Garrison RJ, Castelli WP. An investigation of coronary heart disease in families. The Framingham offspring study. Am J Epidemiol. 1979; 110:281-290. [DOI] [PubMed] [Google Scholar]
- Kannel WB, Sorlie P. Some health benefits of physical activity. The Framingham Study. Arch Intern Med. 1979; 139:857-861. [PubMed] [Google Scholar]
- Geerlings SW, Beekman AT, Deeg DJ, Twisk JW, Van Tilburg W. Duration and severity of depression predict mortality in older adults in the community. Psychol Med. 2002; 32:609-618. [DOI] [PubMed] [Google Scholar]
- Upadhyay A, Larson MG, Guo CY, Vasan RS, Lipinska I, O'Donnell CJ, Kathiresan S, Meigs JB, Keaney JF, Jr, Rong J, Benjamin EJ, Fox CS. Inflammation, kidney function and albuminuria in the Framingham Offspring cohort. Nephrol Dial Transplant. 2011; 26:920-926. [DOI] [PMC free article] [PubMed] [Google Scholar]
- Wang TJ, Larson MG, Levy D, Benjamin EJ, Leip EP, Wilson PW, Vasan RS. Impact of obesity on plasma natriuretic peptide levels. Circulation. 2004; 109:594-600. [DOI] [PubMed] [Google Scholar]
- Friedman GD, Kannel WB, Dawber TR, McNamara PM. An evaluation of follow‐up methods in the Framingham Heart Study. Am J Public Health Nations Health. 1967; 57:1015-1024. [DOI] [PMC free article] [PubMed] [Google Scholar]
- Preuss M, Konig IR, Thompson JR, Erdmann J, Absher D, Assimes TL, Blankenberg S, Boerwinkle E, Chen L, Cupples LA, Hall AS, Halperin E, Hengstenberg C, Holm H, Laaksonen R, Li M, Marz W, McPherson R, Musunuru K, Nelson CP, Burnett MS, Epstein SE, O'Donnell CJ, Quertermous T, Rader DJ, Roberts R, Schillert A, Stefansson K, Stewart AF, Thorleifsson G, Voight BF, Wells GA, Ziegler A, Kathiresan S, Reilly MP, Samani NJ, Schunkert HConsortium CA. Design of the coronary artery disease genome‐wide replication and meta‐analysis (CARDIoGRAM) Study: a genome‐wide association meta‐analysis involving more than 22 000 cases and 60 000 controls. Circ Cardiovasc Genet. 2010; 3:475-483. [DOI] [PMC free article] [PubMed] [Google Scholar]
- Pencina MJ, D'Agostino RB, Sr, Larson MG, Massaro JM, Vasan RS. Predicting the 30‐year risk of cardiovascular disease: the Framingham Heart Study. Circulation. 2009; 119:3078-3084. [DOI] [PMC free article] [PubMed] [Google Scholar]
- Guo Y, Lanktree MB, Taylor KC, Hakonarson H, Lange LA, Keating BJConsortium IKSaB. Gene‐centric meta‐analyses of 108 912 individuals confirm known body mass index loci and reveal three novel signals. Hum Mol Genet. 2013; 22:184-201. [DOI] [PMC free article] [PubMed] [Google Scholar]
- Durrleman S, Simon R. Flexible regression models with cubic splines. Stat Med. 1989; 8:551-561. [DOI] [PubMed] [Google Scholar]
- Pencina MJ, D'Agostino RB, Sr, D'Agostino RB, Jr, Vasan RS. Evaluating the added predictive ability of a new marker: from area under the ROC curve to reclassification and beyond. Stat Med. 2008; 27:157-172.‐ [DOI] [PubMed] [Google Scholar]
- Pencina MJ, D'Agostino RB, Sr, Steyerberg EW. Extensions of net reclassification improvement calculations to measure usefulness of new biomarkers. Stat Med. 2011; 30:11-21. [DOI] [PMC free article] [PubMed] [Google Scholar]
- Thanassoulis G. Mendelian randomization: how genetics is pushing the boundaries of epidemiology to identify new causes of heart disease. Can J Cardiol. 2013; 29:30-36. [DOI] [PubMed] [Google Scholar]
- Schunkert H, Samani NJ. Elevated C‐reactive protein in atherosclerosis–chicken or egg? N Engl J Med. 2008; 359:1953-1955. [DOI] [PubMed] [Google Scholar]
- Jansen H, Samani NJ, Schunkert H. Mendelian randomization studies in coronary artery disease. Eur Heart J. 2014; 35:1917-1924. [DOI] [PubMed] [Google Scholar]
- Bradford‐Hill A. The environment and disease: association or causation? Proc R Soc Med. 1965; 58:295-300. [DOI] [PMC free article] [PubMed] [Google Scholar]
- Manni L, Nikolova V, Vyagova D, Chaldakov GN, Aloe L. Reduced plasma levels of NGF and BDNF in patients with acute coronary syndromes. Int J Cardiol. 2005; 102:169-171. [DOI] [PubMed] [Google Scholar]
- Hallden S, Sjogren M, Hedblad B, Engstrom G, Narkiewicz K, Hoffmann M, Wahlstrand B, Hedner T, Melander O. Smoking and obesity associated BDNF gene variance predicts total and cardiovascular mortality in smokers. Heart. 2013; 99:949-953. [DOI] [PubMed] [Google Scholar]
- Rothman SM, Griffioen KJ, Wan R, Mattson MP. Brain‐derived neurotrophic factor as a regulator of systemic and brain energy metabolism and cardiovascular health. Ann N Y Acad Sci. 2012; 1264:49-63. [DOI] [PMC free article] [PubMed] [Google Scholar]
- Sen S, Duman R, Sanacora G. Serum brain‐derived neurotrophic factor, depression, and antidepressant medications: meta‐analyses and implications. Biol Psychiatry. 2008; 64:527-532. [DOI] [PMC free article] [PubMed] [Google Scholar]
- Nakahashi T, Fujimura H, Altar CA, Li J, Kambayashi J, Tandon NN, Sun B. Vascular endothelial cells synthesize and secrete brain‐derived neurotrophic factor. FEBS Lett. 2000; 470:113-117. [DOI] [PubMed] [Google Scholar]
- Thorleifsson G, Walters GB, Gudbjartsson DF, Steinthorsdottir V, Sulem P, Helgadottir A, Styrkarsdottir U, Gretarsdottir S, Thorlacius S, Jonsdottir I, Jonsdottir T, Olafsdottir EJ, Olafsdottir GH, Jonsson T, Jonsson F, Borch‐Johnsen K, Hansen T, Andersen G, Jorgensen T, Lauritzen T, Aben KK, Verbeek AL, Roeleveld N, Kampman E, Yanek LR, Becker LC, Tryggvadottir L, Rafnar T, Becker DM, Gulcher J, Kiemeney LA, Pedersen O, Kong A, Thorsteinsdottir U, Stefansson K. Genome‐wide association yields new sequence variants at seven loci that associate with measures of obesity. Nat Genet. 2009; 41:18-24. [DOI] [PubMed] [Google Scholar]
- Tobacco Genetics C. Genome‐wide meta‐analyses identify multiple loci associated with smoking behavior. Nat Genet. 2010; 42:441-447. [DOI] [PMC free article] [PubMed] [Google Scholar]
- Hondermarck H. Neurotrophins and their receptors in breast cancer. Cytokine Growth Factor Rev. 2012; 23:357-365. [DOI] [PubMed] [Google Scholar]
- Teslovich TM, Musunuru K, Smith AV, Edmondson AC, Stylianou IM, Koseki M, Pirruccello JP, Ripatti S, Chasman DI, Willer CJ, Johansen CT, Fouchier SW, Isaacs A, Peloso GM, Barbalic M, Ricketts SL, Bis JC, Aulchenko YS, Thorleifsson G, Feitosa MF, Chambers J, Orho‐Melander M, Melander O, Johnson T, Li X, Guo X, Li M, Shin Cho Y, Jin Go M, Jin Kim Y, Lee JY, Park T, Kim K, Sim X, Twee‐Hee Ong R, Croteau‐Chonka DC, Lange LA, Smith JD, Song K, Hua Zhao J, Yuan X, Luan J, Lamina C, Ziegler A, Zhang W, Zee RY, Wright AF, Witteman JC, Wilson JF, Willemsen G, Wichmann HE, Whitfield JB, Waterworth DM, Wareham NJ, Waeber G, Vollenweider P, Voight BF, Vitart V, Uitterlinden AG, Uda M, Tuomilehto J, Thompson JR, Tanaka T, Surakka I, Stringham HM, Spector TD, Soranzo N, Smit JH, Sinisalo J, Silander K, Sijbrands EJ, Scuteri A, Scott J, Schlessinger D, Sanna S, Salomaa V, Saharinen J, Sabatti C, Ruokonen A, Rudan I, Rose LM, Roberts R, Rieder M, Psaty BM, Pramstaller PP, Pichler I, Perola M, Penninx BW, Pedersen NL, Pattaro C, Parker AN, Pare G, Oostra BA, O'Donnell CJ, Nieminen MS, Nickerson DA, Montgomery GW, Meitinger T, McPherson R, McCarthy MI, McArdle W, Masson D, Martin NG, Marroni F, Mangino M, Magnusson PK, Lucas G, Luben R, Loos RJ, Lokki ML, Lettre G, Langenberg C, Launer LJ, Lakatta EG, Laaksonen R, Kyvik KO, Kronenberg F, Konig IR, Khaw KT, Kaprio J, Kaplan LM, Johansson A, Jarvelin MR, Janssens AC, Ingelsson E, Igl W, Kees Hovingh G, Hottenga JJ, Hofman A, Hicks AA, Hengstenberg C, Heid IM, Hayward C, Havulinna AS, Hastie ND, Harris TB, Haritunians T, Hall AS, Gyllensten U, Guiducci C, Groop LC, Gonzalez E, Gieger C, Freimer NB, Ferrucci L, Erdmann J, Elliott P, Ejebe KG, Doring A, Dominiczak AF, Demissie S, Deloukas P, de Geus EJ, de Faire U, Crawford G, Collins FS, Chen YD, Caulfield MJ, Campbell H, Burtt NP, Bonnycastle LL, Boomsma DI, Boekholdt SM, Bergman RN, Barroso I, Bandinelli S, Ballantyne CM, Assimes TL, Quertermous T, Altshuler D, Seielstad M, Wong TY, Tai ES, Feranil AB, Kuzawa CW, Adair LS, Taylor HA, Jr, Borecki IB, Gabriel SB, Wilson JG, Holm H, Thorsteinsdottir U, Gudnason V, Krauss RM, Mohlke KL, Ordovas JM, Munroe PB, Kooner JS, Tall AR, Hegele RA, Kastelein JJ, Schadt EE, Rotter JI, Boerwinkle E, Strachan DP, Mooser V, Stefansson K, Reilly MP, Samani NJ, Schunkert H, Cupples LA, Sandhu MS, Ridker PM, Rader DJ, van Duijn CM, Peltonen L, Abecasis GR, Boehnke M, Kathiresan S. Biological, clinical and population relevance of 95 loci for blood lipids. Nature. 2010; 466:707-713. [DOI] [PMC free article] [PubMed] [Google Scholar]
- Roth EM, McKenney JM, Hanotin C, Asset G, Stein EA. Atorvastatin with or without an antibody to PCSK9 in primary hypercholesterolemia. N Engl J Med. 2012; 367:1891-1900. [DOI] [PubMed] [Google Scholar]
- Jang SW, Liu X, Yepes M, Shepherd KR, Miller GW, Liu Y, Wilson WD, Xiao G, Blanchi B, Sun YE, Ye K. A selective TrkB agonist with potent neurotrophic activities by 7,8‐dihydroxyflavone. Proc Natl Acad Sci USA. 2010; 107:2687-2692. [DOI] [PMC free article] [PubMed] [Google Scholar]
Associated Data
This section collects any data citations, data availability statements, or supplementary materials included in this article.
Supplementary Materials
Appendix The CARDIogram consortium.