Abstract
Background
Endothelin 1 (ET‐1) contributes to chronic kidney disease (CKD) development and progression, and endothelin receptor antagonists are being investigated as a novel therapy for CKD. The proET‐1 peptides, endothelin‐like domain peptide (ELDP) and C‐terminal pro‐ET‐1 (CT‐proET‐1), are both potential biomarkers of CKD and response to therapy with endothelin antagonists.
Methods and Results
We assessed plasma and urine ELDP and plasma CT‐proET‐1 in CKD patients with minimal comorbidity. Next, in a randomized double‐blind crossover study of 27 subjects with proteinuric CKD, we examined the effects of 6 weeks of treatment with placebo, sitaxentan (endothelin A antagonist), and nifedipine on these peptides alongside the primary end points of proteinuria, blood pressure, and arterial stiffness. Plasma ELDP and CT‐proET‐1 increased with CKD stage (both P<0.0001), correlating inversely with estimated glomerular filtration rate (both P<0.0001). Following intervention, placebo and nifedipine did not affect plasma and urine ELDP or plasma CT‐proET‐1. Sitaxentan increased both plasma ELDP and CT‐proET‐1 (baseline versus week 6±SEM: ELDP, 11.8±0.5 versus 13.4±0.6 fmol/mL; CT‐proET‐1, 20.5±1.2 versus 23.3±1.5 fmol/mL; both P<0.0001). Plasma ET‐1 was unaffected by any treatment. Following sitaxentan, plasma ELDP and CT‐proET‐1 correlated negatively with 24‐hour urinary sodium excretion.
Conclusions
ELDP and CT‐proET‐1 increase in CKD and thus are potentially useful biomarkers of renal injury. Increases in response to endothelin A antagonism may reflect EDN1 upregulation, which may partly explain fluid retention with these agents.
Clinical Trial Registration
URL: www.clinicalTrials.gov Unique identifier: NCT00810732
Keywords: antagonists, CKD, endothelin, fluid retention
Introduction
Chronic kidney disease (CKD) is common and affects 6% to 11% of the population globally.1 It is strongly associated with incident cardiovascular disease.2 As glomerular filtration rate (GFR) declines, the risk of cardiovascular disease increases.3 Consequently, early detection of CKD is important to reduce morbidity and mortality. Current measures of renal function (eg, using serum creatinine) are often inadequate because substantial renal tissue damage must occur before function is impaired to a detectable extent.4 An unmet need exists for more sensitive biomarkers of renal injury that will allow earlier detection of CKD and that will potentially reflect efficacy of therapy.
Endothelin 1 (ET‐1) is a potent endogenous vasoconstrictor. It is implicated in both the development and progression of CKD5 and plays an important role in renal salt and water handling.6 Its effects are mediated via 2 receptors, the endothelin A (ETA) and endothelin B (ETB) receptors, with the major pathological effects mediated by the ETA receptor.5 Several selective ETA and mixed ETA/B receptor antagonists are now available and licensed for the treatment of pulmonary arterial hypertension and scleroderma digital ulcers. Endothelin receptor antagonists are also being investigated as a novel therapeutic strategy in CKD.7 Although urinary ET‐1 excretion is well correlated with renal ET‐1 production,8–9 plasma ET‐1 is an unreliable measure of vascular ET‐1 production because of the predominantly abluminal release of ET‐1,10 its rapid receptor‐mediated uptake,5 and technical limitations in measurement.11 Endothelin‐like domain peptide (ELDP; preproET‐1[93–166])12 and C‐terminal pro‐ET‐1 (CT‐proET‐1; preproET‐1[169–212]) are both cosynthesized with ET‐1 from the EDN1 gene (Figure 1). They are more stable in the circulation and may be alternative markers of ET‐1 synthesis.12
Figure 1.

Schematic outline of the amino acid structure of preproET‐1 indicating the peptides generated by post‐translational processing. Positions of ELDP (preproET‐1[93–166]) and CT‐proET‐1 (preproET‐1[169–212]) are shown. ET‐1 is produced from big ET‐1 by endothelin‐converting enzyme. CT‐proET‐1 indicates C‐terminal pro‐endothelin‐1; ELDP, endothelin‐like domain peptide; ET‐1, endothelin 1; preproET‐1, prepro‐endothelin‐1.
We previously investigated novel cardiovascular disease risk factors in CKD patients across a wide range of renal function13–14 and showed that plasma and urine ET‐1 increase as GFR declines.15 We showed recently that chronic selective ETA receptor antagonism using the orally active drug sitaxentan reduces proteinuria, blood pressure (BP), and arterial stiffness—effects that are potentially renoprotective—in patients with proteinuric CKD.16 We hypothesized that in these same cohorts of patients, the proET‐1 peptides ELDP and CT‐proET‐1 would increase as GFR declined. Whether sitaxentan treatment would alter proET‐1 peptide levels was unclear, but we hypothesized that any changes would relate to changes in urine sodium excretion.
Methods
Both studies were performed with the approval of the local research ethics committee and the written informed consent of each subject. The investigations conformed to the principles outlined in the Declaration of Helsinki.
Observational Study: Patients With Varying Degrees of CKD and Minimal Comorbidity
The rationale and study design have been reported in detail elsewhere.13 In brief, subjects were recruited from the renal outpatient clinic at the Royal Infirmary of Edinburgh and categorized into the 5 stages of CKD on the basis of the Kidney Disease Outcome Quality Initiative (K/DOQI) classification.17 Age‐matched controls were recruited from the community. Creatinine clearance, as an estimate of GFR (eGFR), was calculated according to the Cockcroft and Gault equation.18 This equation was selected to assess renal function in this study because it is more accurate than the Modification of Diet in Renal Disease (MDRD) equation if used to assess mild renal insufficiency.19 It was further corrected by body surface area. Blood and urine samples were obtained from subjects after 12 hours of overnight fasting.
Interventional Study: Selective ETA Receptor Antagonism in CKD
The rationale and design for this study have been reported elsewhere.16 In brief, in a randomized, double‐blind, 3‐way crossover study, 27 subjects on recommended renoprotective treatment received 6 weeks of placebo, sitaxentan 100 mg once daily, and nifedipine LA 30 mg once daily. 24‐hour proteinuria; urine protein:creatinine ratio; 24‐hour ambulatory BP; and pulse wave velocity, as an index of arterial stiffness, were measured at baseline, week 3, and week 6 of each treatment period. Plasma and urine ELDP and ET‐1 and plasma CT‐proET‐1 were also assessed at these same time points.
Sample Collection and Analysis
ELDP, CT‐proET‐1, and ET‐1 venous blood samples were collected in EDTA tubes and were immediately centrifuged at 2500g for 20 minutes at 4°C. For urine ELDP, a 20‐mL aliquot of urine was collected into plain tubes. For urine ET‐1, a 20‐mL aliquot of urine was collected into plain tubes with 2.5 mL of 50% acetic acid. Samples were stored at −80°C until analysis.
ELDP and CT‐proET‐1 were measured by sandwich ELISA (Figure 1) using previously described methodologies.20 A well‐established format was followed using specific IgG that had been affinity purified from polyclonal sheep antisera raised against the N‐ and C‐terminal sequences of each peptide. Assays were performed in 96‐well plates coated with capture IgG (1 μg/mL) specific for ELDP (anti‐preproET‐1[93–109] [ALENLLPTKATDRENRC]) or CT‐proET‐1 (anti‐preproET‐1[169–186] [SSEEHLRQTRSETMRNSV]). Following overnight incubation (25 μL of plasma or 100 μL urine), detection of bound peptide was achieved with biotinylated IgG for ELDP (preproET‐1[155–166] [CIYQQLVRGRKI]) or CT‐proET‐1 (preproET‐1[204–212] [YVTHNRAHW]), respectively. This was in conjunction with NeutrAvidin HRP (Pierce; Thermo Fisher Scientific) and chemiluminescent substrate. Synthetic peptides were used as assay standards.12 The lower limit of detection for ELDP was 0.09 fmol/mL in urine and 0.30 fmol/mL in plasma. The detection limit for CT‐proET‐1 in plasma was 0.60 fmol/mL. Urine CT‐proET‐1 could not be measured reliably using either a double‐recognition‐site sandwich ELISA or a single‐site ELISA directed at the C‐terminal sequence of CT‐proET‐1.
After extraction,21 ET‐1 was determined by radioimmunoassay.22 The mean recovery of ET‐1, from extraction to assay, was >90% for both plasma and urine. The intra‐ and interassay variations were 6.3% and 7.2%, respectively. The cross‐reactivity of the antibody was 100% with ET‐1, 7% for both ET‐2 and ET‐3, and 10% with big ET‐1.
Statistical Analysis
Data were statistically analyzed using GraphPad Prism version 5. Descriptive data are given as mean±SD. Statistical analysis was performed on untransformed data. Data were compared using repeated‐measures, 1‐way ANOVA with Bonferroni correction for multiple comparisons. For the observational study, stepwise linear regression was used to identify factors that predicted eGFR. Correlation coefficients were calculated using the Pearson method. Statistical significance was taken at the 5% level.
Results
Observational Study
Plasma and urine proET‐1 peptides levels across CKD stages
Subject characteristics are shown in Table 1. Plasma ELDP concentration increased with CKD stage (P<0.0001 for trend), with control subjects having plasma ELDP of 6.4±0.7 fmol/mL compared with 12.4±2.5 fmol/mL for stage 5 CKD subjects (Figure 2A). Although plasma ELDP did not differ between control subjects and CKD patients in stages 1–3, patients in stages 4 and 5 had higher plasma ELDP compared with controls (P<0.001 for both). Plasma ELDP correlated inversely with eGFR (r=0.51, P<0.0001) (Figure 2B). This correlation was similar using both Cockcroft and Gault and Chronic Kidney Disease Epidemiology Collaboration (CKD‐EPI) equations. Mean urine ELDP was 1.07±0.11 fmol/mL with a ≈75‐fold difference between the minimum and maximum values of 0.09 and 6.65 fmol/L; however, there were no differences in urine ELDP among CKD stages and no correlation with eGFR (Figure 3).
Table 1.
Subject Characteristics
| Controls | Stage 1 | Stage 2 | Stage 3 | Stage 4 | Stage 5 | P Value | |
|---|---|---|---|---|---|---|---|
| n | 23 | 27 | 30 | 29 | 20 | 7 | — |
| Male/female, n | 13/10 | 16/11 | 18/12 | 21/8 | 16/4 | 4/3 | — |
| Smokers/nonsmokers, n | 2/21 | 9/18 | 5/25 | 5/24 | 4/16 | 0/7 | — |
| Serum creatinine,* mg/dL | 0.9±0.2 | 0.9±0.2 | 1.1±0.2 | 2.0±0.6 | 4.1±1.2 | 7.1±2.0 | <0.05 |
| CrCl, mL/min per 1.73 m2 | 97±19 | 108±17 | 77±9 | 46±9 | 23±4 | 11±3 | <0.05 |
| Age, y | 47±8 | 43±11 | 49±9 | 50±10 | 45±9 | 51±12 | NS |
| SBP, mm Hg | 113±16 | 113±15 | 116±13 | 119±13 | 121±12 | 132±16 | <0.05 |
| DBP, mm Hg | 71±10 | 71±10 | 74±9 | 77±10 | 76±7 | 76±7 | NS |
| MAP, mm Hg | 85±12 | 85±11 | 88±10 | 91±10 | 91±8 | 95±8 | <0.05 |
| PP, mm Hg | 42±9 | 42±8 | 41±7 | 42±10 | 45±9 | 56±17 | <0.05 |
| Body mass index, kg/m2 | 26±6 | 29±5 | 28±4 | 29±6 | 27±5 | 25±7 | NS |
| Plasma glucose,* mg/dL | 90±9 | 89±9 | 91±8 | 90±9 | 87±12 | 91±14 | NS |
| Total cholesterol,* mg/dL | 189±30 | 180±37 | 186±32 | 174±31 | 170±32 | 181±31 | NS |
Values are given as mean±SD. P values are for ANOVA by chronic kidney disease stage. CrCl indicates creatinine clearance; DBP, diastolic blood pressure; MAP, mean arterial pressure; NS, not significant; PP, pulse pressure; SBP, systolic blood pressure.
To convert to μmol/L, multiply by 88.4.
To convert to mmol/L, multiply by 0.0555.
To convert to mmol/L, multiply by 0.0259.
Figure 2.
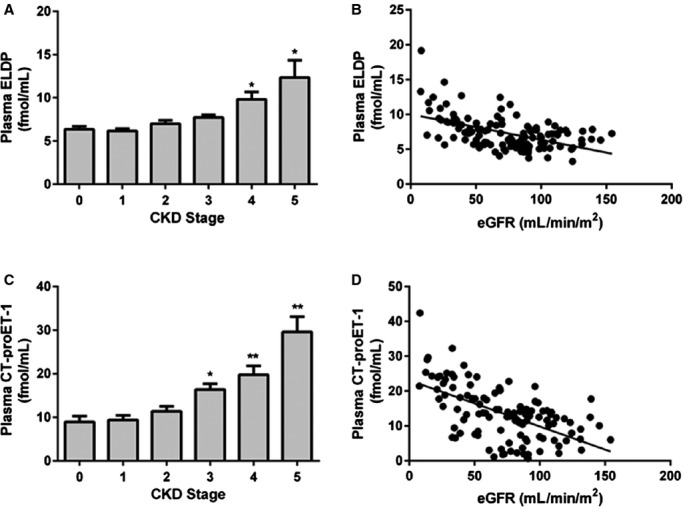
Plasma ELDP (A) and CT‐proET‐1 (C) by stage of CKD and relationship between plasma ELPD (B) and CT‐proET‐1 (D) and eGFR. *P<0.001, **P<0.0001 compared with non‐CKD control subjects (stage 0). For correlation between plasma ELDP and eGFR, r=0.51, P<0.0001. For correlation between plasma CT‐proET‐1 and eGFR, r=0.54, P<0.0001. CKD indicates chronic kidney disease; CT‐proET‐1, C‐terminal pro‐endothelin‐1; eGFR, estimated glomerular filtration rate; ELDP, endothelin‐like domain peptide.
Figure 3.
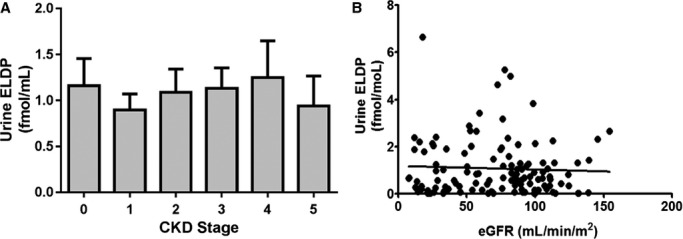
Urine ELDP by stage of CKD (A) and relationship between urine ELPD and eGFR (B). CKD indicates chronic kidney disease; eGFR, estimated glomerular filtration rate; ELDP, endothelin‐like domain peptide.
Plasma CT‐proET‐1 concentration also increased with CKD stage (P<0.0001 for trend), with patients in stages 3, 4, and 5 having higher plasma CT‐proET‐1 than controls (P<0.001, <0.0001, and <0.0001, respectively) (Figure 2C). Plasma CT‐proET‐1 correlated negatively with eGFR (r=0.57, P<0.0001) (Figure 2D). Again, this correlation was similar using both Cockcroft and Gault and CKD‐EPI equations. Consistent with their cosynthesis, plasma ELDP correlated with CT‐proET‐1 (r=0.63, P<0.0001) (Figure 4). Plasma ELDP and CT‐proET‐1 showed no correlations with components of BP or arterial stiffness in this cohort of CKD subjects. Previously published data from this study showed that plasma and urine ET‐1 increased as eGFR declined.13,15
Figure 4.
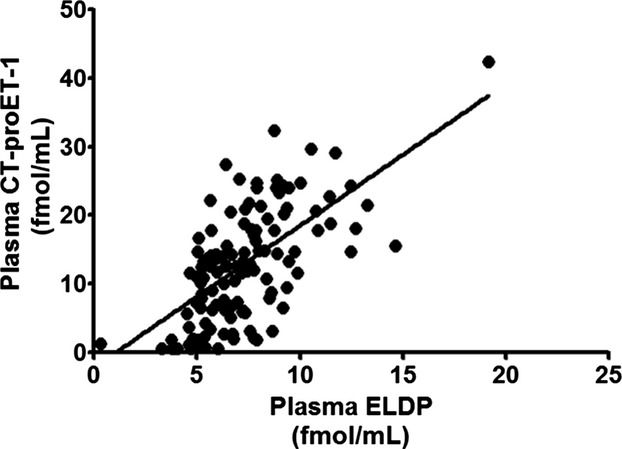
Correlation of plasma ELDP with CT‐proET‐1 (r=0.63, P<0.0001). CT‐proET‐1 indicates C‐terminal pro‐endothelin‐1; ELDP, endothelin‐like domain peptide.
We performed stepwise linear regression to identify factors that predicted eGFR. We added plasma ELDP and CT‐proET‐1 to the previously reported factors associated with worsening CKD in this patient population (plasma ET‐1, pulse wave velocity, flow‐mediated dilatation, asymmetric dimethylarginine, mean arterial pressure, pulse pressure, and systolic BP).13 In order of strongest correlation, plasma CT‐proET‐1, pulse wave velocity, plasma ET‐1, and mean arterial pressure were predictors of eGFR. If plasma CT‐proET‐1 was not included in the model, the predictors of eGFR in order of strongest correlation were plasma ELDP, plasma ET‐1, and pulse wave velocity (Table 2).
Table 2.
Multivariable Analysis of Predictors for Estimated Glomerular Filtration Rate
| Predictor | Model 1 (n=120) | Model 2 (n=120; CT‐proET‐1 Excluded) |
|---|---|---|
| Plasma ELDP | −0.16 | −0.33* |
| Plasma CT‐proET‐1 | −0.44* | — |
| Plasma ET‐1 | −0.19* | −0.31* |
| PWV | −0.16* | −0.24* |
| FMD | −0.05 | 0.01 |
| ADMA | −0.04 | −0.07 |
| SBP | 0.20 | −0.10 |
| PP | 0.09 | 0.01 |
| MAP | −0.16* | −0.13 |
| r 2 | 0.46 | 0.41 |
The table gives standardized regression coefficients (β‐values). ADMA indicates asymmetric dimethylarginine; CT‐proET‐1, C‐terminal pro‐endothelin‐1; ELDP, endothelin‐like domain peptide; FMD, flow‐mediated dilation of the brachial artery; MAP, mean arterial pressure; PP, pulse pressure; PWV, pulse wave velocity; r2, multiple coefficient of determination; SBP, systolic blood pressure.
P<0.01.
P<0.05.
Interventional Study
Effect of selective ETA receptor antagonism on plasma proET‐1 peptides
Baseline subject characteristics of those participating in the interventional study are shown in Table 3. Data from this study have been published previously and show that after 6 weeks of dosing, there were no significant differences between sitaxentan and nifedipine in the reductions from baseline in BP parameters.16 Despite this, sitaxentan reduced proteinuria to a significantly greater extent than nifedipine. Pulse wave velocity as a measure of arterial stiffness fell to a similar degree with nifedipine as with sitaxentan. Placebo did not affect proteinuria, BP, or pulse wave velocity (summary data are shown in Table 4).
Table 3.
Baseline Subject Characteristics.
| Parameter | n=27 |
|---|---|
| Demographic | |
| Age, y | 48±12 |
| Sex, male (%) | 23 (85) |
| White (%) | 27 (100) |
| Clinical | |
| Body mass index, kg/m2 | 29.3±4.6 |
| 24‐hour BP, mm Hg | |
| Systolic | 125±12 |
| Diastolic | 78±7 |
| Mean | 94±8 |
| Creatinine,* mg/dL | 1.73±0.85 |
| eGFR, mL/min per 1.73 m2 | 54±26 |
| Hemoglobin, g/L | 136±18 |
| Serum potassium, mmol/L | 4.6±0.4 |
| Cholesterol,* mg/dL | 178±32 |
| Urinary protein excretion | |
| Grams per 24 hours | 2.03±1.7 |
| PCR, mg/mmol | 156±143 |
| Arterial stiffness | |
| PWV, m/s | 8.3±2.4 |
| cAIx, % | 28±12 |
| Medications, n (%) | |
| ACE inhibitor | 18 (67) |
| ARB | 11 (41) |
| ACE inhibitor plus ARB | 5 (19) |
| No ACE inhibitor or ARB | 3 (11) |
| α‐Blocker | 6 (22) |
| β‐Blocker | 8 (30) |
| Calcium channel blocker | 3 (11) |
| Diuretic | 2 (7) |
| Statin | 18 (67) |
Values are given as mean of 3 baseline pretreatment periods±SD. ACE indicates angiotensin‐converting enzyme; ARB, angiotensin receptor blocker; BP, blood pressure; cAIx, central augmentation index; eGFR, estimated glomerular filtration rate; PCR, protein:creatinine ratio; PWV, pulse wave velocity.
To convert to μmol/L, multiply by 88.4.
To convert to mmol/L, multiply by 0.0259.
Table 4.
Main Study Data At Baseline and Week 6 of Each Study Period
| Placebo | Sitaxentan | Nifedipine | ||||
|---|---|---|---|---|---|---|
| Baseline | Week 6 | Baseline | Week 6 | Baseline | Week 6 | |
| 24‐hour proteinuria, g/day | 2.06±0.38 | 2.00±0.33 | 2.07±0.34 | 1.46±0.26* | 1.95±0.30 | 1.99±0.33 |
| PCR, mg/mmol | 155±31 | 153±27 | 157±28 | 114±23* | 155±27 | 152±29 |
| MAP, mm Hg | 94.6±2.2 | 94.3±1.7 | 94.4±1.8 | 90.7±1.8* | 95.5±2.0 | 91.7±1.7* |
| SBP, mm Hg | 125.4±2.7 | 124.2±1.9 | 124.3±2.2 | 120.7±1.9* | 125.7±2.4 | 120.7±1.6* |
| DBP, mm Hg | 77.9±1.5 | 77.5±1.2 | 77.9±1.3 | 74.3±1.3* | 78. 9±1.5 | 75.7±1.2* |
| PWV, m/s | 7.7±0.3 | 8.0±0.4 | 8.0±0.3 | 7.6±0.3* | 7.9±0.3 | 7.6±0.3* |
| cAIx, % | 20±2 | 20±2 | 20±2 | 15±2* | 19±2 | 17±2 |
| Plasma ELDP, fmol/mL | 12.0±0.6 | 11.2±0.5 | 11.8±0.5 | 13.4±0.6* | 11.3±0.6 | 11.6±0.5 |
| Urine ELDP, fmol/mL | 0.81±0.1 | 0.94±0.2 | 0.78±0.1 | 0.83±0.2 | 0.89±0.1 | 0.79±0.1 |
| Plasma CT‐proET‐1, fmol/mL | 20.2±0.9 | 20.2±1.1 | 20.5±1.2 | 23.3±1.5* | 19.3±1.2 | 20.3±1.4 |
| Plasma ET‐1, pg/mL | 3.6±0.5 | 3.7±0.6 | 3.6±0.5 | 3.7±0.5 | 3.5±0.5 | 3.5±0.5 |
| Urine ET‐1/creatinine, pg/mmol | 761±95 | 758±93 | 783±84 | 613±81* | 824±97 | 734±89 |
Values are given as predosing baseline±SEM. cAIx indicates central augmentation index; CT‐proET‐1 indicates C‐terminal pro‐endothelin‐1; DBP, diastolic blood pressure; ELDP, endothelin‐like domain peptide; ET‐1, endothelin 1; MAP, mean arterial pressure; PCR, protein:creatinine ratio; PWV, pulse wave velocity; SBP, systolic blood pressure.
P<0.01.
P=0.01.
P<0.0001.
P<0.05 for week 6 vs baseline.
Baseline ELDP and CT‐proET‐1 concentrations were the same for all 3 phases of the study (Table 4). Whereas placebo and nifedipine treatments did not affect ELDP or CT‐proET‐1, sitaxentan increased both peptides by ≈15% at both weeks 3 and 6 of the study phase (Figures 5A and 5B). Urine ELDP did not change in any of the 3 phases of the study.
Figure 5.
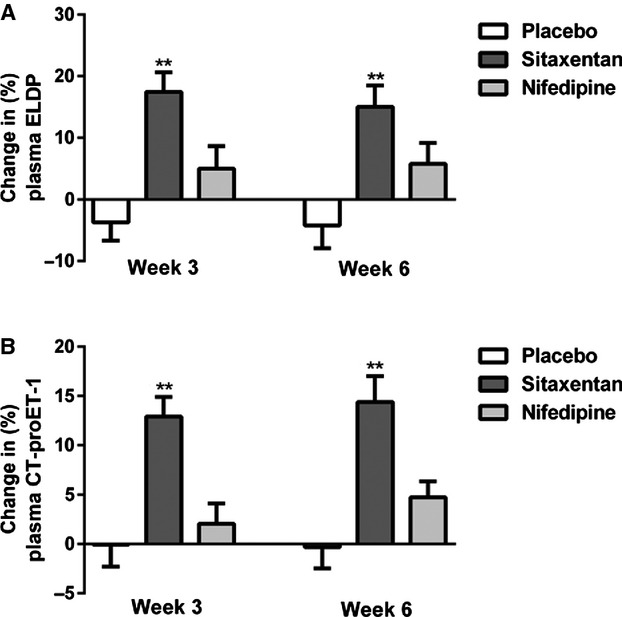
Percentage change from baseline in plasma ELDP (A) and plasma CT‐proET‐1 (B) following 3 and 6 weeks of treatment with placebo (open bar), sitaxentan (dark grey bar), and nifedipine (light grey bar) (mean±SEM, *P<0.0001 for sitaxentan at 3 or 6 weeks vs baseline). CT‐proET‐1 indicates C‐terminal pro‐endothelin‐1; ELDP, endothelin‐like domain peptide.
Plasma proET‐1 peptides and urinary sodium excretion
Following 6 weeks treatment with sitaxentan, both plasma ELDP and CT‐proET‐1 concentrations correlated inversely with 24‐hour urine sodium excretion (r=0.46, P=0.01 and r=0.47, P=0.01, respectively) (Figures 6A and 6B), whereas placebo and nifedipine showed no such associations (Figure 7). Changes in ELDP and CT‐proET‐1 did not correlate with changes in components of BP, proteinuria, or arterial stiffness in any of the 3 phases of the study.
Figure 6.
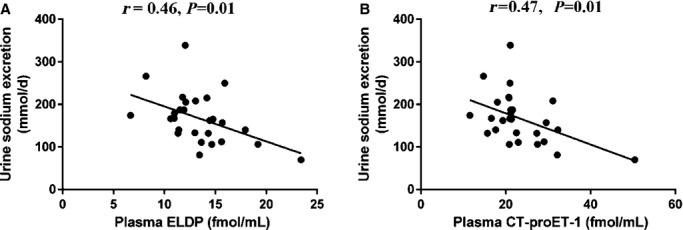
Relationships between plasma ELDP (A) and plasma CT‐proET‐1 (B) and urine sodium excretion following 6 weeks of treatment with sitaxentan. CT‐proET‐1 indicates C‐terminal pro‐endothelin‐1; ELDP, endothelin‐like domain peptide.
Figure 7.
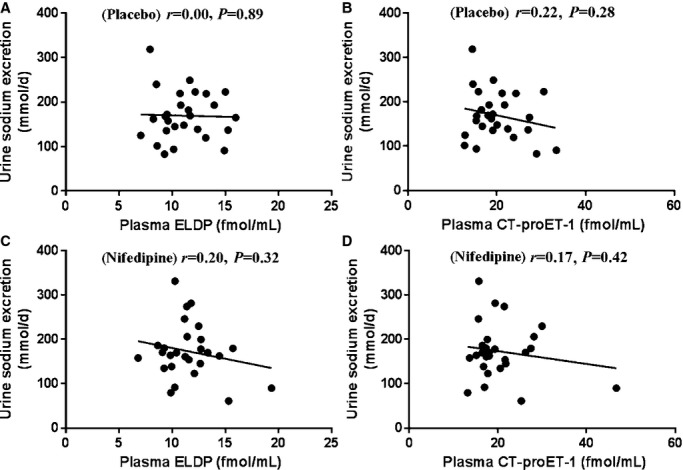
Relationships between plasma ELDP and plasma CT‐proET‐1 and urine sodium excretion following 6 weeks treatment with placebo (A and B) and nifedipine (C and D). CT‐proET‐1 indicates C‐terminal pro‐endothelin‐1; ELDP, endothelin‐like domain peptide.
Plasma and urine ET‐1
Plasma ET‐1 concentrations were similar at baseline in all 3 phases of the study and were not affected by any of the interventions (Table 4). Baseline urine ET‐1 levels were also similar in all 3 phases of the study. Although placebo and nifedipine had no impact on urine ET‐1, sitaxentan reduced this by ≈20% (Table 4).
Discussion
The increases in plasma ELDP and CT‐proET‐1 as GFR declined support the concept that the endothelin system contributes to CKD progression. In agreement with previous studies of plasma ET‐1 in CKD, both plasma ELDP and CT‐proET‐1 were inversely correlated with GFR.13,15 These increases are likely due in part to reduced renal clearance from the circulation and/or to increases in synthesis. Serum creatinine, currently the most widely used measure of renal function, has a nonlinear relationship with GFR and begins to rise only when GFR falls below ≈60 mL/min. In contrast, our data show that ELDP and CT‐proET‐1 have a linear relationship with GFR and begin to rise much earlier in the CKD trajectory. Although this may make these peptides potentially useful biomarkers of CKD, any utility beyond that provided by serum creatinine needs to be investigated further in much larger clinical studies with more diverse CKD populations. Furthermore, studies that relate to the time course of CKD progression and risk of clinical outcomes would be of particular interest.
The CKD patients studied had minimal comorbidity, so repeating these studies in other cohorts of patients will be important. Our assessment of urine ELDP showed no clear relationship with degree of CKD, but this merits further investigation. ELDP is a recently identified peptide derived from proET‐1 that potentiates ET‐1–induced vasoconstriction12; therefore, data on its potential role as a biomarker or its physiological actions are limited. By comparison, previous studies suggest that CT‐proET‐1 may be a useful prognostic biomarker in various groups of patients, including those with pulmonary arterial hypertension,23 type 2 diabetes,24 and the metabolic syndrome.25 Our data are the first report of raised levels in CKD patients. Currently, there are no data relating to the actions of these proET‐1 peptides in CKD, which should be an area of future research.
In addition to the important evidence of potentially renoprotective effects on proteinuria, BP, and arterial stiffness, the current data show that selective ETA receptor antagonism increases the proET‐1 peptides ELDP and CT‐proET‐1. There may be a number of explanations for this finding. Although 6 weeks of sitaxentan treatment was not associated with any change in serum creatinine, actual GFR (measured by inulin clearance) fell from 57±8 to 48±8 mL/min. Consequently, the rise in ELDP and CT‐proET‐1 may relate to a fall in their clearance and/or an increase in production as a result of the reduction in GFR; however, in this phase of the study, the change in the proET‐1 peptides from baseline to week 6 did not correlate with the change in GFR. This may be due to small sample size, but the lack of rise in serum creatinine despite the ≈15% fall in real GFR highlights the poor sensitivity of this test as a measure of GFR.
A more likely explanation for the increases in ELDP and CT‐proET‐1 following sitaxentan is that ETA receptor antagonism interferes with the physiological negative feedback effects of ET‐1 on EDN1 gene expression.26 In support of this explanation, early preclinical data suggested that mixed ETA/B receptor antagonism increased plasma ET‐1 to a greater extent than selective ETB blockade.27 Furthermore, plasma ET‐1 increased in a study administering high doses of the ETA‐selective antagonist atrasentan to healthy volunteers.28 In the current study, plasma ET‐1 did not increase after sitaxentan, but this is recognized as a poor marker of vascular ET‐1 production.5,10–11 An additional explanation for the lack of rise in plasma ET‐1 may be an increase in ETB receptor–mediated clearance in the presence of a blocked ETA receptor. Importantly, this study provides the first clinical evidence that increases in plasma ET‐1 seen in previous studies27–28 may be due to upregulation of its synthesis. It would be interesting to see if other studies of selective ETA receptor blockade29–30 also showed a similar rise in ELDP and CT‐proET‐1. If such were the case, then this rise may be a useful biomarker of selective ETA receptor blockade, similar to the rise in plasma ET‐1 reflecting effective ETB receptor antagonism.31
Blocking ETA receptor–mediated negative feedback of EDN1 expression may have important consequences. Edema is a recognized side effect of both selective ETA and mixed ETA/B receptor antagonists and has led to increased morbidity in clinical trials.32–33 No good biomarkers currently exist for this effect. If the increases in ELDP and CT‐proET‐1 are due to upregulation of ET‐1 synthesis, that could be implicated in the renal regulation of sodium and water.6 In this study, the correlations between plasma proET‐1 peptides and urinary sodium excretion (following dosing with sitaxentan) support this explanation. The fall in sodium excretion with sitaxentan will result in part from the observed fall in GFR (−9 mL/min). Nevertheless, following 6 weeks treatment with an ETA receptor antagonist, higher plasma ELDP and CT‐proET‐1 concentrations were associated with lower 24‐hour urine sodium excretion. This association suggests that as proET‐1 peptide concentration rises, there is renal conservation of both salt and water. Although a rise in plasma ET‐1 may be considered to promote natriuresis and diuresis, our data also show that urine ET‐1 fell following treatment with sitaxentan. Urine ET‐1 is a measure of renal ET‐1 production, so our findings suggest that with concomitant ETA receptor blockade, less intrarenal ET‐1 may be available to act on the unblocked tubular ETB receptor to promote salt and water excretion. There was no correlation between the changes in proET‐1 peptides and urine ET‐1, although, again, this may be related to the small sample size of this study. Furthermore, free water clearance was not measured, but one may postulate that this might show a similar trend to ELDP and CT‐proET‐1. Our current data suggest that ELDP and CT‐proET‐1 merit further investigation in patients experiencing edema with an endothelin receptor antagonist because these biomarkers may have utility in tailoring the optimal dose to reduce this side effect. They may also encourage drug companies to continue development of endothelin‐converting enzyme inhibitors that would effectively act as mixed ETA/B receptor blockers without affecting ETB receptor–mediated ET‐1 clearance or perturbing the negative feedback regulation of EDN1 gene expression mediated by ETA receptors.
Conclusions
Plasma concentrations of the proET‐1 peptides ELDP and CT‐proET‐1 increase as GFR declines in patients with CKD. Measurement of ELDP and CT‐proET‐1 may have advantages over the limitations associated with plasma ET‐1. These peptides may have utility in the early diagnosis of CKD and in assessing response to treatment. Furthermore, these peptides may serve as potentially useful biomarkers of selective ETA receptor antagonism and provide insights into fluid retention that is a recognized side effect in clinical trials of ET receptor antagonists. These preliminary data need further exploration in larger and longer clinical studies of endothelin receptor antagonists in CKD.
Addendum
Sitaxentan has been voluntarily withdrawn by Pfizer, Ltd due to unacceptable structure‐related liver side effects. However, the findings in this study are likely to be representative of the effects of the class of selective endothelin A receptor antagonists.
Authors Contributions
Dr Dhaun, Dr Goddard, Dr Corder, and Dr Webb were involved the design of the study. Dr Corder, Dr Yuzugulen, and Wood developed the ELDP and CT‐proET‐1 assays. Dr Dhaun, Dr Chariyavilaskul, Dr Yuzugulen, Dr MacIntyre, Wood, and Kimmitt undertook the study. Dr Dhaun, Dr Yuzugulen, Dr Goddard, Dr Webb, and Kimmitt analyzed the samples and the data. All authors were involved in the writing and critique of the manuscript.
Sources of Funding
The new analyses described in this article were funded by the Medical Research Council (Grant G0801509). Additional funding was from the British Heart Foundation (Project Grant PG/05/91), Encysive Pharmaceuticals, and Pfizer. Dr Dhaun is supported by a British Heart Foundation Intermediate Clinical Research Fellowship (FS/13/30/29994).
Disclosures
Dr Dhaun, Dr Goddard, and Dr Webb have all received research grants from Pfizer. Dr Dhaun and Dr Goddard have held academic research fellowships funded by educational grants from Pfizer. Dr Goddard and Dr Webb have acted as Consultants to Pfizer.
References
- El Nahas Meguid A, Bello AK. Chronic kidney disease: the global challenge. Lancet. 2005; 365:331-340. [DOI] [PubMed] [Google Scholar]
- Levey AS, Beto JA, Coronado BE, Eknoyan G, Foley RN, Kasiske BL, Klag MJ, Mailloux LU, Manske CL, Meyer KB, Parfrey PS, Pfeffer MA, Wenger NK, Wilson PW, Wright JT., Jr Controlling the epidemic of cardiovascular disease in chronic renal disease: What do we know? What do we need to learn? Where do we go from here? National Kidney Foundation task force on cardiovascular disease. Am J Kidney Dis. 1998; 32:853-906. [DOI] [PubMed] [Google Scholar]
- Sarnak MJ, Levey AS, Schoolwerth AC, Coresh J, Culleton B, Hamm LL, McCullough PA, Kasiske BL, Kelepouris E, Klag MJ, Parfrey P, Pfeffer M, Raij L, Spinosa DJ, Wilson PW. Kidney disease as a risk factor for development of cardiovascular disease: a statement from the American Heart Association councils on kidney in cardiovascular disease, high blood pressure research, clinical cardiology, and epidemiology and prevention. Circulation. 2003; 108:2154-2169. [DOI] [PubMed] [Google Scholar]
- Hewitt SM, Dear J, Star RA. Discovery of protein biomarkers for renal diseases. J Am Soc Nephrol. 2004; 15:1677-1689. [DOI] [PubMed] [Google Scholar]
- Dhaun N, Goddard J, Webb DJ. The endothelin system and its antagonism in chronic kidney disease. J Am Soc Nephrol. 2006; 17:943-955. [DOI] [PubMed] [Google Scholar]
- Kohan DE, Rossi NF, Inscho EW, Pollock DM. Regulation of blood pressure and salt homeostasis by endothelin. Physiol Rev. 2011; 91:1-77. [DOI] [PMC free article] [PubMed] [Google Scholar]
- Kohan DE, Pollock DM. Endothelin antagonists for diabetic and non‐diabetic chronic kidney disease. Br J Clin Pharmacol. 2013; 76:573-579. [DOI] [PMC free article] [PubMed] [Google Scholar]
- Benigni A, Perico N, Gaspari F, Zoja C, Bellizzi M, Gabanelli M, Remuzzi G. Increased renal endothelin production in rats with reduced renal mass. Am J Physiol. 1991; 260:F331-F339. [DOI] [PubMed] [Google Scholar]
- Wesson DE. Endogenous endothelins mediate increased acidification in remnant kidneys. J Am Soc Nephrol. 2001; 12:1826-1835. [DOI] [PubMed] [Google Scholar]
- Yoshimoto S, Ishizaki Y, Sasaki T, Murota S. Effect of carbon dioxide and oxygen on endothelin production by cultured porcine cerebral endothelial cells. Stroke. 1991; 22:378-383. [DOI] [PubMed] [Google Scholar]
- Goddard J, Webb DJ. Plasma endothelin concentrations in hypertension. J Cardiovasc Pharmacol. 2000; 35suppl 1:25-31. [DOI] [PubMed] [Google Scholar]
- Yuzugulen J, Wood E, Douthwaite J, Villar I, Patel N, Jegard J, Montoya A, Cutillas P, Hartley O, Ahluwalia A, Corder R. Characterization of proendothelin‐1 derived peptides identifies a co‐secreted modulator of ET‐1 vasoconstriction, and provides insights for biomarker measurements. Circulation. 2012; 126:A18898 [Google Scholar]
- Lilitkarntakul P, Dhaun N, Melville V, Blackwell S, Talwar DK, Liebman B, Asai T, Pollock J, Goddard J, Webb DJ. Blood pressure and not uraemia is the major determinant of arterial stiffness and endothelial dysfunction in patients with chronic kidney disease and minimal co‐morbidity. Atherosclerosis. 2011; 216:217-225. [DOI] [PubMed] [Google Scholar]
- Lilitkarntakul P, Dhaun N, Melville V, Kerr D, Webb DJ, Goddard J. Risk factors for metabolic syndrome independently predict arterial stiffness and endothelial dysfunction in patients with chronic kidney disease and minimal comorbidity. Diabetes Care. 2012; 35:1774-1780. [DOI] [PMC free article] [PubMed] [Google Scholar]
- Dhaun N, Lilitkarntakul P, Macintyre IM, Muilwijk E, Johnston NR, Kluth DC, Webb DJ, Goddard J. Urinary endothelin‐1 in chronic kidney disease and as a marker of disease activity in lupus nephritis. Am J Physiol. 2009; 296:F1477-F1483. [DOI] [PMC free article] [PubMed] [Google Scholar]
- Dhaun N, MacIntyre IM, Kerr D, Melville V, Johnston NR, Haughie S, Goddard J, Webb DJ. Selective endothelin‐A receptor antagonism reduces proteinuria, blood pressure, and arterial stiffness in chronic proteinuric kidney disease. Hypertension. 2011; 57:772-779. [DOI] [PubMed] [Google Scholar]
- Anonymous. K/doqi clinical practice guidelines for chronic kidney disease: evaluation, classification, and stratification. Am J Kidney Dis. 2002; 39:S1-S266. [PubMed] [Google Scholar]
- Cockcroft DW, Gault MH. Prediction of creatinine clearance from serum creatinine. Nephron. 1976; 16:31-41. [DOI] [PubMed] [Google Scholar]
- Mafham MM, Niculescu‐Duvaz I, Barron J, Emberson JR, Dockrell ME, Landray MJ, Baigent C. A practical method of measuring glomerular filtration rate by iohexol clearance using dried capillary blood spots. Nephron Clin Prac. 2007; 106:c104-c112. [DOI] [PubMed] [Google Scholar]
- Corder R. Evaluation of endothelin‐converting enzyme inhibitors using cultured cells. Methods Mol Biol. 2002; 206:147-164. [DOI] [PubMed] [Google Scholar]
- Rolinski B, Bonger SJ, Goebel FD. Determination of endothelin‐1 immunoreactivity in plasma, cerebrospinal fluid and urine. Res Exp Med. 1994; 194:9-24. [DOI] [PubMed] [Google Scholar]
- Cody RJ, Haas GJ, Binkley PF, Capers Q, Kelley R. Plasma endothelin correlates with the extent of pulmonary hypertension in patients with chronic congestive heart failure. Circulation. 1992; 85:504-509. [DOI] [PubMed] [Google Scholar]
- Silva Marques J, Martins SR, Calisto C, Goncalves S, Almeida AG, Sousa JC, Pinto FJ, Diogo AN. An exploratory panel of biomarkers for risk prediction in pulmonary hypertension: emerging role of CT‐proET‐1. J Heart Lung Transplant. 2013; 32:1214-1221. [DOI] [PubMed] [Google Scholar]
- Drion I, Kleefstra N, Landman GW, Alkhalaf A, Struck J, Groenier KH, Bakker SJ, Bilo HJ. Plasma COOH‐terminal proendothelin‐1: a marker of fatal cardiovascular events, all‐cause mortality, and new‐onset albuminuria in type 2 diabetes? (Zodiac‐29). Diabetes Care. 2012; 35:2354-2358. [DOI] [PMC free article] [PubMed] [Google Scholar]
- Seissler J, Feghelm N, Then C, Meisinger C, Herder C, Koenig W, Peters A, Roden M, Lechner A, Kowall B, Rathmann W. Vasoregulatory peptides pro‐endothelin‐1 and pro‐adrenomedullin are associated with metabolic syndrome in the population‐based kora F4 study. Eur J Endocrinol. 2012; 167:847-853. [DOI] [PubMed] [Google Scholar]
- Stow LR, Jacobs ME, Wingo CS, Cain BD. Endothelin‐1 gene regulation. FASEB J. 2011; 25:16-28. [DOI] [PMC free article] [PubMed] [Google Scholar]
- Opgenorth TJ, Wessale JL, Dixon DB, Adler AL, Calzadilla SV, Padley RJ, Wu‐Wong JR. Effects of endothelin receptor antagonists on the plasma immunoreactive endothelin‐1 level. J Cardiovasc Pharmacol. 2000; 36:292-296. [DOI] [PubMed] [Google Scholar]
- Verhaar MC, Grahn AY, van Weerdt AWN, Honing MLH, Morrison PJ, Yang YP, Padley RJ, Rabelink TJ. Pharmacokinetics and pharmacodynamic effects of ABT‐627, an oral eta selective endothelin antagonist, in humans. Br J Clin Pharmacol. 2000; 49:562-573. [DOI] [PMC free article] [PubMed] [Google Scholar]
- Weber MA, Black H, Bakris G, Krum H, Linas S, Weiss R, Linseman JV, Wiens BL, Warren MS, Lindholm LH. A selective endothelin‐receptor antagonist to reduce blood pressure in patients with treatment‐resistant hypertension: a randomised, double‐blind, placebo‐controlled trial. Lancet. 2009; 374:1423-1431. [DOI] [PubMed] [Google Scholar]
- Kohan DE, Pritchett Y, Molitch M, Wen S, Garimella T, Audhya P, Andress DL. Addition of atrasentan to renin‐angiotensin system blockade reduces albuminuria in diabetic nephropathy. J Am Soc Nephrol. 2009; 22:763-772. [DOI] [PMC free article] [PubMed] [Google Scholar]
- MacIntyre IM, Dhaun N, Lilitkarntakul P, Melville V, Goddard J, Webb DJ. Greater functional ETB receptor antagonism with bosentan than sitaxsentan in healthy men. Hypertension. 2010; 55:1406-1411. [DOI] [PubMed] [Google Scholar]
- Dhaun N, Pollock DM, Goddard J, Webb DJ. Selective and mixed endothelin receptor antagonism in cardiovascular disease. Trends Pharmacol Sci. 2007; 28:573-579. [DOI] [PubMed] [Google Scholar]
- Ritz E, Wenzel R. Endothelin receptor antagonists in proteinuric renal disease: every rose has its thorn. J Am Soc Nephrol. 2010; 21:392-394. [DOI] [PMC free article] [PubMed] [Google Scholar]


