Abstract
Objective:
Characterization of magnetic (MRI) features in women undergoing uterine fibroid embolization (UFE) and identification of clinical correlates in an African population.
Materials and Methods:
Patients with symptomatic fibroids who are selected to undergo UFE at the hospital formed the study population. The baseline MRI features, baseline symptom score, short-term imaging outcome, and mid-term symptom scores were analyzed for interval changes. Assessment of potential associations between short-term imaging features and mid-term symptom scores was also done.
Results:
UFE resulted in statistically significant reduction (P < 0.001) of dominant fibroid, uterine volumes, and reduction of symptom severity scores, which were 43.7%, 40.1%, and 37.8%, respectively. Also, 59% of respondents had more than 10 fibroids. The predominant location of the dominant fibroid was intramural. No statistically significant association was found between clinical and radiological outcome.
Conclusion:
The response of uterine fibroids to embolization in the African population is not different from the findings reported in other studies from the west. The presence of multiple and large fibroids in this study is consistent with the case mix described in other studies of African-American populations. Patient counseling should emphasize the independence of volume reduction and symptom improvement. Though volume changes are of relevance for the radiologist in understanding the evolution of the condition and identifying potential technical treatment failures, it should not be the main basis of evaluation of treatment success.
Keywords: African women, embolization, fibroid, response
INTRODUCTION

Uterine fibroids, the most common benign tumor of the female pelvis, affect 20–50% of women.[1] Hysterectomy has been the traditional primary treatment for debilitating fibroids. It is estimated that approximately one in three women in the United States has undergone hysterectomy by the age of 60 years.[2] Uterine fibroids account for approximately 67% of all hysterectomies performed in middle-aged women.[3] The associated health care costs and morbidity are not trivial.
Since it was first described in 1995 for the treatment of fibroids of the uterus, uterine fibroid embolization (UFE) has been shown in numerous studies to be a highly successful technique that alleviates fibroid-related symptoms such as heavy menstrual bleeding and bulk-related symptoms.
Uterine fibroid embolization is performed by selectively catheterizing the uterine arteries and embolizing the perifibroid plexi with embolic articles. This results in ischemic infarction of the fibroids. It is a valuable treatment alternative to hysterectomy or myomectomy for many women suffering with fibroids.
Uterine fibroids are not only associated with physical symptoms, but also affect the quality of life (QOL) in the affected women. It was, however, not possible until recently to record specific details about the patient's QOL in a uniform and comparable manner due to lack of standardized assessment tools. The uterine fibroid symptom and QOL questionnaire (UFS-QOL) presented by Spies and colleagues in February 2002 is a practical and validated tool for the objective assessment of disease-specific symptoms, their severity, and the impact of fibroids on different aspects of the patient's QOL.[4] The UFS-QOL allows the comparison of a patient's condition before and after treatment by UFE or alternative treatment options.
Though UFE has been used for a long time to treat symptomatic uterine fibroids in the developed world, it is a relatively new treatment option for fibroids in the developing world. No local data, therefore, exist on both the clinical and imaging outcome of this treatment option. This study was undertaken to characterize the MRI imaging features in women undergoing UFE and identify any clinical correlates.
Clinical convention holds that symptoms and need for treatment are, in large part, related to a combination of the type of fibroid, position within the uterus, and fibroid size. Fibroids are thus often grouped as one of the following four types:
Submucosal (beneath the mucosa, or uterine lining) are immediately adjacent to or jut into the uterine cavity
Intramural are entirely within the wall of the uterus
Subserosal (beneath the serosa) distort the contour of the outer surface of the uterus; and
Pendunculated are attached to the uterus by a stalk
Transmural fibroids are large fibroids which distort the endometrium, occupy a component of the uterine wall, distorting the external contour.[5]
The exact etiology of uterine fibroids is not clearly understood, but the current working hypothesis is that genetic predisposition, prenatal hormone exposure, and the effects of hormones, growth factors, and xenoestrogens cause fibroid growth. Known risk factors are African descent, nulliparity, obesity, polycystic ovary syndrome, diabetes, and hypertension.
Several studies have documented an increased incidence of uterine fibroids in African women.[6,7] Some evidence also indicates that African women are more likely than Caucasian women to have larger and more symptomatic fibroids at the time of treatment.[8,9,10,11,12,13] After accounting for body mass index (BMI) and other known risk factors, African women experience a higher incidence and relative risk of uterine fibroids than other racial and ethnic groups including Caucasian, Hispanic, and Asian women.
A few studies have been conducted on this subject in Africa. The exact prevalence or incidence of uterine fibroids in the continent is not known. A United States Census Bureau and Population estimates report extrapolated the prevalence of uterine fibroids at 1,649,105 cases (approximately 10-20% of the women population) in Kenya.[14] In a retrospective review of 129 surgically managed cases of uterine leiomyoma carried out at two large tertiary hospitals in the southwest region of Nigeria over a period of 25 years, the commonest anatomical positions of the fibroids were multiple positions and intramural in 707 (60.9%) and 172 (14.8%) cases, respectively. The higher prevalence rate of fibroids in African women may be attributable to the gene encoding fibroid development or a positive family history of fibroids, myometrial irritation following a pelvic infection resulting in abnormal uterine growth, or higher levels of estrogen.[13,14]
Imaging plays a critical role in diagnosis and management of uterine fibroids. Ultrasonography is usually the initial investigation for examining the female pelvis. Ideally, both transabdominal (TA) and transvaginal (TV) scans should be performed. TV scans are more sensitive for the diagnosis of small fibroids; however, when the uterus is bulky or retroverted, the uterine fundus may lie outside of the field of view. TA views are often of limited value if the patient is obese. Ultrasonography is highly operator dependent, but in skilled hands, fibroids as small as 5 mm can be demonstrated on transvaginal ultrasound.
CT scan is not the investigation of choice for the characterization of pelvic masses. Uterine fibroids are often seen incidentally on CT scans performed for other reasons.
MRI is the preferred method for accurately characterizing pelvic masses. It has been shown to be more sensitive in identifying uterine fibroids than ultrasound.[15,16,17] It does not involve the use of ionizing radiation and it can readily demonstrate the uterine zonal anatomy. Submucosal, intramural, and subserosal fibroids are usually easily differentiated with MRI and fibroids as small as 5 mm in diameter can be demonstrated. Fibroids in relatively unusual locations, such as within the cervix, can also be identified. MRI is also used to both predict and assess the response of fibroids to UFE. On T2-weighted (T2W) images, the normal endometrium shows high signal intensity. Surrounding the endometrium is a low-signal band known as the junctional zone, which represents the inner myometrium. The remainder of the myometrium is of intermediate signal on T2W images.[18] MRI sequences should include axial and sagittal T2W images as well as T1-weighted (T1W) images in at least one plane. The routine use of gadolinium has been shown not to contribute to either fibroid detection or characterization.[19] However, gadolinium can be used to determine vascularity when assessing the suitability of a fibroid for UFE.
Typically, non-degenerate fibroids are well-defined masses of low signal intensity as compared to the myometrium on T2W images and isointense to the myometrium on T1W images.
In a study conducted in the United States, total costs, including hospital care, procedure room, and professional fees were estimated for 23 UFE procedures and 17 myomectomy procedures. Myomectomy costs averaged $7486 per procedure versus $6861 for UFE, suggesting a trend toward lower costs for UFE.[20] A total of 120 UFEs have so far been done at the Aga Khan University Hospital, Nairobi by a visiting specialist with over 15 years of experience in UFE. The total cost of each procedure is approximately 300,000 Kenya shillings (US$ 3530). This is considered an extremely expensive procedure by most Kenyans. The development of the Nairobi UFE service has been described by Dr. Nigel Hacking and colleaques.[21]
The race of the catchment population of the study site is mainly African, and therefore, uterine fibroids were presumed to be a major health problem. Hysterectomy and myomectomy still form the bulk of the treatment options for this disease. UFE is a new treatment option in the management of fibroids in the local setting. No data, therefore, exists on the radiological and clinical response. This study was expected to be useful in assessing the response of fibroids to UFE in the local population. The data acquired was aimed to help doctors to give adequate evidence-based advice to their patients regarding UFE for symptomatic fibroids. This would allow the patients to make an informed choice.
Previous studies have correlated imaging and clinical response at the same time period post UFE. However, literature review reveals that the peak imaging outcome is at 3–6 months while the peak clinical outcome is at 6–24 months. This study, therefore, correlated the peak imaging outcome at 3 months post treatment and the peak clinical outcome 12 months after treatment.
Specific objectives of this study
Determine the enhancement pattern of the dominant fibroid pre- and post-embolization
Calculate the baseline volume and the volume change of the dominant fibroid and uterus pre- and 3–6 months post-embolization
Enumerate the number of fibroids per patient
Determine the location of the dominant fibroid
Identify potential associations between the uterine volume (UV), the volume of the dominant fibroid, and the symptoms score.
MATERIALS AND METHODS
Methodology
Study site
The study was carried out in the departments of radiology, and obstetrics and gynecology at Aga Khan University Hospital, Nairobi, an urban tertiary institution. This is a 264-bed hospital based in Kenya but receiving patients from all over east and central Africa. It has many specialized clinics. The Department of Radiology has a 1.5 T General Electric (GE) MRI scanner which is operational for 24 h a day and 7 days a week.
Data collection
This was both a prospective and retrospective cohort study. The data of the baseline MRI scans, baseline symptom scores, and the 3-month follow-up MRI scans were captured and stored in a registry at the radiology and the obstetrics and gynecology departments. This represented the retrospective aspect of the study. Symptom scores were then acquired 1 year after UFE during follow-up at the gynecology clinic and this formed the prospective aspect of the study.
Sample population
The sample population consisted of women with symptomatic fibroids who chose to undergo UFE and met the inclusion criteria which allowed them to have the procedure done.
Study population
From the sample population, the study population was selected as those with baseline MRI scans, baseline symptom score, 3-month follow-up MRI scans, and 12-month symptoms score.
Inclusion criteria
All women undergoing UFE at Aga Khan University Hospital, Nairobi who underwent contrast-enhanced pelvic MRI scans (UFE protocol) and filled the baseline and follow-up symptom scores
Patients who signed an informed consent
Exclusion criteria
Incomplete MRI studies and symptom score sheets
Images of poor diagnostic quality
Statistical methods
Sample size calculation
A similar study by Reena et al., reported a mean decrease in UV from 588.6 to 393.1 cm3, 3 months after UFE, which resulted in a 33.5% change with a standard deviation of 16.1%.[22] The following formula was, therefore, used to determine the required sample size:

where n is the required sample size
σ is the standard deviation of the mean
D is the expected size of the confidence interval considered here as ± 4, and
Zα and Zβ are the standard normal deviate values corresponding to 95% and 90% power, respectively.
Substituting this information in the sample size formula, the required sample size is a minimum of 65 patients with complete radiological and clinical data.
Data management and analysis
Study data were retrieved from files and records and then entered into a spreadsheet (Excel; Microsoft Corporation Redmond, Washington USA). Analysis was done using the Statistical Program for Social Sciences (SPSS) version 17.
Dependent (response) variables
The primary outcome measures were the percentage volume reduction of the uterus, dominant fibroid and the symptom score changes.
Independent (predictor) variables
The independent variables for the primary analysis were the baseline symptom and QOL score, the baseline uterine and dominant fibroid volume (DFV).
The independent variables for the secondary analysis were uterine and dominant fibroid changes and the symptom and QOL scores.
Statistical analysis
The percentage volume reduction of the uterus and dominant fibroid was calculated and presented as a mean, standard deviation, and range value. The results of the symptom score before and after UFE were also calculated with the absolute percentage changes given as a mean.
Spearman's rank correlation coefficient was estimated to identify potential associations between changes in the symptom severity score, and the percentage UV and DFV reduction. Statistical significance was considered to be P < 0.05.
Clinical assessment
A self-administered symptom score filled out by all study patients before UFE and at mid-term follow-up visit, comprised eight questions pertaining to the type and severity of symptoms. The eight symptom items (questions 1–8) were summarized in a symptom severity scale. Response options were presented as five-level Likert scales ranging from “not at all” (1) to “a very great deal” (5) in response to “how distressed were you by...?” These self-administered questionnaires for mid-term symptom score were completed by patients during the follow-up visit at the gynecology clinic under the guidance of the attending gynecologist or resident. In the unlikely scenario that the patient failed to turn up for follow-up at 1 year, an email was sent out to her with an attached questionnaire. The email addresses of all the participants were available in the registry.
Radiological assessment
Imaging protocol
All the MRI scans were performed using a 1.5 T GM MRI scanner. The following protocol was applied:
Three plane localizer
Axial T1 abdomen and pelvis
Axial T1 fat-saturated pelvis
Axial T2 pelvis
Coronal T2 pelvis
Axial T1 fat-saturated with contrast pelvis
Sagittal T1 fat-saturated with contrast pelvis
The MRI images were independently reviewed by two consultant radiologists with 5 years of experience post residency in the picture archive and communication system (PACS) workstation. Any discrepancy was resolved by consensus. The baseline and follow-up volume of the uterus and of the dominant fibroid (largest fibroid before therapy), the number of fibroids per patient (classified as <5, 6–10, and >10), location of the dominant fibroid, and enhancement of the dominant fibroid were determined.
Based on the location of the center of the fibroid, dominant fibroids were defined as being subserosal, intramural, transmural, or submucosal using a modification of the classification of Goodwin et al.[23]
Volumes were determined by measuring the maximum extent of the uterus and dominant leiomyoma in three planes and multiplying the product by 0.5233 (ellipsoid volume formula) as proposed by Orsini et al.[24]
Enhancement pattern of the fibroids was evaluated and categorized as strongly enhancing, heterogeneously/mildly enhancing, or non-enhancing. The images were anonymized for confidentiality using anonymizing software in the PACS system (Agfa Impa × 6.4.5.4551).
Ethical considerations
This was a radiological study conducted utilizing the images obtained during diagnostic work-up and follow-up. Images were evaluated and measurements obtained for analysis. The study did not influence direct patient care; therefore, it was considered that individual consent was not appropriate.
The primary investigator sought permission from the hospital's Chief of Staff to access patient files, if needed, at the health records department. Any significant finding that emerged during image evaluation which had not been identified in the original report was communicated to the referring physician by way of an addendum to the original report. A high level of confidentiality was maintained. The reviewers of the imaging data were blind to the patients’ biodata and clinical findings. The images were also anonymized for extra confidentiality. The study investigator had no conflict of interest to declare.
RESULTS
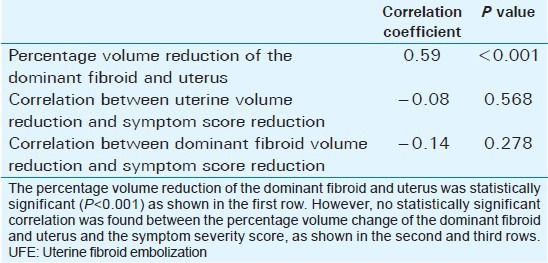
Mean age of the respondents was 41.7 years, with the youngest and eldest respondents aged 27 and 49 years, respectively [Table 1]. Baseline mean symptoms score, UV, and dominant fibroid volume were 24.4, 847.1 cm3, and 209.2 cm3, respectively [Table 2]. Note that the symptom severity score, based on a Likert scale, had a possible minimum and maximum of 8 and 40, respectively. The percentage reduction in the symptom score, UV, and DFV after UFE was 37.8%, 40.1%, and 43.7%, respectively [Table 3]. The number of fibroids per participant was categorized into three groups: 1–5, 6–10, and > 10. The number of participants in each category was then presented as a percentage; 59% of the participants had more than 10 fibroids each, while 21% and 20% of the participants had 1–5 and 6–10 fibroids each, respectively [Pie Chart 1]. Analysis of the enhancement pattern of the dominant fibroids before and after UFE revealed that all the dominant fibroids mildly or moderately enhanced before UFE and none enhanced after UFE [Table 4]. Evaluation of the position of dominant fibroids revealed 78% being intramural/transmural, 12% being submucosal, and 10% being subserosal [Pie Chart 2]. The percentage volume reduction of the dominant fibroid and uterus was statistically significant (P < 0.001) [Table 5]. However, no statistically significant correlation was found between the percentage volume change of both the dominant fibroid and uterus and the symptom severity score [Table 5].
Table 1.
Mean and distribution of the age of the participants

Table 2.
Baseline symptom scores, baseline volume of the dominant fibroid, and baseline volume of uterus of the participants

Table 3.
The average percentage reduction of the symptom severity scores, volume of the dominant fibroid, and volume of the uterus, 3-6 months after UFE

Pie Chart 1.
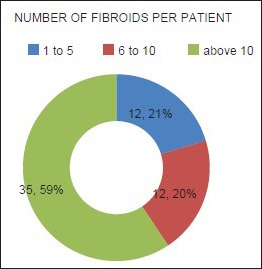
The number of fibroids per respondent. The number of fibroids per respondent was categorized into three groups: 1–5, 6–10, and >10. The number of participants in each category was then presented as a percentage: 59% of the participants had more than 10 fibroids, 21% had between 6 and 10 fibroids, while 20% had less than 5 fibroids.
Table 4.
The enhancement pattern of the dominant fibroids before and after UFE

Pie Chart 2.
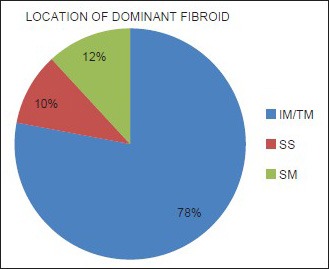
The positions of the dominant fibroids. The intramural (IM) and transmural (TM) dominant fibroids were lumped together due to difficulty of the reviewers in correctly categorizing the two. Also, 78% of the fibroids were intramural/transmural, 12% were submucosal (SM), while 10% were subserosal (SS).
Table 5.
Correlation between dominant fibroid volume, uterine volume, and symptom severity score after UFE
Selected images of some of the patients are provided [Figures 1–6].
Figure 1.
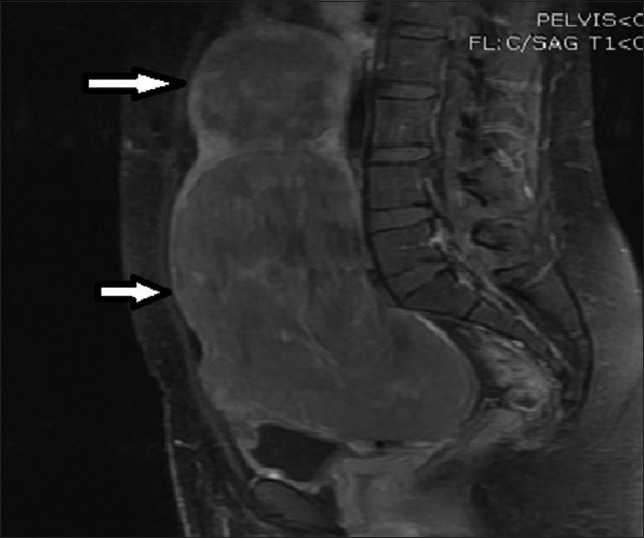
28-year-old female presenting with menorrhagia and pelvic mass. Post-contrast T1-weighted sagittal MRI image before UFE reveals two enhancing fibroids (solid arrows).
Figure 6.
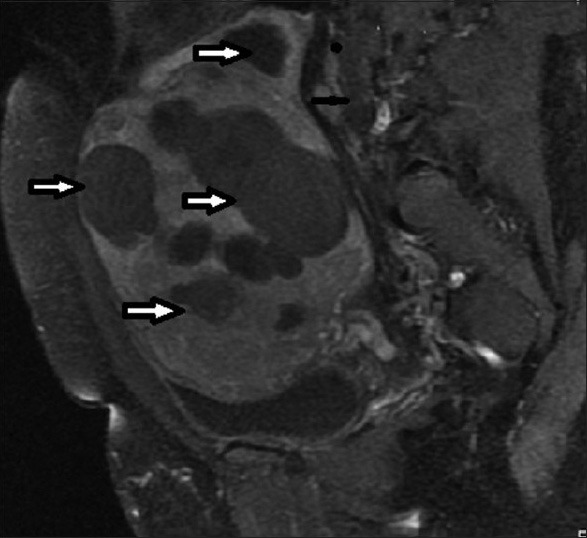
34 year old female presenting with heavy menses. T1-weighted sagittal post-contrast MRI image before UFE shows bulky uterus with multiple fibroids (arrows).
Figure 2.
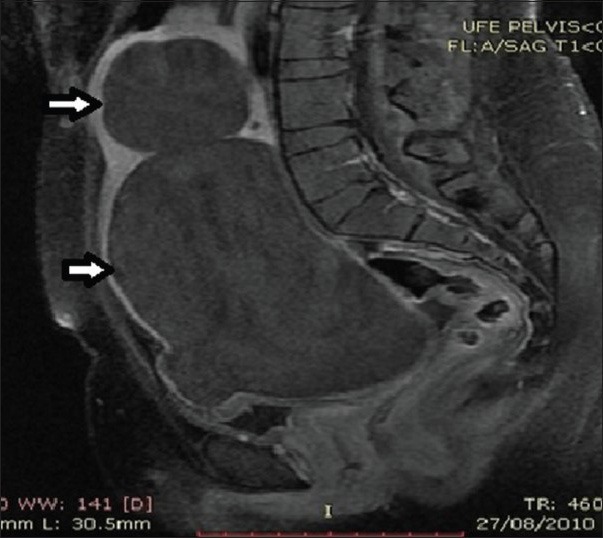
28-year-old female presenting with menorrhagia and pelvic mass. Follow-up MRI post UFE, the fibroids demonstrate loss of enhancement (arrows), but no significant change in volume.
Figure 3.
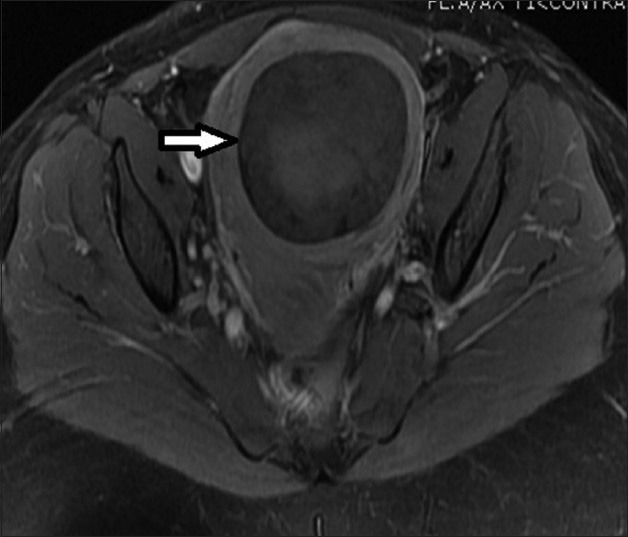
33-year-old female presenting with mild pelvic pain and a palpable pelvic mass. T1-weighted axial MRI image before UFE shows a single intramural fibroid with heterogeneous (mild/moderate) enhancement pattern.
Figure 4.
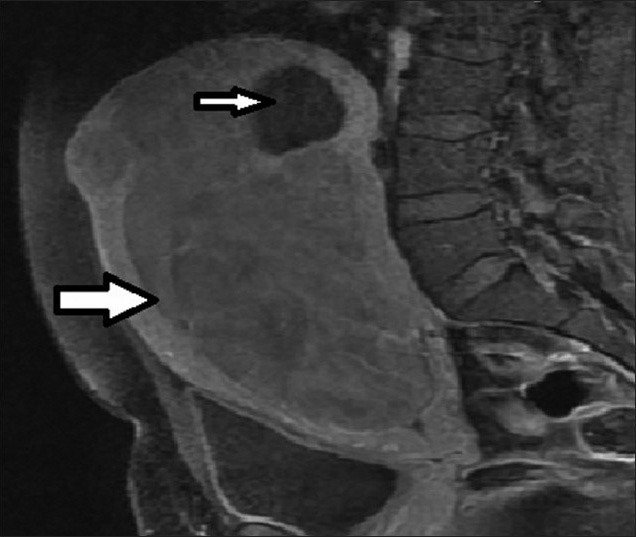
36-year-old female presenting with pelvic mass, lower abdominal pain, infertility, and menorrhagia. T1-weighted sagittal MRI image before UFE reveals a large enhancing fibroid (thick arrow) and a small non-enhancing fibroid (thin arrow).
Figure 5.
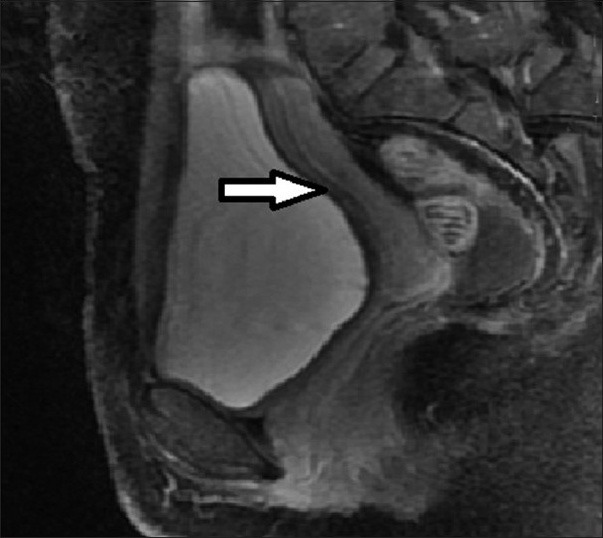
36-year-old female presenting with pelvic mass, lower abdominal pain, infertility, and menorrhagia. Follow-up MRI post UFE shows the fibroids has completely regressed (arrow).
DISCUSSION
UFE is a fairly new treatment option for women with uterine fibroids in Kenya and sub-Saharan Africa at large. Data on both clinical and radiological response is, therefore, lacking. This study was aimed at assessing the response among pioneer African women in a tertiary institution in Kenya.
The catchment population of the institution is mainly African, who are known to have high prevalence of uterine fibroids, and larger and numerous fibroids compared to other races.[7,8,9,10,11,12,13] The study was, therefore, structured to assess and detect the percentage change in the UV, DFV, and symptom score, and their correlation among this African population.
Patient selection, UFE, and interpretation of findings were carried out by an experienced team comprising an interventional radiologist, consultant gynecologist, and consultant radiologist. Imaging of the participants was carried out in the same facility, using the same scanner and standardized imaging protocol. The reviewers were blind to clinical information and images were anonymized. All these factors helped in reduction of bias during the study.
The high mean UV at baseline corresponding to 847 cm3, more than 10 fibroids in 59% of participants, percentage change of the dominant fibroid and the uterus being equal to 43.7% and 40.1%, respectively, and lack of correlation between the clinical and radiological outcome after UFE were the principal findings in this study. It is therefore clear that UFE is a viable option for treating uterine fibroids in an African population.
Assessment of the extent of uterine fibroid disease at baseline allowed comparison of baseline and follow-up data and evaluation of possible interactions with the clinical outcome. MRI showed significant volume reduction of both uterus and dominant fibroid at short-term follow-up, which corresponded to 43.7% and 40.1%, respectively. The amount of UV and DFV reduction in this study is in the range reported in other studies and case series, mainly from the west. In the study by Reena et al., the mean decrease in UV was from 588.6 cm3 to 393.1 cm3, which resulted in a 33.5% change (P < 001). The reduction in the dominant fibroid volume in our study was comparable to these studies with a mean volume of 69.4 cm3 before UFE and 41.4 cm3 after UAE, which resulted in a 40.1% volume reduction (P < 001).[22] Similar observations were also made by Andersen et al.,[25] Spies and colleagues,[26] and Walker and Pelage,[27] who reported ranges between 35% and 55%.
Severe symptoms and presence of large and numerous fibroids among the participants of this study are consistent with what have been observed in other studies on African and African-American populations notably by Kjerulff et al.[8] Spies and colleagues[26] originally validated their symptom score questionnaire in a patient population with uterine fibroids in comparison with a healthy control group. The baseline symptom severity scores and short-term follow-up in their patient population correspond to those observed in this study. Similar observations have also been made in a study by Scheurig et al.
No clear association between baseline UV and DFV, and percentage UV and DFV reduction after UFE emerged from the results of previously reported large case series.[26,28] Likewise, in this study, no association was found between the number of fibroids, the localization of the dominant leiomyoma at baseline MRI, and the UV/DFV reduction after UFE. In addition, no significant correlation between improvement in symptoms and imaging findings was identified. However, strong enhancement at baseline correlated to a better outcome.
In the study by Reena et al., it was observed that clinical and imaging response to UFE was lower in older patients and those with larger fibroids/UV at presentation. Our study was not powered to detect these differences. Future studies may, therefore, look into these parameters. A study in South Africa aimed at assessing the effect of large uterus on the outcome of UFE did not, however, reveal significant differences between those with UVs below and above 780 cm3. This is likely related to embolic particle distribution per unit volume of the fibroid. This may also explain why the response to UFE in our study is similar to that in the west, even though our participants had, on average, large and numerous fibroids. Other factors such as diet and living conditions, which were not assessed in this study, could also play a role. Future studies may, therefore, take into consideration the number of embolic particles per fibroid volume, environmental factors, and lifestyle of the participants.
Significant reduction in the uterine and dominant fibroid after UFE is due to sluggish or no blood flow in the uterine arteries, which are the vessels that typically supply large feeding branches to the fibroids. The enhancement of fibroids is related to blood flow. Fibroids with good blood flow, therefore, enhance strongly and vice versa. This explains why fibroids which were strongly enhancing at baseline had better response after UFE. Moderately or mildly enhancing fibroids had lesser response due to the fact that part of the fibroids had already undergone degeneration at the time of embolization. Patient selection is, therefore, important for successful UFE.
Lack of statistically significant correlation between volume change of the uterus and dominant fibroid and the symptom scores in our study has implications on the clinicians and policy makers. The follow-up MRI scans done in many centers might not be warranted unless for specific reasons like assessment of patients with complications. This will likely reduce the cost of undergoing UFE and make it more accessible in the developing world.
Limitations of the study
A few limitations were encountered in the study. The first is that follow-up MRI was not uniformly performed at the intended 3 months post UFE. Some participants (approximately 10%) were scanned up to 6 months post UFE. The second limitation is that this was a post graduate dissertation study, and therefore, funds were limited. A small sample size was, therefore, chosen and studied to only detect changes in the uterine and dominant fibroid volumes and symptoms scores. Many other parameters such as dietary and environmental factors influencing response to treatment were not assessed. Long-term changes (more than 1 year) were also not studied.
CONCLUSION
The response of uterine fibroids to embolization in the African population is not different from the findings reported in other studies from the west. The presence of multiple and large fibroids in this study is consistent with the case mix described in the studies of African-American populations.
Patient counseling should emphasize the independence of volume reduction and symptom improvement. Volume changes are of relevance for the radiologist in aiding understanding of the evolution of the condition and identifying potential technical treatment failures, but should not be the main basis of evaluation of treatment success.
ACKNOWLEDGMENTS
The authors wish to thank the management, staff, faculty members, and residents of Aga Khan University Hospital for their invaluable input and for being a great source of support during the study. Appreciation also goes to the radiology department secretary who assisted in the proofreading and editing of this paper and to the departmental IT specialist who assisted with formatting and other technical aspects.
Footnotes
Available FREE in open access from: http://www.clinicalimagingscience.org/text.asp?2015/5/1/18/154351
Source of Support: The study was funded by the Aga Khan University
Conflict of Interest: None declared.
REFERENCES
- 1.VerKauf BS. Changing trends in treatment of leiomyomata uteri. Curr Opin Obstet Gynecol. 1993;5:301–10. [PubMed] [Google Scholar]
- 2.Pokras R, Hufnagel VG. Hysterectomy in the United States, 1965-84. Am J Public Health. 1988;78:852–3. doi: 10.2105/ajph.78.7.852. [DOI] [PMC free article] [PubMed] [Google Scholar]
- 3.Chryssikopoulos A, Loghis C. Indications and results of total hysterectomy. Int Surg. 1986;71:188–94. [PubMed] [Google Scholar]
- 4.Spies JB, Coyne K, Guaou Guaou N, Boyle D, Skyrnarz-Murphy K, Gonzalves SM. The UFS-QOL, a new disease-specific symptom and health-related quality of life questionnaire for leiomyomata. Obstet Gynecol. 2002;99:290–300. doi: 10.1016/s0029-7844(01)01702-1. [DOI] [PubMed] [Google Scholar]
- 5.Wallach EE, Vlahos NF. Uterine myomas: An overview of development, clinical features, and management. Obstet Gynecol. 2004;104:393–406. doi: 10.1097/01.AOG.0000136079.62513.39. [DOI] [PubMed] [Google Scholar]
- 6.Chalas E, Constantino JP, Wickerham DL, Wolmark N, Lewis GC, Bergman C, et al. Benign gynaecologic conditions among participants in the Breast Cancer Prevention Trial. Am J Obstet Gynecol. 2005;192:1230–9. doi: 10.1016/j.ajog.2004.12.083. [DOI] [PubMed] [Google Scholar]
- 7.Wise LA, Palmer JR, Stewart EA, Rosenberg L. Age-specific incidence rates for self-reported uterine leiomyomata in the Black Women's Health Study. Obstet Gynecol. 2005;105:563–8. doi: 10.1097/01.AOG.0000154161.03418.e3. [DOI] [PMC free article] [PubMed] [Google Scholar]
- 8.Kjerulff KH, Langenberg P, Seidman JD, Stolley PD, Guzinski GM. Uterine leiomyomas. Racial differences in severity, symptoms and age of diagnosis. J Reprod Med. 1996;41:483–90. [PubMed] [Google Scholar]
- 9.Ross RK, Pike MC, Vessey MP, Bull D, Yeates D, Casagrande JT. Risk factors for uterine fibroids: Reduced risk associated with oral contraceptives. Br Med J (Clin Res Ed) 1986;293:359–62. doi: 10.1136/bmj.293.6543.359. [DOI] [PMC free article] [PubMed] [Google Scholar]
- 10.Ligon AH, Morton CC. Leiomyomata: Heritability and cytogenetic studies. Hum Reprod Update. 2001;7:8–14. doi: 10.1093/humupd/7.1.8. [DOI] [PubMed] [Google Scholar]
- 11.Chiaffarino F, Parazzini F, La Vecchia C, Marsico S, Surace M, Ricci E. Use of oral contraceptives and uterine fibroids: Results from a case-control study. Br J Obstet Gynaecol. 1999;106:857–60. doi: 10.1111/j.1471-0528.1999.tb08409.x. [DOI] [PubMed] [Google Scholar]
- 12.Lumbiganon P, Rugpao S, Phandhu-fung S, Laopaiboon M, Vudhikamraksa N, Werawatakul Y. Protective effect of depot-medroxyprogesteroneacetate on surgically treated uterine leiomyomas: A multicenter case-control study. Br J Obstet Gynaecol. 1996;103:909–14. doi: 10.1111/j.1471-0528.1996.tb09911.x. [DOI] [PubMed] [Google Scholar]
- 13.Baird DD, Dunson DB, Hill MC, Cousins D, Schectman JM. High cumulative incidence of uterine leiomyoma in black and white women: Ultrasound evidence. Am J Obstet Gynecol. 2003;188:100–7. doi: 10.1067/mob.2003.99. [DOI] [PubMed] [Google Scholar]
- 14.Statistics by Country for Uterine Fibroids. [Last accessed on 2012 Aug 20]. Available from: http://www.rightdiagnosis.com/u/uterine_fibroids/stats-country.htm .
- 15.Dudiak CM, Turner DA, Patel SK, Archie JT, Silver B, Norusis M. Uterine leiomyomas in the infertile patient: Preoperative localization with MR imaging versus US and hysterosalpingography. Radiology. 1988;167:627–30. doi: 10.1148/radiology.167.3.3283833. [DOI] [PubMed] [Google Scholar]
- 16.Zawin M, McCarthy S, Scoutt LM, Comite F. High-field MRI and US evaluation of the pelvis in women with leiomyomas. Magn Reson Imaging. 1990;8:371–6. doi: 10.1016/0730-725x(90)90044-3. [DOI] [PubMed] [Google Scholar]
- 17.Dueholm M, Lundorf E, Hansen ES, Ledertoug S, Olesen F. Accuracy of magnetic resonance imaging and transvaginal ultrasonography in the diagnosis, mapping, and measurement of uterine myomas. Am J Obstet Gynecol. 2002;186:409–15. doi: 10.1067/mob.2002.121725. [DOI] [PubMed] [Google Scholar]
- 18.Vitiello D, McCarthy S. Diagnostic imaging of myomas. Obstet Gynecol Clin North Am. 2006;33:85–95. doi: 10.1016/j.ogc.2005.12.013. [DOI] [PubMed] [Google Scholar]
- 19.Hricak H, Finck S, Honda G, Göranson H. MR imaging in the evaluation of benign uterine masses: Value of gadopentate dimeglumine-enhanced T1-weighted images. AJR Am J Roentgenol. 1992;158:1043–50. doi: 10.2214/ajr.158.5.1566664. [DOI] [PubMed] [Google Scholar]
- 20.Shnitzler D, Oehler E. Uterine Fibroid Embolization, a Minimally Invasive Treatment for Uterine Fibroids. Fact sheet. Society of Interventional Radiology. 2012. Jul 27th, Downloaded from www.drrws.com .
- 21.Hacking N. Costing Issues and UAE in the Developing World. In: Reidy J, et al., editors. Radiological Interventions in Obstetrics and Gynaecology, Medical Radiology. Diagnostic Imaging. Berlin Heidelberg: Springer; 2014. DOI: 10.1007/174_2014_1011. [Google Scholar]
- 22.Jha RC, Ascher SM, Imaoka I, Spies JB. Symptomatic Fibroleiomyomata: MR Imaging of the uterus before and after uterine arterial embolization. Radiol. 2000;217:228–35. doi: 10.1148/radiology.217.1.r00se49228. [DOI] [PubMed] [Google Scholar]
- 23.Goodwin SC, Bonilla SM, Sacks D, Reed RA, Spies JB, Landow WJ, et al. Members of the Reporting Standards for Uterine Artery Embolization (UAE) Subcommittee, the Members of the UAE Task Force Standards Subcommittee, and the Members of the SCVIR Technology Assessment Committee. Reporting standards for uterine artery embolization for the treatment of uterine leiomyomata. J Vasc Interv Radiol. 2001;12:1011–20. doi: 10.1016/s1051-0443(07)61586-3. [DOI] [PubMed] [Google Scholar]
- 24.Orsini LF, Salardi S, Pilu G, Bovicelli L, Cacciari E. Pelvic organs in premenarcheal girls: Real-time ultrasonography. Radiol. 1994;153:113–6. doi: 10.1148/radiology.153.1.6473771. [DOI] [PubMed] [Google Scholar]
- 25.Andersen PE, Lund N, Justesen P, Munk T, Elle B, Floridon C. Uterine artery embolization of symptomatic uterine fibroids. Initial success and short-term results. Acta Radiologica. 2001;42:234–38. [PubMed] [Google Scholar]
- 26.Spies JB, Roth AR, Jha RC, Gomez-Jorge J, Levy EB, Chang TC, et al. Leiomyomata treated with uterine artery embolization: Factors associated with successful symptom and imaging outcome. Radiol. 2002;222:45–52. doi: 10.1148/radiol.2221010661. [DOI] [PubMed] [Google Scholar]
- 27.Walker WJ, Pelage JP. Uterine artery embolisation for symptomatic fibroids: Clinical results in 400 women with imaging follow up. Br J Obstet Gynaecol. 2002;109:1262–72. doi: 10.1046/j.1471-0528.2002.01449.x. [DOI] [PubMed] [Google Scholar]
- 28.Pron G, Bennett J, Common A, Wall J, Asch M, Sniderman K Ontario Uterine Fibroid Embolization Collaboration Group. The Ontario Uterine Fibroid Embolization Trial. Part 1. Uterine fibroid reduction and symptom relief after uterine artery embolization for fibroids. Fertil Steril. 2001;75:115–32. doi: 10.1016/s0015-0282(02)04538-7. [DOI] [PubMed] [Google Scholar]


