

Abstract
Hepatic steatosis is the buildup of lipids within hepatocytes. It is the simplest stage in nonalcoholic fatty liver disease (NAFLD). It occurs in approximately 30% of the general population and as much as 90% of the obese population in the United States. It may progress to nonalcoholic steatohepatitis, which is a state of hepatocellular inflammation and damage in response to the accumulated fat. Liver biopsy remains the gold standard tool to diagnose and stage NAFLD. However, it comes with the risk of complications ranging from simple pain to life-threatening bleeding. It is also associated with sampling error. For these reasons, a variety of noninvasive radiological markers, including ultrasound, computed tomography, magnetic resonance spectroscopy, and the controlled attenuation parameter using transient elastography and Xenon-133 scan have been proposed to increase our ability to diagnose NAFLD, hence avoiding liver biopsy. The aim of this review is to discuss the utility and accuracy of using available noninvasive diagnostic modalities for fatty liver in NAFLD.
Keywords: Hepatic steatosis, nonalcoholic fatty liver, noninvasive methods for hepatic steatosis assessment
Nonalcoholic fatty liver disease (NAFLD) is a spectrum of disease characterized by macrovesicular steatosis of the liver. It ranges from simple fatty liver (steatosis) to nonalcoholic steatohepatitis (NASH), which is a state of hepatocellular inflammation and damage in response to the accumulated fat. NAFLD is usually a diagnosis of exclusion made in patients who have not consumed alcohol in amounts considered to be harmful to the liver.[1] NASH carries a risk for progressive fibrosis, cirrhosis, and ultimately end-stage liver disease. It is currently the third most common cause of liver transplantation and is projected to be the leading cause in 2020.[2] An estimated 20-33% of American adults, approximately 90 million people, have NAFLD.[3] NAFLD prevalence has been reported to be 5-30% in the Asia Pacific region, which is lower than that in Western countries.[4] Hepatic steatosis, which is the simplest stage in NAFLD, occurs in approximately 30% of the general population and in as much as 90% of the obese population in the United States.[5] The clinical implication of NAFLD is that it is not limited to cause serious injury to the liver alone; it is a strong predictor of cardiovascular disease. It frequently occurs with features of the metabolic syndrome, including obesity, diabetes mellitus, dyslipidemia, and hypertension. The pathophysiological distinctive feature of NAFLD is insulin resistance, associated with mediators of oxidative stress and inflammatory cytokines.[6,7] One of the biggest challenges in many individuals with either NAFLD or NASH is the asymptomatic nature of the disease, making early detection difficult. When symptoms do occur, they are nonspecific such as vague right-upper-quadrant abdominal pain, fatigue, and malaise. Rarely, pruritus, anorexia, and nausea can develop. The occurrence of ascites with abdominal distension, variceal hemorrhage, or hepatic encephalopathy is indicative of progression to decompensated cirrhosis. Tests measuring liver enzymes such as alanine aminotransferase (ALT), aspartate aminotransferase (AST), and γ-glutamyltransferase (GGT) are performed routinely. Unfortunately, such markers may fail to detect the presence of hepatic steatosis due to the fact that many individuals have completely normal transaminases even those with significantly advanced steatosis.[8] A retrospective study by Fracanzani et al. showed that NASH was diagnosed in 59% and 74% of the patients with normal and increased ALT, respectively.[9] Liver biopsy is still used as the gold standard because it is considered the best diagnostic and staging tool in most studies. Liver biopsy comes with a risk of procedure-related complications ranging from simple pain to life-threatening bleeding.[10] In addition, it is associated with a sampling error that is in part related to the patchy histological changes of NAFLD and NASH as biopsies sample only approximately 1/50,000 of the total mass of the liver.[11,12] For these reasons, a variety of noninvasive serum and radiologic markers have been proposed to increase our ability to distinguish between simple hepatic steatosis, which is benign, and NASH. It is also important to grade the severity of hepatic steatosis, as it is associated with a long-term prognosis in NASH as compared to the general population. Therefore, grading steatosis will enhance the follow-up management of patients with NAFLD. The aim of this article is to provide a comprehensive evidence-based review of those noninvasive techniques to diagnose NAFLD.
NONINVASIVE TESTS TO DISTINGUISH BETWEEN HEPATIC STEATOSIS AND NASH
Serum markers
There is no single biochemical marker that distinguishes the stages of NAFLD (simple steatosis, NASH, and cirrhosis). However, there are some groups that are trying to validate some markers to distinguish simple steatosis and NASH. Cermille et al. studied the miRNAs by extracting intracellular and extracellular RNA using miRNeasy extraction kit from NAFLD patients. They found that miR-122 levels were increased by 7.3-fold in NAFLD patients compared with healthy controls. They also found that miR-122 and miR-34a levels were higher in NASH group compared with patients with simple steatosis.[13]
Cytokeratin-18 fragments in blood have been shown to be significantly elevated in patients with NASH (median 516.7 U/L) as compared with fatty liver or healthy controls (median 234 U/L). Therefore, it suggests that noninvasive monitoring of hepatocyte apoptosis in the blood of patients with NAFLD is a reliable tool to differentiate positive and negative for NASH in patients with suspected NAFLD. A meta-analysis of 10 studies showed that cytokeratin-18 fragments had area under the receiver-operating characteristic (ROC) curve of 0.8 to diagnose NASH.[14]
Magnetic resonance
Magnetic resonance imaging (MRI) and magnetic resonance spectroscopy (MRS) works on the same physical principle. MRI provides the anatomical information, whereas MRS provides the biochemical component. Both have an advantage over ultrasound (US) and computed tomography (CT) in that they are able to detect small changes in liver fat content. MRS can be performed as an adjunct to whole body MRI, as part of the same examination, allowing a comparison to be made between hepatic fat content and whole body adipose tissue distribution in the same subject.[15]
Magnetic resonance imaging
MRI techniques use the frequency difference between water and lipid signals for generation of in-phase (IN) and opposed-phase (OP) images.[16] This method acquires MR images at echo times in which fat proton and water proton signals are either in-phase (fat and water signals cancel each other) or out-of-phase (fat and water signals will add up). By comparing the two phases: Signal loss on the out-of-phase means that fat is present in liver, whereas no signal loss proposes the absence of fat. The most widely used method is the Dixon method, where he applied this principle with a modified echo technique.[17] Many researchers continue developing modifications to the original Dixon method to reduce its limitations. Such improvements include better postprocessing algorithms, faster scan time, improved T2/T1 compensation, reduce the effect of field inhomogeneity, and decrease the ambiguity between fat and water.[18] Advantages of MRI include no radiation exposure as compared with CT and a greater ability to differentiate tissue characterization than CT and US.[19] MRI has a sensitivity of 80% and specificity of 95% to detect moderate/severe steatosis. It also has a sensitivity of 85% and specificity of 100% to detect mild steatosis.[20] Hepatic MRI correlated well with histology (r=0.773, P<0.001) in a prospective study that was done on individuals with known or suspected liver disease such as Hepatitis C, NAFLD, and chronic hepatitis with unknown etiologies. MRI correlated better with macrovesicular steatosis (r=0.920, P<0.001) than mixed steatosis (r=0.605, P<0.05). NAFLD had higher fat fraction, which is calculated from fat and water proton densities determined at spectroscopy and was equivalent to tissue triglyceride concentration, than Hepatitis C.[21] The use of MRI clinically in the diagnosis and monitoring of patients with hepatic steatosis has been limited partly because of its relatively high cost, reliance on patient cooperation, and long imaging time.[21]
Proton magnetic resonance spectroscopy
MRS directly measures proton signals from the acyl groups of hepatocyte triglyceride stores. It offers a quantitative assessment of fatty infiltration of the liver. Previous studies found that steatosis measured by MRS closely correlated with biochemical and histological assessment of liver triglyceride content.[22,23]
Clinical MRS became feasible with the development of a rapid, inexpensive, and automated technique that could be easily integrated with the MRI exam.[24] However, it is still considered a research tool.
Recently, hepatic phosphorus-31 MRS (31P MRS) was proposed as a potential marker for chronic liver disease as it shows distinct biochemical changes in different NAFLD states in some studies. Moreover, it may be a useful future direction of research.[25]
Proton density fat fraction (PDFF) with MRI, is used for quantifying the liver fat content. A retrospective study that was done by Idilman et al. showed that PDFF with MRI had area under the curve of 0.95 when discriminating moderate or severe hepatic steatosis from mild or no hepatic steatosis. It also showed that PDFF results were affected by the presence of fibrosis.[26]
NONINVASIVE DIAGNOSIS OF HEPATIC STEATOSIS IN NAFLD
Measurement of body fat and fat distribution
Studies have shown that obesity is strongly associated with hepatic steatosis.[27] Therefore, the usual management of NAFLD includes gradual weight reduction and increase in physical activity.[28] However, it remains uncertain whether excessive food consumption per se causes fatty liver or diets that are enriched in certain types of food are more likely to cause hepatic steatosis.[27,29] Body mass index (BMI) has been directly linked with the prevalence of NAFLD.[30] This leads to the speculation that a greater BMI in patients with NAFLD will lead to a more severe degree of hepatic steatosis.[31] NAFLD now occurs in the range of 65-92.3% of morbidly obese patients (BMI > 40 kg/m2).[32] Waist circumference (WC) is a simple and inexpensive tool for assessing body fat distribution. It correlates well with abdominal obesity and it is associated with increased risk for adiposity-related morbidity and mortality.[33] WC and waist/hip ratio (WHR) are used as markers of abdominal obesity as they reflect central obesity.[34] It has been proposed that WHR and/or WC are more related to NAFLD than BMI.[30] In summary, WHR and WC are simple tools that can be applied as important anthropometric indicators to screen populations with a high risk for NAFLD.[35]
Serum markers
There is no single biochemical marker that confirms the diagnosis of NAFLD. However, several groups have proposed noninvasive models to diagnose hepatic steatosis in NAFLD:
Steatotest
Steatotest (ST) is a logistic regression module consisting of 12 components-ALT, α2-macroglobulin (A2M), apolipoprotein A-I (ApoA1), haptoglobin, total bilirubin, gamma glutamyl transferase (GGT), cholesterol, triglycerides, glucose, age, gender, and BMI. Poynard et al. evaluated the ST for the diagnosis of hepatic steatosis in patients with chronic liver diseases secondary to hepatitis C virus (HCV) infection, alcoholic fatty liver disease (ALD), and NAFLD. This prospective study was tested on 884 subjects and it predicted >30% steatosis with 90% sensitivity, 90% specificity, 93% negative predictive value (NPV), and 63% positive predictive value (PPV).[36] ST has been validated in HCV patients before and after treatment but not validated in ALD and NAFLD patients. Another study showed that ST had PPV of 92% for the diagnosis of steatosis greater than steatosis grade 0, but ST was not able to differentiate between steatosis greater than 66% versus 33-66%.[37] However, ST has several advantages, in that it is non-invasive, easy to use, and the 12 components of ST are readily available.
Fatty liver index
It is a validated algorithm derived from the serum triglyceride (TG), BMI, waist circumference, and GGT levels. It was validated in a large group of subjects with or without suspected liver disease with an accuracy of 0.84 (95% CI) in detecting fatty liver. Fatty liver index varies between 0 and 100. An index <30 rules out fatty liver and an index ≥60 rules in fatty liver.[38] Zelber-Sagi et al. cross-sectional study of the subject on the general population showed that fatty liver index has notable agreement with ST compared with a moderate agreement with US.[39]
Imaging techniques
Ultrasound
US is currently the preferred method for screening asymptomatic patients with elevated liver enzymes or those at high risk of having NAFLD. US is accepted as an initial screening for fatty liver because it is noninvasive, inexpensive, and widely available.[40,41] Hepatic steatosis will lead to an increase in the echogenicity of the liver parenchyma on ultrasound that will show the liver appearing brighter than the cortex of the kidney.[42] A Japanese study conducted on the general population shows that ultrasound scanning has a sensitivity of 94% and a specificity of 84% for detecting liver steatosis.[43] Another prospective study done by Saadeh et al. showed a sensitivity of 100% and PPV of 62% for detecting steatosis >33%.[44] Palmentieri et al's prospective study on patients suspected of having liver disease of various etiologies undergoing ultrasound and liver biopsy also showed that B-model ultrasound had 91% sensitivity, 89% specificity, 89% NPV, and 94% PPV.[40] The sensitivity of US decreases in morbidly obese patients to 86% sensitivity and 68% specificity.[45] It also decreases if the degree of fat infiltration is ≤30%.[46] Dasarathy et al. showed that US is better in detecting macrovesicular hepatic steatosis of any degree with a sensitivity of 61% and a specificity of 100% compared with microvesicular fat with a sensitivity of 43% and a specificity of 73%.[47] US has several limitations; (1) diffuse hepatic steatosis and diffuse fibrosis can have similar sonographic appearance and therefore, sometimes it is difficult to distinguish between them;[48] (2) it is an operator-dependant modality with varying results between operators; (3) its inability to precisely quantify hepatic fat content (ie, grading: Mild, moderate, and severe steatosis); and (4) its inability to detect small changes in liver fat content with time, which makes its use in follow up challenging.[49]
The hepatorenal ratio (HRR) is a US index for quantifying liver steatosis. Normal liver shows an echostructure similar to that of renal parenchyma. In fatty liver, the increased hepatic echogenicity creates hepatorenal contrast.[50] Webb et al. studied 111 patients with hepatitis B, hepatitis C, NAFLD, or unexplained elevation of liver enzymes that were referred for sonographically guided liver biopsy. Hepatorenal sonographic index had a 100% sensitivity, 91% specificity, NPV 88%, and PPV of 100% for the diagnosis of hepatic steatosis>5%.[51] An observational study on healthy volunteers showed that HRR has 92.7% sensitivity and 92.5% specificity compared with liver biopsy.[52] Marshal et al. studied 101 patients, excluding renal disease patients and liver masses patients, who underwent liver biopsy; they observed that HRR of 1.28 or greater had a 100% sensitivity and 54% specificity.[53] Hepatorenal sonographic index is a promising tool for the follow-up patients with steatosis.
Controlled attenuation parameter
Transient elastography, (Fibroscan or Echosens) is a technique used to measure tissue elasticity based on ultrasound technology; it is used as a noninvasive assessment of hepatic fibrosis. The Fibroscan is a simple and low-cost device that may be performed by physicians or even nonphysicians after a short training period.[54] It has recently been proposed for measuring liver stiffness. Liver stiffness measurement (LSM) appears to be a reliable tool to identify hepatic fibrosis and cirrhosis mainly in patients with chronic hepatitis C (CHC) but limited data are available in patients with NAFLD.[54] BMI is the only factor associated with failure of Fibroscan in NAFLD. In overweight or obese patients, the fatty thoracic belt attenuates elastic and US waves, rendering liver stiffness measurement impossible, which may lead to underestimation of liver damage.[55] Controlled attenuation parameter (CAP) is a novel proprietary algorithm and a noninvasive tool based on US attenuation. It has been developed for use with the fibroscan to measure steatosis. It is only measured on the same validated measurements according to the same criteria used for LSM and on the same signals. The final CA P value, which ranges from 100 to 400 decibels per meter (dB/m), is the median of individual measurements. A prospective study in overweight and obese patients with chronic liver disease showed that CAP at a cutoff of 283 dB/m has 76% sensitivity and 79% specificity to detect steatosis.[56] In another prospective study by De Ledinghen et al., on patients with chronic liver disease (HCV and NAFLD) to evaluate the diagnosis of steatosis, showed that CAP, area under the ROC was 0.84 for the diagnosis of steatosis≥S1, 0.86 for the diagnosis of steatosis≥S2, and 0.93 for the diagnosis of steatosis≥S3.[57] CAP is a semi-quantitative method to assess steatosis that is operator/machine independent. It is less influenced by sampling error compared with liver biopsy because it explores liver volume 100 times larger.[58] However, only a few studies on CAP have been published on patients with chronic liver disease, and none on the general population. Furthermore, CAP is not available in the measurement with XL probe. Therefore, CAP needs further validation and further development.[59]
Computed tomography
CT provides an accurate and a reliable visualization of the whole liver, so that not only diffuse but also focal fatty infiltrations of the liver parenchyma can be accurately diagnosed.[60] The CT diagnosis of hepatic steatosis is made by measuring the difference in liver and spleen attenuation values in Hounsfield units.[61] Hepatic steatosis is best visualized in nonenhanced CT images, which presents as decreased attenuation values of the parenchyma (ie, hypodense liver) due to the inverse relationship between hepatic fat content and hepatic attenuation.[62] It has 73-100% sensitivity and 95-100% specificity to detect moderate-to-severe steatosis.[63] Park et al.'s prospective study on 158 living donors underwent same-day unenhanced CT using liver-to-spleen attenuation ratio and liver-to-spleen attenuation difference to detect steatosis>30% and ultrasonography-guided liver biopsy. It showed that CT had 73-82% sensitivity and 100% specificity in the assessment of macrovesicular steatosis.[64] Another study suggested that 0% of steatosis in histology findings showed 1.296 liver-to-spleen ratio, which would be beneficial as a cutoff value to exclude clinically important liver steatosis.[65] Enhanced CT has a limited role in the diagnosis of steatosis due to the influence of contrast injection rate and the timing of analysis on liver attenuation.[63] Widespread application of CT scan in patients with NAFLD is limited for many reasons, such as the risk of radiation exposure, high cost that makes it difficult to use in follow-up. In addition, its ability to detect steatosis decreases as the severity of steatosis increases.[60]
Xenon-133 liver scan
Xenon (Xe-133) gas is highly fat soluble and therefore concentrates in fatty tissues. In addition, Xe-133 gas is cheap and safe with very low radiation risk.[66] The estimated absorbed radiation dose is 155 MBq (5 mCi) of Xenon-133 for 5 min. Kitani and Winkler have confirmed the solubility of Xe-133 gas in liver tissue with varying lipid content that is measured enzymatically.[67] Recently, a retrospective study by Al-Busafi and colleagues showed that Xe-133 scan had 94.3% sensitivity and 87.5% specificity for detecting NAFLD.[66] Xenon-133 liver scan is a promising test for the diagnosis and quantification of hepatic steatosis and can reliably rule-in or rule-out the presence of moderate to severe hepatic steatosis. One major limitation of Xe-133 scan is that it detects only fat, so it is not expected to distinguish between simple steatosis and fibrosis. The usefulness of this liver scan in the diagnosis and management of NAFLD has not been well studied.[66]
Diagnostic screening for NAFLD
According to the European Association for the Study of the Liver (EASL) NAFLD guidelines, screening for NAFLD/NASH is not recommended in the general population. However, it is recommended for high-risk groups such as patients with metabolic risk factors and/or well-characterized insulin resistance.[68] On the other hand, the American Association for the Study of Liver Diseases (AASLD) does not recommend screening for NAFLD in adults even in high-risk groups due to uncertainties surrounding diagnostic tests and treatment options, lack of knowledge related to long-term benefits, and cost effectiveness of screening.[69]
CONCLUSION
Currently, the best available diagnostic as well as staging method for both NASH and NAFLD is liver biopsy. Nonetheless, the associated complications and the inaccurate sampling of a liver biopsy make its diagnostic ability of NASH or NAFLD more complicated. Furthermore, problems occur in standardizing the histological staging of NAFLD. Therefore, an assortment of radiologic modalities [Table 1] can be used clinically for monitoring early changes in disease. Table 2 summarizes the diagnostic strategies and screening of hepatic steatosis in NAFLD according to EASL.[53]
Table 1.
Assortment of radiologic modalities
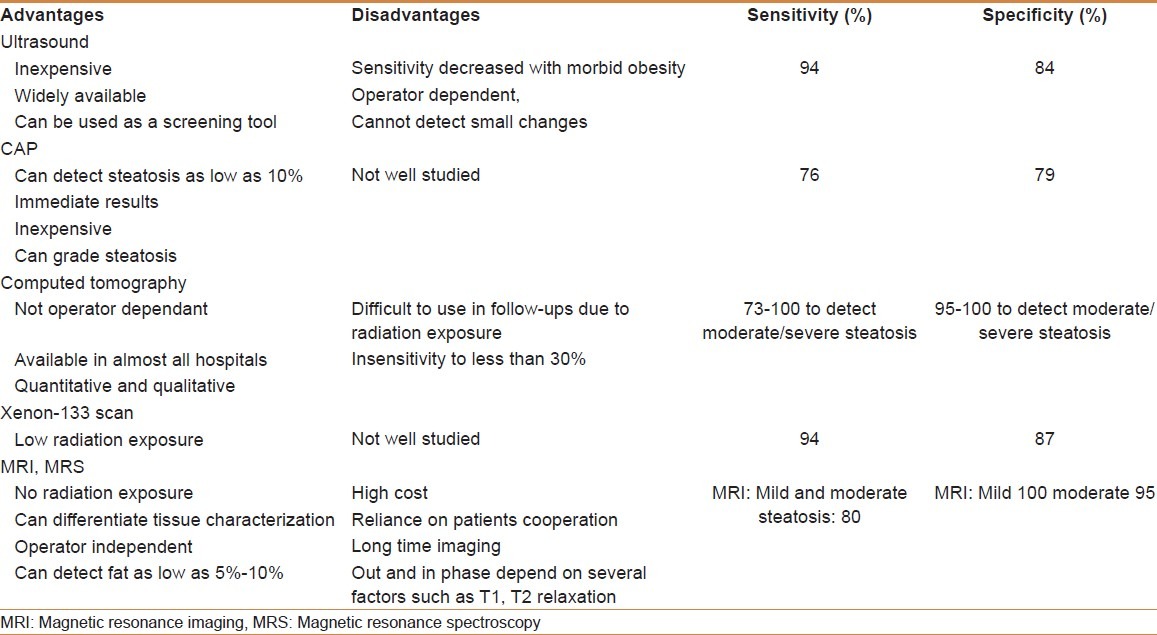
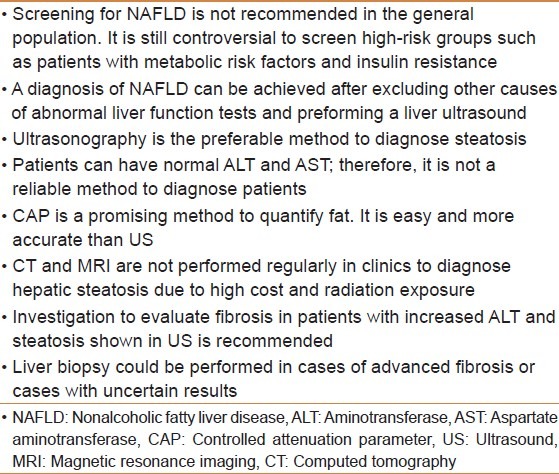
Table 2.
Summary of diagnostic strategies and screening for hepatic steatosis
Footnotes
Source of Support: Nil
Conflict of Interest: None declared.
REFERENCES
- 1.Sanyal AJ, Campbell-Sargent C, Mirshahi F, Rizzo WB, Contos MJ, Sterling RK, et al. Nonalcoholic steatohepatitis: Association of insulin resistance and mitochondrial abnormalities. Gastroenterology. 2001;120:1183–92. doi: 10.1053/gast.2001.23256. [DOI] [PubMed] [Google Scholar]
- 2.McCullough AJ. Epidemiology of the metabolic syndrome in the USA. J Dig Dis. 2011;12:333–40. doi: 10.1111/j.1751-2980.2010.00469.x. [DOI] [PubMed] [Google Scholar]
- 3.Browning JD, Szczepaniak LS, Dobbins R, Nuremberg P, Horton JD, Cohen JC, et al. Prevalence of hepatic steatosis in an urban population in the United States: Impact of ethnicity. Hepatology. 2004;40:1387–95. doi: 10.1002/hep.20466. [DOI] [PubMed] [Google Scholar]
- 4.Cheah WL, Lee PY, Chang CT, Mohamed HJ, Wong SL. Prevalence of ultrasound diagnosed nonalcoholic fatty liver disease among rural indigenous community of Sarawak and its association with biochemical and anthropometric measures. Southeast Asian J Trop Med Public Health. 2013;44:309–17. [PubMed] [Google Scholar]
- 5.Lee SS, Park SH, Kim HJ, Kim SY, Kim MY, Kim DY, et al. Non-invasive assessment of hepatic steatosis: Prospective comparison of the accuracy of imaging examinations. J Hepatol. 2010;52:579–85. doi: 10.1016/j.jhep.2010.01.008. [DOI] [PubMed] [Google Scholar]
- 6.Hamaguchi M, Kojima T, Takeda N, Nagata C, Takeda J, Sarui H, et al. Nonalcoholic fatty liver disease is a novel predictor of cardiovascular disease. World J Gastroenterol. 2007;13:1579–84. doi: 10.3748/wjg.v13.i10.1579. [DOI] [PMC free article] [PubMed] [Google Scholar]
- 7.Francque SM, Verrijken A, Mertens I, Hubens G, Van Marck E, Pelckmans P, et al. Noninvasive assessment of nonalcoholic fatty liver disease in obese or overweight patients. Clin Gastroenterol Hepatol. 2012;10:1162–8. doi: 10.1016/j.cgh.2012.06.019. [DOI] [PubMed] [Google Scholar]
- 8.Prati D, Taioli E, Zanella A, Della Torre E, Butelli S, et al. Updated definitions of healthy ranges for serum alanine aminotransferase levels. Ann Intern Med. 2002;137:1–10. doi: 10.7326/0003-4819-137-1-200207020-00006. [DOI] [PubMed] [Google Scholar]
- 9.Fracanzani AL, Valenti L, Bugianesi E, Andreoletti M, Colli A, Vanni E, et al. Risk of severe liver disease in nonalcoholic fatty liver disease with normal aminotransferase levels: A role for insulin resistance and diabetes. Hepatology. 2008;48:792–8. doi: 10.1002/hep.22429. [DOI] [PubMed] [Google Scholar]
- 10.Terjung B, Lemnitzer I, Dumoulin FL, Effenberger W, Brackmann HH, Sauerbruch T, et al. Bleeding complications after percutaneous liver biopsy. An analysis of risk factors. Digestion. 2003;67:138–45. doi: 10.1159/000071293. [DOI] [PubMed] [Google Scholar]
- 11.Ratziu V, Charlotte F, Heurtier A, Gombert S, Giral P, Bruckert E, et al. Sampling variability of liver biopsy in nonalcoholic fatty liver disease. Gastroenterology. 2005;128:1898–906. doi: 10.1053/j.gastro.2005.03.084. [DOI] [PubMed] [Google Scholar]
- 12.Sumida Y, Nakajima A, Itoh Y. Limitations of liver biopsy and non-invasive diagnostic tests for the diagnosis of nonalcoholic fatty liver disease/nonalcoholic steatohepatitis. World J Gastroenterol. 2014;20:475–85. doi: 10.3748/wjg.v20.i2.475. [DOI] [PMC free article] [PubMed] [Google Scholar]
- 13.Cermelli S, Guo Y, Gross SP, Welte MA. The lipid-droplet proteome reveals that droplets are a protein-storage depot. Curr Biol. 2006;16:1783–95. doi: 10.1016/j.cub.2006.07.062. [DOI] [PubMed] [Google Scholar]
- 14.Chen J, Zhu Y, Zheng Q, Jiang J. Serum cytokeratin-18 in the diagnosis of non-alcoholic steatohepatitis: A meta-analysis. Hepatol Res. 2013;44:854–862. doi: 10.1111/hepr.12197. [DOI] [PubMed] [Google Scholar]
- 15.Mehta SR, Thomas EL, Bell JD, Johnston DG, Taylor-Robinson SD. Non-invasive means of measuring hepatic fat content. World J Gastroenterol. 2008;14:3476–83. doi: 10.3748/wjg.14.3476. [DOI] [PMC free article] [PubMed] [Google Scholar]
- 16.Schwenzer NF, Springer F, Schraml C, Stefan N, Machann J, Schick F. Non-invasive assessment and quantification of liver steatosis by ultrasound, computed tomography and magnetic resonance. J Hepatol. 2009;51:433–45. doi: 10.1016/j.jhep.2009.05.023. [DOI] [PubMed] [Google Scholar]
- 17.Dixon WT. Simple proton spectroscopic imaging. Radiology. 1984;153:189–94. doi: 10.1148/radiology.153.1.6089263. [DOI] [PubMed] [Google Scholar]
- 18.Outwater EK, Blasbalg R, Siegelman ES, Vala M. Detection of lipid in abdominal tissues with opposed-phase gradient-echo images at 1.5 T: Techniques and diagnostic importance. Radiographics. 1998;18:1465–80. doi: 10.1148/radiographics.18.6.9821195. [DOI] [PubMed] [Google Scholar]
- 19.Hatta T, Fujinaga Y, Kadoya M, Ueda H, Murayama H, Kurozumi M, et al. Accurate and simple method for quantification of hepatic fat content using magnetic resonance imaging: A prospective study in biopsy-proven nonalcoholic fatty liver disease. J Gastroenterol. 2010;45:1263–71. doi: 10.1007/s00535-010-0277-6. [DOI] [PubMed] [Google Scholar]
- 20.Mazhar SM, Shiehmorteza M, Sirlin CB. Noninvasive assessment of hepatic steatosis. Clin Gastroenterol Hepatol. 2009;7:135–40. doi: 10.1016/j.cgh.2008.11.023. [DOI] [PMC free article] [PubMed] [Google Scholar]
- 21.Fishbein M, Castro F, Cheruku S, Jain S, Webb B, Gleason T, et al. Hepatic MRI for fat quantitation: Its relationship to fat morphology, diagnosis, and ultrasound. J Clin Gastroenterol. 2005;39:619–25. doi: 10.1097/00004836-200508000-00012. [DOI] [PubMed] [Google Scholar]
- 22.McPherson S, Jonsson JR, Cowin GJ, O'Rourke P, Clouston AD, Volp A, et al. Magnetic resonance imaging and spectroscopy accurately estimate the severity of steatosis provided the stage of fibrosis is considered. J Hepatol. 2009;51:389–97. doi: 10.1016/j.jhep.2009.04.012. [DOI] [PubMed] [Google Scholar]
- 23.Zhong L, Chen JJ, Chen J, Li L, Lin ZQ, Wang WJ, et al. Nonalcoholic fatty liver disease: Quantitative assessment of liver fat content by computed tomography, magnetic resonance imaging and proton magnetic resonance spectroscopy. J Dig Dis. 2009;10:315–20. doi: 10.1111/j.1751-2980.2009.00402.x. [DOI] [PubMed] [Google Scholar]
- 24.Gujar SK, Maheshwari S, Bjorkman-Burtscher I, Sundgren PC. Magnetic resonance spectroscopy. J Neuroophthalmol. 2005;25:217–26. doi: 10.1097/01.wno.0000177307.21081.81. [DOI] [PubMed] [Google Scholar]
- 25.Abrigo JM, Shen J, Wong VW, Yeung DK, Wong GL, Chim AM, et al. Non-alcoholic fatty liver disease: Spectral patterns observed from an in vivo phosphorus magnetic resonance spectroscopy study. J Hepatol. 2014;60:809–15. doi: 10.1016/j.jhep.2013.11.018. [DOI] [PubMed] [Google Scholar]
- 26.Idilman IS, Aniktar H, Idilman R, Kabacam G, Savas B, Elhan A, et al. Hepatic steatosis: Quantification by proton density fat fraction with MR imaging versus liver biopsy. Radiology. 2013;267:767–75. doi: 10.1148/radiol.13121360. [DOI] [PubMed] [Google Scholar]
- 27.Koteish A, Diehl AM. Animal models of steatosis. Semin Liver Dis. 2001;21:89–104. doi: 10.1055/s-2001-12932. [DOI] [PubMed] [Google Scholar]
- 28.Andersen T, Gluud C, Franzmann MB, Christoffersen P. Hepatic effects of dietary weight loss in morbidly obese subjects. J Hepatol. 1991;12:224–9. doi: 10.1016/0168-8278(91)90942-5. [DOI] [PubMed] [Google Scholar]
- 29.Zelber-Sagi S, Lotan R, Shlomai A, Webb M, Harrari G, Buch A, et al. Predictors for Incidence and Remission of NAFLD in the General Population During a Seven-Year Prospective Follow-Up. J Hepatol. 2012;56:1145–51. doi: 10.1016/j.jhep.2011.12.011. [DOI] [PubMed] [Google Scholar]
- 30.Kim HJ, Lee KE, Kim DJ, Kim SK, Ahn CW, Lim SK, et al. Metabolic significance of nonalcoholic fatty liver disease in nonobese, nondiabetic adults. Arch Intern Med. 2004;164:2169–75. doi: 10.1001/archinte.164.19.2169. [DOI] [PubMed] [Google Scholar]
- 31.Angulo P, Keach JC, Batts KP, Lindor KD. Independent predictors of liver fibrosis in patients with nonalcoholic steatohepatitis. Hepatology. 1999;30:1356–62. doi: 10.1002/hep.510300604. [DOI] [PubMed] [Google Scholar]
- 32.Frantzides CT, Carlson MA, Moore RE, Zografakis JG, Madan AK, Puumala S, et al. Effect of body mass index on nonalcoholic fatty liver disease in patients undergoing minimally invasive bariatric surgery. J Gastrointest Surg. 2004;8:849–55. doi: 10.1016/j.gassur.2004.07.001. [DOI] [PubMed] [Google Scholar]
- 33.Cornier MA, Despres JP, Davis N, Grossniklaus DA, Klein S, Lamarche B, et al. American Heart Association Obesity Committee of the Council on Nutrition; Physical Activity and Metabolism; Council on Arteriosclerosis; Thrombosis and Vascular Biology; Council on Cardiovascular Disease in the Young; Council on Cardiovascular Radiology and Intervention; Council on Cardiovascular Nursing, Council on Epidemiology and Prevention; Council on the Kidney in Cardiovascular Disease, and Stroke Council. Assessing Adiposity: A Scientific Statement From the American Heart Association. Circulation. 2011;124:1996–2019. doi: 10.1161/CIR.0b013e318233bc6a. [DOI] [PubMed] [Google Scholar]
- 34.Logue E, Smucker WD, Bourguet CC. Identification of obesity: Waistlines or weight. Nutrition, Exercise, and Obesity Research Group? J Fam Pract. 1995;41:357–63. [PubMed] [Google Scholar]
- 35.Zheng RD, Chen ZR, Chen JN, Lu YH, Chen J. Role of Body Mass Index, Waist-to-Height and Waist-to-Hip Ratio in Prediction of Nonalcoholic Fatty Liver Disease. Gastroenterol Res Pract. 2012;2012:362147. doi: 10.1155/2012/362147. [DOI] [PMC free article] [PubMed] [Google Scholar]
- 36.Poynard T, Ratziu V, Naveau S, Thabut D, Charlotte F, Messous D, et al. The diagnostic value of biomarkers (SteatoTest) for the prediction of liver steatosis. Comp Hepatol. 2005;4:10. doi: 10.1186/1476-5926-4-10. [DOI] [PMC free article] [PubMed] [Google Scholar]
- 37.Lassailly G, Caiazzo R, Hollebecque A, Buob D, Leteurtre E, Arnalsteen L, et al. Validation of noninvasive biomarkers (FibroTest, SteatoTest, and NashTest) for prediction of liver injury in patients with morbid obesity. Eur J Gastroenterol Hepatol. 2011;23:499–506. doi: 10.1097/MEG.0b013e3283464111. [DOI] [PubMed] [Google Scholar]
- 38.Bedogni G, Bellentani S, Miglioli L, Masutti F, Passalacqua M, Castiglione A, et al. The Fatty Liver Index: A simple and accurate predictor of hepatic steatosis in the general population. BMC Gastroenterol. 2006;6:33. doi: 10.1186/1471-230X-6-33. [DOI] [PMC free article] [PubMed] [Google Scholar]
- 39.Zelber-Sagi S, Webb M, Assy N, Blendis L, Yeshua H, Leshno M, et al. Comparison of fatty liver index with noninvasive methods for steatosis detection and quantification. World J Gastroenterol. 2013;19:57–64. doi: 10.3748/wjg.v19.i1.57. [DOI] [PMC free article] [PubMed] [Google Scholar]
- 40.Palmentieri B, de Sio I, La Mura V, Masarone M, Vecchione R, Bruno S, et al. The role of bright liver echo pattern on ultrasound B-mode examination in the diagnosis of liver steatosis. Dig Liver Dis. 2006;38:485–9. doi: 10.1016/j.dld.2006.03.021. [DOI] [PubMed] [Google Scholar]
- 41.Saverymuttu SH, Joseph AE, Maxwell JD. Ultrasound scanning in the detection of hepatic fibrosis and steatosis. Br Med J (Clin Res Ed) 1986;292:13–5. doi: 10.1136/bmj.292.6512.13. [DOI] [PMC free article] [PubMed] [Google Scholar]
- 42.Quinn SF, Gosink BB. Characteristic sonographic signs of hepatic fatty infiltration. AJR Am J Roentgenol. 1985;145:753–5. doi: 10.2214/ajr.145.4.753. [DOI] [PubMed] [Google Scholar]
- 43.Jimba S, Nakagami T, Takahashi M, Wakamatsu T, Hirota Y, Iwamoto Y, et al. Prevalence of non-alcoholic fatty liver disease and its association with impaired glucose metabolism in Japanese adults. Diabet Med. 2005;22:1141–5. doi: 10.1111/j.1464-5491.2005.01582.x. [DOI] [PubMed] [Google Scholar]
- 44.Saadeh S, Younossi ZM, Remer EM, Gramlich T, Ong JP, Hurley M, et al. The utility of radiological imaging in nonalcoholic fatty liver disease. Gastroenterology. 2002;123:745–50. doi: 10.1053/gast.2002.35354. [DOI] [PubMed] [Google Scholar]
- 45.Wu J, You J, Yerian L, Shiba A, Schauer PR, Sessler DI. Prevalence of liver steatosis and fibrosis and the diagnostic accuracy of ultrasound in bariatric surgery patients. Obes Surg. 2012;22:240–7. doi: 10.1007/s11695-011-0509-8. [DOI] [PubMed] [Google Scholar]
- 46.Ryan CK, Johnson LA, Germin BI, Marcos A. One hundred consecutive hepatic biopsies in the workup of living donors for right lobe liver transplantation. Liver Transpl. 2002;8:1114–22. doi: 10.1053/jlts.2002.36740. [DOI] [PubMed] [Google Scholar]
- 47.Dasarathy S, Dasarathy J, Khiyami A, Joseph R, Lopez R, McCullough AJ. Validity of real time ultrasound in the diagnosis of hepatic steatosis: A prospective study. J Hepatol. 2009;51:1061–7. doi: 10.1016/j.jhep.2009.09.001. [DOI] [PMC free article] [PubMed] [Google Scholar]
- 48.Joseph AE, Saverymuttu SH, al-Sam S, Cook MG, Maxwell JD. Comparison of liver histology with ultrasonography in assessing diffuse parenchymal liver disease. Clin Radiol. 1991;43:26–31. doi: 10.1016/s0009-9260(05)80350-2. [DOI] [PubMed] [Google Scholar]
- 49.Mehta SR, Thomas EL, Bell JD, Johnston DG, Taylor-Robinson SD. Non-invasive means of measuring hepatic fat content. World J Gastroenterol. 2008;14:3476–83. doi: 10.3748/wjg.14.3476. [DOI] [PMC free article] [PubMed] [Google Scholar]
- 50.Osawa H, Mori Y. Sonographic diagnosis of fatty liver using a histogram technique that compares liver and renal cortical echo amplitudes. J Clin Ultrasound. 1996;24:25–9. doi: 10.1002/(SICI)1097-0096(199601)24:1<25::AID-JCU4>3.0.CO;2-N. [DOI] [PubMed] [Google Scholar]
- 51.Webb M, Yeshua H, Zelber-Sagi S, Santo E, Brazowski E, Halpern Z, et al. Diagnostic value of a computerized hepatorenal index for sonographic quantification of liver steatosis. AJR Am J Roentgenol. 2009;192:909–14. doi: 10.2214/AJR.07.4016. [DOI] [PubMed] [Google Scholar]
- 52.Borges VF, Diniz AL, Cotrim HP, Rocha HL, Andrade NB. Sonographic hepatorenal ratio: A noninvasive method to diagnose nonalcoholic steatosis. J Clin Ultrasound. 2013;41:18–25. doi: 10.1002/jcu.21994. [DOI] [PubMed] [Google Scholar]
- 53.Marshall RH, Eissa M, Bluth EI, Gulotta PM, Davis NK. Hepatorenal index as an accurate, simple, and effective tool in screening for steatosis. AJR Am J Roentgenol. 2012;199:997–1002. doi: 10.2214/AJR.11.6677. [DOI] [PubMed] [Google Scholar]
- 54.Sandrin L, Fourquet B, Hasquenoph JM, Yon S, Fournier C, Mal F, et al. Transient elastography: A new noninvasive method for assessment of hepatic fibrosis. Ultrasound Med Biol. 2003;29:1705–13. doi: 10.1016/j.ultrasmedbio.2003.07.001. [DOI] [PubMed] [Google Scholar]
- 55.Ziol M, Kettaneh A, Ganne-Carrie N, Barget N, Tengher-Barna I, Beaugrand M. Relationships between fibrosis amounts assessed by morphometry and liver stiffness measurements in chronic hepatitis or steatohepatitis. Eur J Gastroenterol Hepatol. 2009;21:1261–8. doi: 10.1097/MEG.0b013e32832a20f5. [DOI] [PubMed] [Google Scholar]
- 56.Myers RP, Pollett A, Kirsch R, Pomier-Layrargues G, Beaton M, Levstik M, et al. Controlled Attenuation Parameter (CAP): A noninvasive method for the detection of hepatic steatosis based on transient elastography. Liver Int. 2012;32:902–10. doi: 10.1111/j.1478-3231.2012.02781.x. [DOI] [PubMed] [Google Scholar]
- 57.de Ledinghen V, Vergniol J, Foucher J, Merrouche W, le Bail B. Non-invasive diagnosis of liver steatosis using controlled attenuation parameter (CAP) and transient elastography. Liver Int. 2012;32:911–8. doi: 10.1111/j.1478-3231.2012.02820.x. [DOI] [PubMed] [Google Scholar]
- 58.Sasso M, Beaugrand M, de Ledinghen V, Douvin C, Marcellin P, Poupon R, et al. Controlled attenuation parameter (CAP): A novel VCTE guided ultrasonic attenuation measurement for the evaluation of hepatic steatosis: Preliminary study and validation in a cohort of patients with chronic liver disease from various causes. Ultrasound Med Biol. 2010;36:1825–35. doi: 10.1016/j.ultrasmedbio.2010.07.005. [DOI] [PubMed] [Google Scholar]
- 59.Wong GL. Transient elastography: Kill two birds with one stone? World J Hepatol. 2013;5:264–74. doi: 10.4254/wjh.v5.i5.264. [DOI] [PMC free article] [PubMed] [Google Scholar]
- 60.Fierbinteanu-Braticevici C, Dina I, Petrisor A, Tribus L, Negreanu L, Carstoiu C. Noninvasive investigations for non alcoholic fatty liver disease and liver fibrosis. World J Gastroenterol. 2010;16:4784–91. doi: 10.3748/wjg.v16.i38.4784. [DOI] [PMC free article] [PubMed] [Google Scholar]
- 61.Piekarski J, Goldberg HI, Royal SA, Axel L, Moss AA. Difference between liver and spleen CT numbers in the normal adult: Its usefulness in predicting the presence of diffuse liver disease. Radiology. 1980;137:727–9. doi: 10.1148/radiology.137.3.6934563. [DOI] [PubMed] [Google Scholar]
- 62.Roldan-Valadez E, Favila R, Martinez-Lopez M, Uribe M, Mendez-Sanchez N. Imaging techniques for assessing hepatic fat content in nonalcoholic fatty liver disease. Ann Hepatol. 2008;7:212–20. [PubMed] [Google Scholar]
- 63.Johnston RJ, Stamm ER, Lewin JM, Hendrick RE, Archer PG. Diagnosis of fatty infiltration of the liver on contrast enhanced CT: Limitations of liver-minus-spleen attenuation difference measurements. Abdom Imaging. 1998;23:409–15. doi: 10.1007/s002619900370. [DOI] [PubMed] [Google Scholar]
- 64.Park SH, Kim PN, Kim KW, Lee SW, Yoon SE, Park SW, et al. Macrovesicular hepatic steatosis in living liver donors: Use of CT for quantitative and qualitative assessment. Radiology. 2006;239:105–12. doi: 10.1148/radiol.2391050361. [DOI] [PubMed] [Google Scholar]
- 65.Kan H, Kimura Y, Hyogo H, Fukuhara T, Fujino H, Naeshiro N, et al. Non-invasive assessment of liver steatosis in non-alcoholic fatty liver disease. Hepatol Res. 2014;44(14):E420–7. doi: 10.1111/hepr.12330. [DOI] [PubMed] [Google Scholar]
- 66.Al-Busafi SA, Ghali P, Wong P, Novales-Diaz JA, Deschenes M. The utility of Xenon-133 liver scan in the diagnosis and management of nonalcoholic fatty liver disease. Can J Gastroenterol. 2012;26:155–9. doi: 10.1155/2012/796313. [DOI] [PMC free article] [PubMed] [Google Scholar]
- 67.Kitani K, Winkler K. In vitro determination of solubility of 133×enon and 85 Krypton in human liver tissue with varying triglyceride content. Scand J Clin Lab Invest. 1972;29:173–6. doi: 10.3109/00365517209081072. [DOI] [PubMed] [Google Scholar]
- 68.Ratziu V, Bellentani S, Cortez-Pinto H, Day C, Marchesini G. A position statement on NAFLD/NASH based on the EASL 2009 special conference. J Hepatol. 2010;53:372–84. doi: 10.1016/j.jhep.2010.04.008. [DOI] [PubMed] [Google Scholar]
- 69.Chalasani N, Younossi Z, Lavine JE, Diehl AM, Brunt EM, Cusi K, et al. The Diagnosis and Management of Non-alcoholic Fatty Liver Disease: Practice Guideline by the American Gastroenterological Association, American Association for the Study of Liver Diseases, and American College of Gastroenterology. Gastroenterology. 2012;142:1592–609. doi: 10.1053/j.gastro.2012.04.001. [DOI] [PubMed] [Google Scholar]