

Abstract
Importance
Although previous reports have linked preterm birth with insulin resistance in children and adults, it is not known whether altered insulin homeostasis is detectable at birth and tracks from birth onwards.
Objective
To investigate whether preterm birth is associated with elevated plasma insulin levels at birth and whether this association persists into early childhood.
Design, Setting, and Participation
A prospective birth cohort of 1358 children recruited at birth from 1998 to 2010 and followed prospectively from 2005 to 2012 at the Boston Medical Center, Boston, MA.
Main Outcome Measures
Random plasma insulin levels were measured at two time points: at birth (cord blood) and in early childhood (venous blood) (median age (25th–75th percentile): 1.4 (0.8–3.3) years) among four gestational age groups: term (≥37 weeks), and further grouped into full term (≥39 weeks) and early term (37–38 weeks); preterm (<37 weeks), and further grouped into late preterm (34–36 weeks) and early preterm (<34 weeks).
Results
The geometric mean (95% confidence interval(CI)) of insulin levels for full term, early term, late preterm and early preterm births was 9.2(8.4–10.0), 10.3(9.3–11.5), 13.2(11.8–14.8) and 18.9(16.6–21.4) µU/ml, respectively at birth, and 11.2(10.3–12.0), 12.4(11.3–13.6), 13.3(11.9–14.8) and 14.6(12.6–16.9) µU/ml, respectively in early childhood. At birth, insulin levels were 1.13(95% CI: 0.97–1.28), 1.45(95%CI: 1.25–1.65) and 2.05(95%CI: 1.69–2.42) folds higher for early term, late preterm and early preterm, respectively, than those born full term. In early childhood, plasma random insulin levels in those born early term, late preterm and early preterm were 1.12(95%CI: 0.99–1.25), 1.19(95%CI: 1.02–1.35), and 1.31(95%CI: 1.10–1.52) folds higher, respectively, than those born full term. The association was attenuated after adjustment for postnatal weight gain and was not significant after adjustment for insulin levels at birth. Children ranked in the top insulin tertile at birth were more likely to remain in the top tertile in early childhood relative to children ranked in the lowest tertile (41.2% vs. 28.6%).
Conclusion and Relevance
There was an inverse association between gestational age and elevated plasma insulin levels at birth and in early childhood. The implications for future development of insulin resistance and type 2 diabetes warrant further investigation.
INTRODUCTION
In the U.S., preterm birth affects 1 in 9 live births and 1 in 5 amongst African American infants.1 In contrast to the well-established association between term low birthweight and adult diseases, much less is known about the role of preterm birth in the development of later chronic diseases. Such information is needed in light of the growing population burden of preterm birth as a result of persistently high rates of preterm birth and improved survival rates of babies born preterm in the U.S.2 Available studies have linked preterm birth to insulin resistance3–7 and type 2 diabetes in childhood,3 young adulthood,4,5 and middle-adulthood.6,8
This study intends to fill the knowledge gap on preterm birth and metabolic risk during early developmental periods. The in utero and early childhood periods are critical windows for growth, development, imprinting, and the establishment of an epigenome, and are highly sensitive to environmental perturbation. There is growing evidence that fetal and early life events may result in permanent metabolic alterations, such as type 2 diabetes and metabolic syndrome.9–12 While available studies in children and adults support the hypothesis that preterm birth may result in adverse metabolic alterations, it is unclear whether the observed association between preterm birth, later insulin resistance and type 2 diabetes stems from alterations in insulin metabolism during the in utero period or early childhood.
This study used a prospective birth cohort enriched by a spectrum of preterm births, and tested the hypothesis that preterm birth is associated with elevated plasma insulin levels (indirect evidence of insulin resistance) at birth, and that elevated insulin levels persist into early childhood, defined for this study as the period from birth to age 6.5 years.
METHODS
As illustrated in Figure 1, this study included 1358 children from the Boston Birth Cohort (BBC) who were recruited at birth (from 1998 to 2010), followed prospectively from 2005 to 2012, and had plasma insulin measurement at birth or during postnatal follow-up (age range: 0.5 to 6.5 years, median (25th–75th percentile): 1.4 (0.8–3.3) years). As detailed in our previous report,13 the BBC, initiated in 1998 and using a rolling enrollment, targeted all mothers who delivered singleton live preterm (<37 weeks) or low birthweight (<2500grams) infants (cases), and matched term (≥37 weeks) normal birthweight (>2500 grams) controls by maternal age and parity, with a case:control ratio of 1:2, enriching the BBC with preterm births. The exclusion criteria for initial enrollment included multiple-gestation pregnancies (eg, twins, triplets) and newborns with major birth defects. Since 2003, the subset of the BBC that continued to receive pediatric care at the Boston Medical Center has been followed from birth onwards. The exclusion criteria for the follow-up included (1) not enrolled in the original birth cohort; or (2) did not plan to receive pediatric care at Boston Medical Center. The cohort participation rate was >90% for initial enrollment and postnatal follow-up among eligible participants approached by the research staff. Of 2870 children who were eligible for postnatal follow-up, 1512 were excluded from this analysis for the following reasons: 228 refused to participate in the follow-up study; 1183 had insufficient blood samples; 101 had insulin measured at age >6.5 years (to eliminate potential confounding due to adrenarche or puberty). This study included 1358 children for whom maternal demographic characteristics and birth outcomes were comparable to the total eligible for postnatal follow-up, as well as to the entire BBC (eTable1). Written informed consent was obtained from the mothers. The study protocol was approved by the Institutional Review Boards of Boston University Medical Center, the Ann & Robert H. Lurie Children’s Hospital of Chicago (formerly Children’s Memorial Hospital of Chicago), and the Johns Hopkins Bloomberg School of Public Health.
Figure 1.

Flow Chart of Initial Enrollment and Postnatal Follow-up of the Boston Birth Cohort and the Sample Included in the Analysis
a FT: full term; ET: early term; LP: late preterm; EP: early preterm; Eligible mother-infant pairs were those who delivered a singleton live birth at the Boston Medical Center. Multiple-gestation pregnancies (e.g., twins, triplets) or newborns with major birth defects were excluded.
b BMC: Boston Medical Center;c Early childhood: age range: 0.5–6.5 years, median (25tn–75th percentile): 1.4 (0.8–3.3) years.
Definition of maternal and perinatal characteristics
The following maternal variables were defined based on a standard maternal questionnaire interview: Race/ethnicity was based on maternal response to fixed categories in the questionnaire, and classified as Black, Hispanic, White, or other. The race/ethnicity was treated as a confounder due to a well-observed racial disparity in preterm births and diabetes (Black populations have higher rates of preterm birth and diabetes in the U.S.).1,14 Pre-pregnancy body mass index (BMI) was calculated as weight (kg)/height (m2), based on pre-pregnancy height and weight.15 Maternal smoking during pregnancy was classified into 3 groups: never smoker (did not smoke cigarettes throughout index pregnancy), quitter (only smoked in the 3 months before pregnancy or during the first trimester), or continuous smoker (smoked continuously from prepregnancy to delivery).13 Perceived stress during pregnancy was defined based on the responses to the following question: “How would you characterize the amount of stress in your life during pregnancy?” Answers of “not stressful” and “average stressful” were coded as low stress, and “very stressful” was coded as high stress.16
The following maternal variables were defined based on maternal medical records: Maternal diabetes was defined as having either gestational or pre-gestational diabetes;17 hypertensive disorders included one or more of the following during pregnancy: preeclampsia, eclampsia, chronic hypertension, and HELLP syndrome (hemolysis, elevated liver enzymes, and low platelets).16 Mode of delivery was categorized into caesarean section or vaginal delivery.
Definition of gestational age, birthweight for gestational age and Apgar scores
All the following variables are based on medical records. Gestational age was assessed based on both the first day of the last menstrual period and using early prenatal ultrasonographic results, as described previously.13 Preterm birth is defined as gestational age <37 weeks, and further grouped into late preterm (34–36 weeks of gestation) and early preterm (<34 weeks of gestation). To improve health outcomes for newborns and limit unnecessary early deliveries, the American College of Obstetricians and Gynecologists and the Society for Maternal-Fetal Medicine recently revised the classification system for term birth.18 Accordingly, term birth is defined as ≥37 weeks of gestation, and further grouped into early term (37–38 weeks) and full term (≥39 weeks).
Birthweight for gestational age is categorized into three groups: small for gestational age (SGA; <10th percentile), large for gestational age (LGA; >90th percentile), and appropriate for gestational age (AGA; 10th to 90th percentile) according to an established local gender- and race-specific reference population.19 Apgar scores at 1 and 5 minutes were coded into three groups: 0–4, 5–7 and 8–10.20 Antenatal steroid intake was coded as none vs. at least one dose.21
Assessment of postnatal growth, adiposity and breastfeeding
Height, length and weight were abstracted from the child’s medical records. BMI was calculated based on weight, height/length, and converted to age- and sex-specific BMI z-scores based on the World Health Organization (WHO) growth chart22 for children under 2 years of age. BMI z-scores for children older than 2 and weight-for-age z-scores were calculated using U.S. national reference data.23 Weight gain in the first year of life is defined as the change in weight-for-age z-score between birth and the first year of life, and then categorized into 2 groups: rapid weight gain (>0.67) and non-rapid weight gain (≤0.67).24 Plasma leptin levels were used as a proxy for total body adiposity.25–27 Information on infant feeding was obtained using a standardized postnatal follow-up questionnaire, and categorized into 3 groups: (1) exclusively formula-fed, (2) exclusively breast-fed, or (3) both.28
Assays of plasma insulin and leptin
Umbilical cord blood was collected at delivery, and postnatal venous blood was collected at follow-up visits. Plasma was stored in an −80°C freezer. Plasma insulin levels were measured in cord blood at birth, and in the first available postnatal venous blood sample (age range: 0.5 to 6.5 years, median (25th–75th percentile): 1.4 (0.8–3.3) years). Plasma insulin and leptin levels were measured using a sandwich immunoassay based on flow metric xMAP technology on a Luminex 200 platform (Luminex multianalyte profiling system; Luminex, Corp., Austin, TX) with an inter-assay coefficient of variation of 4.0%, and 4.5%, respectively. The immunoassay kit was obtained commercially from Millipore Corp (Bedford, MA). Each sample was run in duplicate, and the intra-assay coefficients of variation for insulin and leptin were 4.3%.
Statistical analysis
The primary outcomes of interest were plasma insulin levels at birth and in early childhood. We used locally weighted regression smoothing plots (PROC LOESS; SAS v.9.3) to explore the relationship between gestational age and plasma insulin levels at birth as well as tracking of plasma insulin levels from birth to early childhood. Linear regression models were applied to estimate the crude and adjusted associations between gestational age groups (X, independent variables) and log-transformed insulin levels at birth and in early childhood (Y, dependent variables). To make the results easy to interpret, all of the regression coefficients were exponentiated (exp(β)), and represent the point estimate of the fold change of Y on the original scale, for the specific gestational age groups (early term; late preterm; early preterm) compared to the full term group (reference group). The variance and standard deviation (SD) of the fold change of Y were calculated based on Delta methods29 and the 95% confidence interval (CI) of the fold change of Y were calculated as exp(β) +/− 1.96 *SD. Both exp(β) and the corresponding 95%CI were reported. All P-values for linear trend were based on models using gestational age as a continuous variable. Those associations with P-values (two-sided tests) <0.05 were regarded as statistically significant. The adjusted models included pertinent covariables, including maternal race, parity, smoking, antenatal steroid use, gestational or pre-gestational diabetes; also child’s sex, Apgar score at 1 minute, birthweight for gestational age, hour-of-day at the study visit, plasma leptin (at the same time point as insulin), age at measurement, rapid weight gain in the first year of life, and insulin level at birth. These covariables were chosen based on previous literature and multiple stepwise regression analysis (with stepping method criteria: probability of F to enter≤0.05 and remove ≥0.10). All statistical analyses were performed using SAS v.9.3 (SAS Institute Inc., Cary, NC, USA).
RESULTS
Of the 1358 children included in the analysis, 418 were born preterm (162 early preterm, 256 late preterm), and 940 were born at term (343 early term and 597 full term). 1117 had insulin measured at birth, 1026 had insulin measured in early childhood, and 785 had insulin measured at both time points (Figure 1). Maternal and infant characteristics by gestational age groups are presented in Table 1. Maternal smoking, diabetes, hypertensive disorders, Caesarean section and antenatal steroid use were more prevalent in preterm births. Preterm infants experienced a much higher proportion of rapid weight gain in the first year of life compared with term infants (84.4% vs. 27.6%). The geometric mean (95%CI) of insulin levels for full term, early term, late preterm and early preterm births were 9.2 (8.4–10.0), 10.3 (9.3–11.5), 13.2 (11.8–14.8) and 18.9 (16.6–21.4) µU/ml, respectively at birth, and 11.2 (10.3–12.0), 12.4 (11.3–13.6), 13.3 (11.9–14.8) and 14.6 (12.6–16.9) µU/ml respectively in early childhood.
Table 1.
The characteristics of study participants stratified by gestational age groups, as defined by The American College of Obstetricians and Gynecologists and the Society for Maternal-Fetal Medicine.(n=1358)a
| Gestational age group | |||||
|---|---|---|---|---|---|
| Term | Preterm | ||||
| Variable | Full term ≥39wks |
Early term 37–38wks |
Late preterm 34–36wks |
Early preterm <34wks |
|
| Maternal characteristics | P value | ||||
| No. | 597 | 343 | 256 | 162 | |
| Age at enrollment, No. (%) | |||||
| ≤20 years | 57(9.5) | 31(9.1) | 22(8.6) | 12(7.4 | |
| 21–30 years | 321(53.8) | 161(46.9) | 126(49.2) | 82(50.6) | |
| >30 years | 219(36.7) | 151(44.0) | 108(42.2) | 68(42.0) | |
| Prepregnancy BMI, kg/m2 | 26.5±6.2 | 26.3±6.3 | 26.7±6.5 | 26.9±6.4 | 0.70 |
| Education, No. (%) | 0.20 | ||||
| High school and lower | 396(66.3) | 208(60.6) | 173(67.6) | 110(67.9) | |
| College degree and higher | 201(33.7) | 135(39.4) | 83(32.4) | 52(32.1) | |
| Race, No. (%) | 0.47 | ||||
| Black | 344(57.6) | 213(62.1) | 151(59.0) | 103(63.6) | |
| Hispanic | 127(21.3) | 72(21.0) | 62(24.2) | 34(21.0) | |
| White | 39(6.5) | 19(5.5) | 19(7.4) | 7(4.3) | |
| Other | 87(14.6) | 39(11.4) | 24(9.4) | 18(11.1) | |
| Parity, No. (%) | 0.11 | ||||
| Nulliparous | 264(44.2) | 126(36.7) | 101(39.4) | 61(37.6) | |
| Multiparous | 333(55.8) | 217(63.3) | 155(60.6) | 101(62.4) | |
| Perceived stress during Pregnancy, No. (%) | 0.19 | ||||
| Low stress | 494(82.7) | 269(78.4) | 198(77.3) | 127(78.4) | |
| High stress | 103(17.3) | 74(21.6) | 58(22.7) | 35(21.6) | |
| Smoking, No. (%) | 0.02 | ||||
| Never smoker | 509(85.3) | 290(84.6) | 195(76.2) | 128(79.0) | |
| Quitter | 40(6.7) | 20(5.8) | 22(8.6) | 15(9.3) | |
| Continuous smoker | 48(8.0) | 33(9.6) | 39(15.2) | 19(11.7) | |
| Antenatal steroids use, No. (%) | <0.001 | ||||
| None | 586(98.2) | 332(96.8) | 221(86.3) | 28(17.3) | |
| ≥1 dose | 11(1.8) | 11(3.2) | 35(13.7) | 134(82.7) | |
| Pre-gestational/ gestational Diabetes, No. (%) | 0.001 | ||||
| No | 567(95.0) | 310(90.4) | 223(87.1) | 146(90.1) | |
| Yes | 30(5.0) | 33(9.6) | 33(12.9) | 16(9.9) | |
| Hypertensive disorder, No. (%) | <0.001 | ||||
| No | 565(94.6) | 293(85.4) | 200(78.1) | 103(63.6) | |
| Yes | 32(5.4) | 50(14.6) | 56(21.9) | 59(36.4) | |
| Child birth variables | |||||
| Gender, No. (%) | 0.31 | ||||
| Male | 301(50.4) | 168(49.0) | 140(54.7) | 74(45.7) | |
| Female | 296(49.6) | 175(51.0) | 116(45.3) | 88(54.3) | |
| Mode of delivery, No. (%) | <0.001 | ||||
| Vaginal delivery | 423(70.9) | 221(64.4) | 164(64.1) | 73(45.1) | |
| Cesarean section | 174(29.1) | 122(35.6) | 92(35.9) | 89(54.9) | |
| Gestational age at birth, week | 40.2±0.8 | 38.0±0.6 | 35.7±0.9 | 30.0±3.0 | <0.001 |
| Birthweight, g | 3414±478 | 2962±503 | 2588±511 | 1430±552 | <0.001 |
| Apgar score at 1 minute, No. (%) | <0.001 | ||||
| 0–4 | 24(4.0) | 17(5.0) | 14(5.5) | 45(27.8) | |
| 5–7 | 77(12.9) | 45(13.1) | 60(23.4) | 76(46.9) | |
| 8–10 | 476(79.7) | 272(79.3) | 180(70.3) | 41(25.3) | |
| Missing data | 20(3.4) | 9(2.6) | 2(0.8) | 0(0.0) | |
| Apgar score at 5 minutes, No. (%) | <0.001 | ||||
| 0–4 | 1(0.2) | 2(0.6) | 3(1.2) | 8(4.9) | |
| 5–7 | 14(2.4) | 10(2.9) | 19(7.4) | 62(38.3) | |
| 8–10 | 562(94.1) | 322(93.9) | 232(90.6) | 92(56.8) | |
| Missing data | 20(3.3) | 9(2.6) | 2(0.8) | 0(0.0) | |
| Birthweight for gestational age, No. (%) | <0.001 | ||||
| SGA | 79(13.2) | 89(25.9) | 42(16.4) | 19(11.7) | |
| AGA | 465(77.9) | 231(67.4) | 195(76.2) | 138(85.2) | |
| LGA | 53(8.9) | 23(6.7) | 19(7.4) | 5(3.1) | |
| Insulin, µU/ml c | 9.2 (8.4–10.0) | 10.3 (9.3–11.5) | 13.2 (11.8–14.8) | 18.9 (16.6–21.4) | <0.001 |
| Leptin, ng/ml c | 26.8 (24.3–29.6) | 22.2 (19.5–25.3) | 13.3 (11.4–15.5) | 4.4 (3.4–5.7) | <0.001 |
| Child postnatal variablesb | |||||
| No. | 452 | 257 | 192 | 125 | |
| Age at follow-up, years | 2.2±1.7 | 2.1±1.7 | 2.2±1.6 | 2.2±1.7 | 0.78 |
| Breastfed, No. (%) | 0.30 | ||||
| Exclusively formula | 102(22.6) | 60(23.3) | 55(28.6) | 37(29.6) | |
| Exclusively breast-fed | 12(2.6) | 3(1.2) | 4(2.1) | 1(0.8) | |
| Both | 338(74.8) | 194(75.5) | 133(69.3) | 87(69.6) | |
| Monthly weight gain in the first year, kg | 0.59±0.13 | 0.60±0.20 | 0.66±0.18 | 0.65±0.12 | <0.001 |
| Weight gain in the first year, z-score | 0.10±1.11 | 0.61±1.34 | 1.27±1.45 | 1.99±1.15 | <0.001 |
| Rapid weight gain in first year, No. (%) | <0.001 | ||||
| Non-rapid | 296(65.5) | 138(53.7) | 59(30.7) | 13(10.4) | <0.001 |
| Rapid | 125(27.6) | 108(42.0) | 117(61.0) | 106(84.8) | |
| Missing data | 31(6.9) | 11(4.3) | 16(8.3) | 6(4.8) | |
| BMI, kg/m2 | 17.2±2.2 | 17.2±2.5 | 17.1±2.2 | 16.8±1.9 | 0.32 |
| BMI, z-score | 0.51±1.25 | 0.44±1.36 | 0.42±1.32 | 0.24±1.27 | 0.26 |
| The hour-of -day at the study visit, No. (%) | 0.21 | ||||
| Before 9:00am | 22(4.9) | 9(3.5) | 7(3.7) | 10(8.0) | |
| 9:01am–12:00noon | 195(43.1) | 106(41.3) | 91(47.4) | 62(49.6) | |
| 12:01–2:00pm | 66(14.6) | 45(17.5) | 40(20.8) | 15(12.0) | |
| 2:01–4:00pm | 147(32.5) | 80(31.1) | 48(25.0) | 32(25.6) | |
| After 4:00pm | 19(4.2) | 16(6.2) | 6(3.1) | 6(4.8) | |
| Missing data | 3(0.7) | 1(0.4) | 0(0.0) | 0(0.0) | |
| Insulin, µU/mld | 11.2 (10.3–12.0) | 12.4 (11.3–13.6) | 13.3 (11.9–14.8) | 14.6 (12.6–16.9) | 0.003 |
| Leptin, ng/mld | 2.2 (2.0–2.4) | 2.3 (2.0–2.6) | 2.1 (1.8–2.5) | 2.3 (1.9–2.8) | 0.81 |
Data are reported as Mean±SD or No. (%) unless otherwise indicated; Gestational age groups were based on the classification of American College of Obstetricians and Gynecologists and the Society for Maternal-Fetal Medicine; SGA, small for gestational age; AGA, appropriate for gestational age; LGA, large for gestational age; BMI; body mass index.
BMI z-score was calculated to correct for child’s age and sex, and 14 were missing; Weight gain z-score in the first year of life was defined as the change in weight z-score from birth to during first year of life; Rapid weight gain was defined as weight gain z-score of more than 0.67.
Data are reported as geometric mean (95%CI), and n=1117.
Data are reported as geometric mean (95%CI), and n=1026.
The association between gestational age and plasma insulin levels at birth
As shown in Figure 2, cord blood insulin levels were inversely associated with gestational age, regardless of birthweight for gestational age. This association was further quantified by regression models (Table 2): as compared to full term, cord blood insulin levels were 1.13 (95% CI: 0.97–1.28), 1.45 (95%CI: 1.25–1.65) and 2.05 (95%CI: 1.69–2.42) folds higher for early term, late preterm, and early preterm, respectively (P-value for linear trend <0.001) (Crude Model). This association remained after adjustment for pertinent covariables, including maternal race, cigarette smoking, parity, diabetes status, antenatal steroids use; also infant’s sex, Apgar score at 1 minute, birthweight for gestational age, and leptin levels at birth. We performed additional analyses by restricting the sample to children with insulin measured both at birth and in early childhood (n=785), and found similar results (eTable 2).
Figure 2.
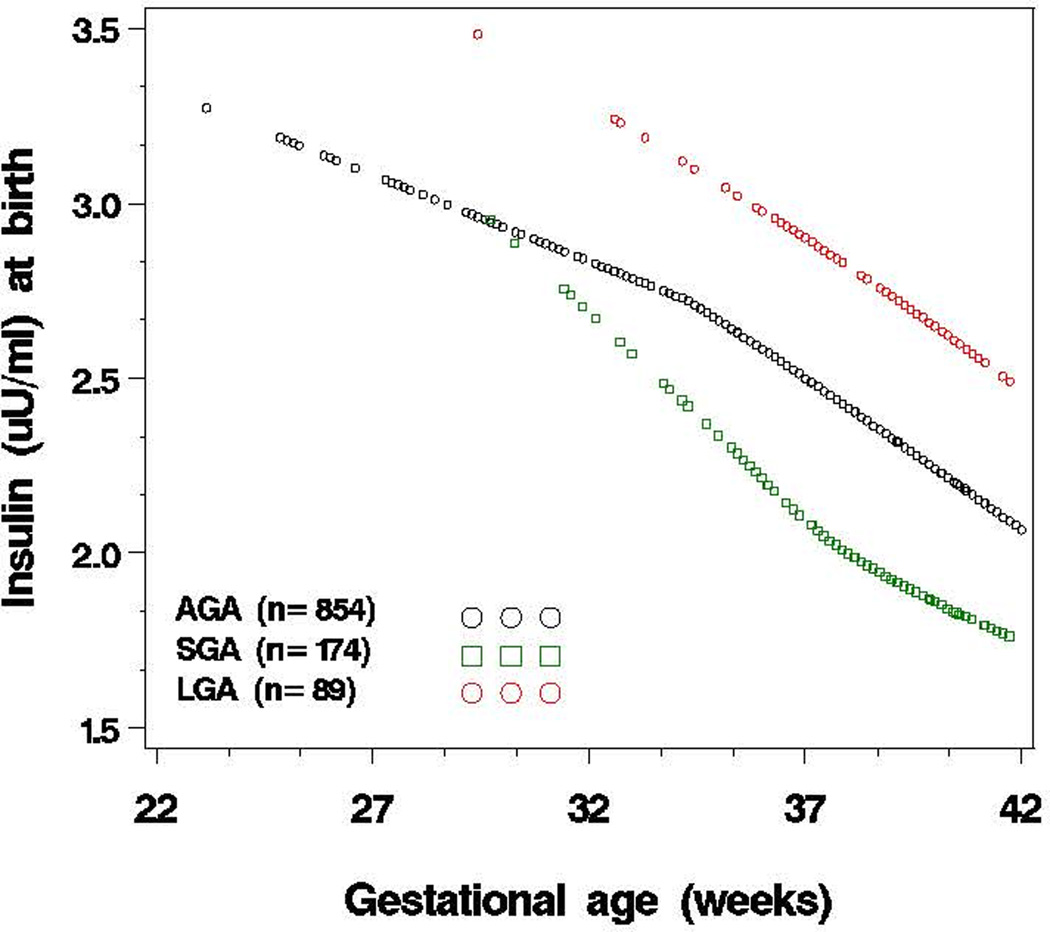
Association of plasma insulin levels at birth with gestational age, stratified by birthweight for gestational age category (SGA, AGA, LGA) (n=1117)a
aY-axis is the mean of logarithmically transformed insulin levels. Birthweight for gestational age was categorized into three groups: small for gestational age (SGA) (birthweight <10th percentile), large for gestational age (LGA) (birthweight ≥90th percentile), and appropriate for gestational age (AGA) (birthweight in the 10th to 90th percentile) according to the local reference population.
Table 2.
Association of Gestational Age Groups with Plasma Insulin Levels at Birth and In Early Childhood in the Boston Birth Cohort
| Gestational Age Groupa | |||||||
|---|---|---|---|---|---|---|---|
| Early Term 37–38 wks |
Late Preterm 36-34 wks |
Early Preterm <34wks |
P for trend |
||||
| Model | exp(β)(95%CI) | P value | exp(β)(95%CI) | P value | exp(β)(95%CI) | P value | |
| At birth (n=1117; FT=499, ET=284, LP=221, EP=113; adjusted R2=0.25) | |||||||
| Crude | 1.13 (0.97–1.28) | 0.07 | 1.45 (1.25–1.65) | <0.001 | 2.05 (1.69–2.42) | <0.001 | <0.001 |
| Adjustedb | 1.16 (1.03–1.30) | 0.01 | 1.60 (1.38–1.82) | <0.001 | 2.51 (1.87–3.15) | <0.001 | <0.001 |
| In early childhood (n=1026; FT=452, ET=257, LP=192, EP=125; adjusted R2=0.11) | |||||||
| Crude | 1.12 (0.99–1.25) | 0.08 | 1.19 (1.02–1.35) | 0.01 | 1.31 (1.10–1.52) | 0.001 | <0.001 |
| Adjustedc | |||||||
| 1 | 1.08 (0.96–1.21) | 0.17 | 1.16 (1.00–1.32) | 0.03 | 1.22 (1.03–1.41) | 0.02 | 0.007 |
| 2 | 1.08 (0.96–1.21) | 0.20 | 1.14 (0.98–1.30) | 0.07 | 1.19 (0.98–1.39) | 0.05 | 0.03 |
| 3 | 1.06 (0.92–1.21) | 0.34 | 1.14 (0.98–1.30) | 0.07 | 1.12 (0.90–1.34) | 0.29 | 0.07 |
Gestational age groups were based on the classification of American College of Obstetricians and Gynecologists and the Society for Maternal-Fetal Medicine; FT, full term; ET, early term; LP, late preterm; EP, early preterm; Full term group was the reference; P values for linear trend were based on models using gestational age as a continuous variable.
At birth: the model adjusted for maternal race, parity, smoking status, gestational and pre-gestational diabetes, antenatal steroids use; also infant sex, birthweight for gestational age, Apgar score at 1min, and leptin levels in cord blood.
In early childhood, Model 1 adjusted for maternal race, parity, smoking status; also infant sex, birthweight for gestational age, Apgar score at 1min, leptin levels at the same time point of postnatal insulin measurement, age at the insulin measurement, and the hour-of-day at the study visit. Model 2: Model 1+ rapid weight gain in the first year of life; Model 3 (n=785): Model 1+ insulin levels at birth.
The association between preterm birth and plasma insulin levels in early childhood
As shown in Table 2, plasma insulin levels in early childhood was also inversely associated with gestational age. Plasma insulin levels were 1.12 (95%CI: 0.99–1.25), 1.19 (95%CI: 1.02–1.35), and 1.31 (95%CI: 1.10–1.52) folds higher for children born early term, late preterm, and early preterm, respectively, than children born full term (P-value for linear trend <0.001). This association remained significant after adjusting for other covariables, including maternal race, parity, smoking, infant’s sex, birthweight for gestational age, age at measurement, hour-of-day of study visit, and plasma leptin (measured at the same time point as insulin) (Model 1). We found that a much higher proportion of early preterm infants experienced rapid weight gain in the first year of life than full term infants (84.8% vs. 27.6%). As a result, the association between gestational age groups and plasma insulin was substantially attenuated after adjustment for rapid weight gain in the first year of life (Model 2). The association was no longer significant after adjusting for cord blood insulin levels (Model 3) due to a strong tracking of plasma insulin from birth to early childhood, which is discussed in the following section. Similar results were found when the above analyses were restricted to children with insulin levels measured both at birth and in early childhood (n=785; eTable 3). In addition, we performed age subgroup analyses and found that the preterm birth-insulin association was consistently observed in infancy (age 0–12 months) and early childhood (age 1–6.5 years) (eTable 4).
Tracking of insulin levels from birth to early childhood
Tracking of plasma insulin levels from birth to early childhood was supported by the following data. As illustrated in Figure 3, among children ranked low, middle and high based on cord blood insulin tertiles at birth, there were clear group differences in plasma insulin levels in early childhood. In regression analysis (Table 2, Model 3), cord blood insulin levels were a significant predictor of insulin levels in early childhood. Finally, children who ranked in the top tertile for cord blood insulin levels at birth were more likely to remain in the top tertile in early childhood relative to children ranked in the lowest tertile (41.2% vs. 28.6%).
Figure 3.
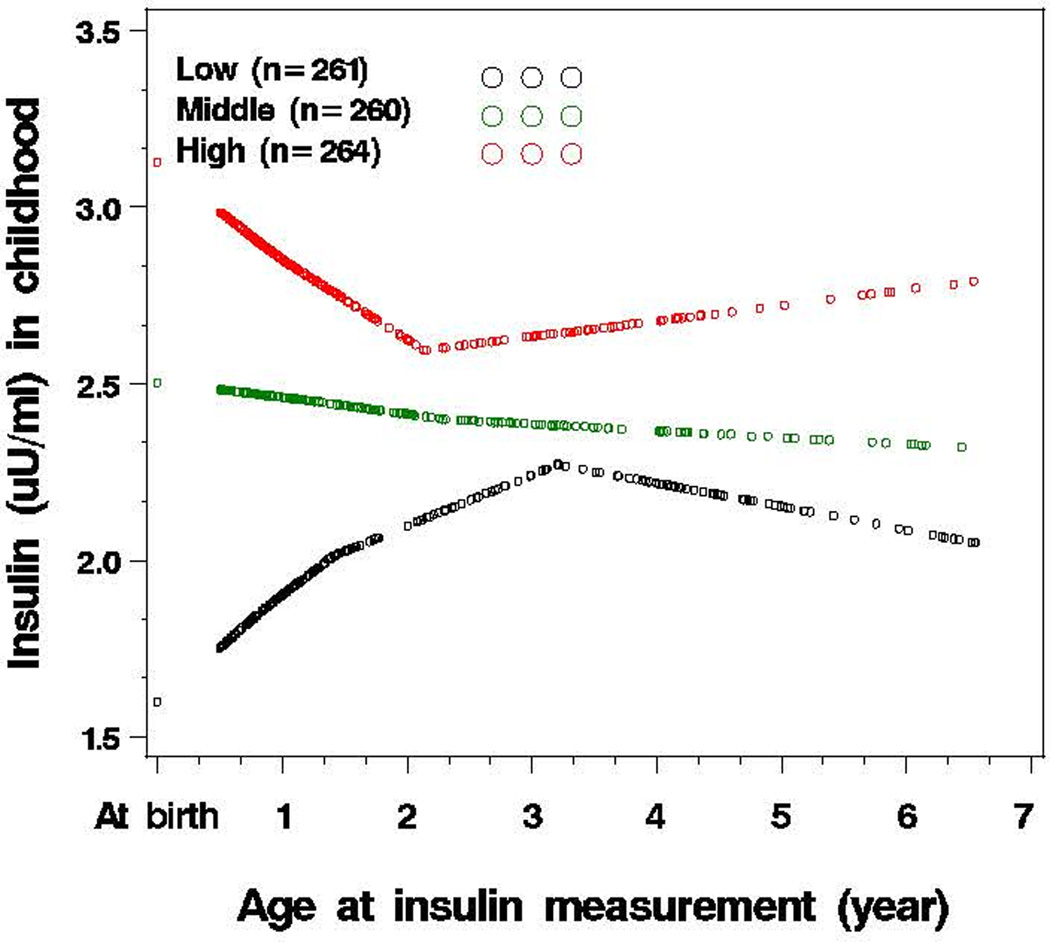
Tracking of plasma insulin levels from birth to early childhood a (n=785)
aY-axis is the mean of logarithmically transformed insulin levels. Age at insulin measurement was the age when blood sample was obtained for the insulin measurement; Early childhood: age range: 0.5–6.5 years, median (25th–75th percentile): 1.4 (0.8–3.3) years; The participants were grouped as low, middle and high tertile based on cord blood insulin levels; the median (interquartile) cord blood insulin levels were 4.8 (2.9–6.9) µU/ml for low tertile; 12.0 (10.4–13.7) µU/ml for middle tertile; and 24.0 (18.6–33.8) µU/ml for high tertile.
DISCUSSION
To our knowledge, this is the first study to investigate the association between preterm birth and random plasma insulin levels at birth and in early childhood in a large, prospective, U.S. birth cohort. We found that plasma insulin levels at birth were inversely associated with gestational age in a dose-response fashion, even after adjustment for birthweight for gestational age and other measured prenatal and perinatal variables. This association was also observed in early childhood. Furthermore, our data are consistent with the tracking of plasma insulin levels from birth into early childhood (up to 6.5 years of age). This study lends further support to previous studies that have reported relationships between preterm birth and altered insulin homeostasis manifested by increased insulin resistance in childhood,3 young adulthood,4,5 and middle-adulthood.8 This study fills a gap in the knowledge base regarding insulin levels during early developmental periods in children born preterm. Our findings suggest that insulin resistance exhibited by adolescents and adults born preterm may originate in utero, and that the developmental programming that occurs in SGA term babies may also occur in preterm babies, irrespective of whether they are SGA or AGA. These findings provide additional evidence that preterm birth (and perhaps early term birth as well) may be a risk factor for the future development of insulin resistance and type 2 diabetes.
The major strength of this study is that plasma insulin levels were measured at two time points (at birth and in early childhood) in a large prospective birth cohort. Major limitations of this study include the use of non-fasting insulin in early childhood and the lack of blood glucose measurements. While we do not have the postprandial time for each participant, we found that the distributions of the hour-of-day at the study visit were similar among the four groups (the Kolmogorov-Smirnov test P-value = 0.12). Additionally, the association between gestational age groups and insulin levels in early childhood was not significantly altered when further adjusting for the hour-of-day at the study visit. Hence, the observed association between preterm birth and childhood insulin levels was not due to differential timing of blood sampling among the four groups.
There are no standard approaches for defining insulin resistance in children.30 In large-scale epidemiological studies, it is challenging in adults, and even more so in children, to estimate insulin sensitivity by hyperglycemic-euglycemic clamp, regarded as the gold standard for determining insulin sensitivity. While a fasting insulin level is regarded as an adequate proxy for insulin sensitivity in children in epidemiological studies,31 it has a low-to-moderate correlation with gold standard indices obtained from clamp studies, and the correlation is even lower in African Americans32 who comprise 60% of our sample. Moreover, fasting levels best reflect hepatic insulin sensitivity rather than peripheral insulin sensitivity (better quantified by hyperglycemic-euglycemic clamps). In preterm children and adults, discordance in peripheral and hepatic insulin sensitivity was reported by at least two research groups who found that while preterm survivors showed abnormalities in peripheral insulin sensitivity, no association was found with fasting insulin (or hepatic insulin sensitivity).3,33 Thus, fasting insulin may not be a sensitive enough indicator to detect differences in insulin homeostasis across gestational groups.
In this study, we observed “random” insulin levels at birth and in early childhood. These should not be regarded as fasting, nor postprandial insulin levels. Presently, there is no data comparing postprandial or fasting insulin levels to those obtained with a hyperglycemic-euglycemic clamp in young children. Moreover, there is no extant data on the implications of using these different methods in children to assess later disease risk. However, available data provide some support for the utility of random insulin levels relative to metabolic and cardiovascular disease outcomes in adults. Random insulin levels have been correlated with the risk of cardiovascular diseases in men,34 stroke,35 type 2 diabetes,36 and hypertension.37 Findings from these adult studies are similar to findings in subsequent studies using fasting insulin as the index for insulin/glucose homeostasis.38 In light of the ongoing debate on fasting vs. non-fasting levels in serum lipid testing,39–41 our study findings establish a foundation upon which to develop additional research questions regarding the utility of random insulin measures and their interpretation. While we cannot directly address the hypothesis that peripheral insulin sensitivity is more likely affected in preterm birth, it is consistent with previous reports on lower insulin sensitivity in preterm birth.3,33
The biological mechanisms underlying the association between preterm birth and elevated insulin at birth and in early childhood are not well understood. As shown in Table 2, the observed preterm-insulin association at birth and in early childhood could not be explained by prenatal and perinatal variables known or suspected to be associated with preterm birth or metabolic risk. In contrast, adjusting for insulin levels at birth the preterm-insulin association in early childhood was no longer significant, suggesting a strong tracking of insulin levels from birth to early childhood. The observed preterm-insulin association in early childhood was substantially attenuated after adjustment for rapid weight gain in the first year of life, because preterm births experienced an accelerated weight gain in the first year of life than term births, and children with rapid weight gain had higher insulin levels than those who did not.
Conclusion
In this prospective, predominantly urban minority birth cohort, plasma insulin levels were inversely associated with gestational age at birth and in early childhood. The implications for understanding the early life origins and early prevention of insulin resistance and type 2 diabetes warrant further investigation.
Supplementary Material
Acknowledgments
Source of Funding: The Boston Birth Cohort (the parent study) is supported in part by the March of Dimes PERI grants (20-FY02-56, #21-FY07-605), the Food Allergy Initiative, and the National Institutes of Health (NIH) grants (R21 ES011666, R01 HD041702, R21HD066471, R21AI088609, U01AI090727).
We wish to acknowledge generous philanthropic support from The Ludwig Family Foundation.
Role of the Sponsor: The sponsors had no role in the design and/or conduct of the study; in the collection, analysis, and interpretation of the data; or in the preparation, review, and approval of the manuscript.
Footnotes
Author Contributions:
Dr. X Wang is the principal investigator of the Boston Birth Cohort (the parent study), and has full access to all of the data in the study and takes responsibility for the integrity of the data and the accuracy of the data analysis.
Study concept and design: G Wang, X Wang,
Acquisition of data: Pearson, Chen, Ji, Zuckerman, G Wang, X Wang
Analysis and interpretation of data: G Wang, Hong, Divall, Radovick, Paige, X Wang, Ning
Drafting of the manuscript: G Wang, Cheng, Walker, X Wang
Critical revision of the manuscript for important intellectual content: Hong, Pearson, Caruso, Walker, Paige, Ning, Zuckerman, Cheng, X Wang, M Wang, Divall, Radovick,
Data management and statistical analysis: Hong, Chen, Ji, Caruso, Pearson, G Wang, M Wang, X Wang
Administrative, technical, and/or material support: Chen, Ji, Caruso, Pearson
Study supervision: X Wang
Funding: X Wang
Conflicts of interests: The authors have declared that no conflicting interests exist.
Additional contributions: We wish to thank all of the study participants, and the Boston Medical Center Labor and Delivery Nursing Staff for their support and help with the study. We thank HJ. Tsai (Division of Biostatistics and Bioinformatics, Institute of Population Health Sciences, National Health Research Institutes, Zhunan, Taiwan) for critical review of the manuscript. We thank LL. Fu (Department of Pediatrics, Boston University School of Medicine and Boston Medical Center, Boston, MA, USA) for data management; A. Ramsey (Department of Pediatrics, Boston University School of Medicine and Boston Medical Center, Boston, MA, USA) for administrative support; and T.R. Bartell (Ann & Robert H. Lurie Children’s Hospital of Chicago Research Center, Chicago, USA) for English editing. We are also grateful for the dedication and hard work of the field team at the Department of Pediatrics, Boston University School of Medicine. None of above named received compensation for their role in this study.
REFERENCES
- 1.Centers for Disease Control and Prevention. Morbidity and Mortality Weekly Report (MMWR) [Accessed November 26, 2013]; http://www.cdc.gov/mmwr/preview/mmwrhtml/su6001a16.htm. Updated January 14, 2011.
- 2.Behrman RE, Butler AS, editors. Preterm Birth: Causes, Consequences, and Prevention. Washington (DC): 2007. [PubMed] [Google Scholar]
- 3.Hofman PL, Regan F, Jackson WE, et al. Premature birth and later insulin resistance. N Engl J Med. 2004;351(21):2179–2186. doi: 10.1056/NEJMoa042275. [DOI] [PubMed] [Google Scholar]
- 4.Hovi P, Andersson S, Eriksson JG, et al. Glucose regulation in young adults with very low birth weight. N Engl J Med. 2007;356(20):2053–2063. doi: 10.1056/NEJMoa067187. [DOI] [PubMed] [Google Scholar]
- 5.Irving RJ, Belton NR, Elton RA, Walker BR. Adult cardiovascular risk factors in premature babies. Lancet. 2000;355(9221):2135–2136. doi: 10.1016/S0140-6736(00)02384-9. [DOI] [PubMed] [Google Scholar]
- 6.Kaijser M, Bonamy AK, Akre O, et al. Perinatal risk factors for diabetes in later life. Diabetes. 2009;58(3):523–526. doi: 10.2337/db08-0558. [DOI] [PMC free article] [PubMed] [Google Scholar]
- 7.Mathai S, Cutfield WS, Derraik JG, et al. Insulin sensitivity and beta-cell function in adults born preterm and their children. Diabetes. 2012;61(10):2479–2483. doi: 10.2337/db11-1672. [DOI] [PMC free article] [PubMed] [Google Scholar]
- 8.Pilgaard K, Faerch K, Carstensen B, et al. Low birthweight and premature birth are both associated with type 2 diabetes in a random sample of middle-aged Danes. Diabetologia. 2010;53(12):2526–2530. doi: 10.1007/s00125-010-1917-3. [DOI] [PubMed] [Google Scholar]
- 9.Gluckman PD, Hanson MA. Living with the past: evolution, development, and patterns of disease. Science. 2004;305(5691):1733–1736. doi: 10.1126/science.1095292. [DOI] [PubMed] [Google Scholar]
- 10.Cutfield W. Short and sweet: the perinatal origins of type 2 diabetes mellitus. Pediatr Diabetes. 2004;5(3):113–116. doi: 10.1111/j.1399-543X.2004.00065.x. [DOI] [PubMed] [Google Scholar]
- 11.Khan IY, Lakasing L, Poston L, Nicolaides KH. Fetal programming for adult disease: where next? J Matern Fetal Neona. 2003;13(5):292–299. doi: 10.1080/jmf.13.5.292.299. [DOI] [PubMed] [Google Scholar]
- 12.Hales CN, Barker DJ, Clark PM, et al. Fetal and infant growth and impaired glucose tolerance at age 64. Bmj. 1991;303(6809):1019–1022. doi: 10.1136/bmj.303.6809.1019. [DOI] [PMC free article] [PubMed] [Google Scholar]
- 13.Wang X, Zuckerman B, Pearson C, et al. Maternal cigarette smoking, metabolic gene polymorphism, and infant birth weight. Jama. 2002;287(2):195–202. doi: 10.1001/jama.287.2.195. [DOI] [PubMed] [Google Scholar]
- 14.Chatterjee R, Yeh HC, Shafi T, et al. Serum potassium and the racial disparity in diabetes risk: the Atherosclerosis Risk in Communities (ARIC) Study. Am J Clin Nutr. 2011;93(5):1087–1091. doi: 10.3945/ajcn.110.007286. [DOI] [PMC free article] [PubMed] [Google Scholar]
- 15.Ouyang F, Parker M, Cerda S, et al. Placental weight mediates the effects of prenatal factors on fetal growth: the extent differs by preterm status. Obesity (Silver Spring) 2013;21(3):609–620. doi: 10.1038/oby.2012.88. [DOI] [PMC free article] [PubMed] [Google Scholar]
- 16.Yu Y, Zhang S, Wang G, et al. The combined association of psychosocial stress and chronic hypertension with preeclampsia. Am J Obstet Gynecol. 2013;209(5):438 e431–438 e412. doi: 10.1016/j.ajog.2013.07.003. [DOI] [PMC free article] [PubMed] [Google Scholar]
- 17.Kumar R, Ouyang F, Story RE, et al. Gestational diabetes, atopic dermatitis, and allergen sensitization in early childhood. J Allergy Clin Immunol. 2009;124(5):1031–1038. e1031–e1034. doi: 10.1016/j.jaci.2009.06.052. [DOI] [PMC free article] [PubMed] [Google Scholar]
- 18.ACOG committee opinion no. 560: Medically indicated late-preterm and early-term deliveries. Obstet Gynecol. 2013;121(4):908–910. doi: 10.1097/01.AOG.0000428648.75548.00. [DOI] [PubMed] [Google Scholar]
- 19.Wang L, Wang X, Laird N, Zuckerman B, Stubblefield P, Xu X. Polymorphism in maternal LRP8 gene is associated with fetal growth. Am J Hum Genet. 2006;78(5):770–777. doi: 10.1086/503712. [DOI] [PMC free article] [PubMed] [Google Scholar]
- 20.Silva D, Colvin L, Hagemann E, Bower C. Environmental Risk Factors by Gender Associated With Attention-Deficit/Hyperactivity Disorder. Pediatrics. 2013 doi: 10.1542/peds.2013-1434. [DOI] [PubMed] [Google Scholar]
- 21.Kumar P, Venners SA, Fu L, Pearson C, Ortiz K, Wang X. Association of antenatal steroid use with cord blood immune biomarkers in preterm births. Early Hum Dev. 2011;87(8):559–564. doi: 10.1016/j.earlhumdev.2011.04.013. [DOI] [PMC free article] [PubMed] [Google Scholar]
- 22.World Health organization. Child growth standards. [Accessed November 26,2013]; http://www.who.int/childgrowth/standards/bmi_for_age/en/index.html. [Google Scholar]
- 23.Centers for Disease Control and Prevention. Growth Charts. [Accessed November 26, 2013]; http://www.cdc.gov/growthcharts/clinical_charts.htm. Updated August 4, 2009. [Google Scholar]
- 24.Leunissen RW, Kerkhof GF, Stijnen T, Hokken-Koelega A. Timing and tempo of first-year rapid growth in relation to cardiovascular and metabolic risk profile in early adulthood. Jama. 2009;301(21):2234–2242. doi: 10.1001/jama.2009.761. [DOI] [PubMed] [Google Scholar]
- 25.Hassink SG, Sheslow DV, de Lancey E, Opentanova I, Considine RV, Caro JF. Serum leptin in children with obesity: relationship to gender and development. Pediatrics. 1996;98(2 Pt 1):201–203. [PubMed] [Google Scholar]
- 26.Hernandez MI, Rossel K, Pena V, et al. Leptin and IGF-I/II during the first weeks of life determine body composition at 2 years in infants born with very low birth weight. J Pediatr Endocrinol Metab. 2012;25(9–10):951–955. doi: 10.1515/jpem-2012-0184. [DOI] [PubMed] [Google Scholar]
- 27.Zhang S, Liu X, Brickman WJ, et al. Association of plasma leptin concentrations with adiposity measurements in rural Chinese adolescents. J Clin Endocrinol Metab. 2009;94(9):3497–3504. doi: 10.1210/jc.2009-1060. [DOI] [PMC free article] [PubMed] [Google Scholar]
- 28.Hong X, Wang G, Liu X, et al. Gene polymorphisms, breast-feeding, and development of food sensitization in early childhood. J Allergy Clin Immunol. 2011;128(2):374–381. e372. doi: 10.1016/j.jaci.2011.05.007. [DOI] [PMC free article] [PubMed] [Google Scholar]
- 29.Casella G, Berger RL. Statistical Inference. 2nd ed. Australia: Pacific Grove, CA : Thomson Learning; 2002. [Google Scholar]
- 30.Levy-Marchal C, Arslanian S, Cutfield W, et al. Insulin resistance in children: consensus, perspective, and future directions. J Clin Endocrinol Metab. 2010;95(12):5189–5198. doi: 10.1210/jc.2010-1047. [DOI] [PMC free article] [PubMed] [Google Scholar]
- 31.Uwaifo GI, Fallon EM, Chin J, Elberg J, Parikh SJ, Yanovski JA. Indices of insulin action, disposal, and secretion derived from fasting samples and clamps in normal glucose-tolerant black and white children. Diabetes Care. 2002;25(11):2081–2087. doi: 10.2337/diacare.25.11.2081. [DOI] [PubMed] [Google Scholar]
- 32.Pisprasert V, Ingram KH, Lopez-Davila MF, Munoz AJ, Garvey WT. Limitations in the use of indices using glucose and insulin levels to predict insulin sensitivity: impact of race and gender and superiority of the indices derived from oral glucose tolerance test in African Americans. Diabetes Care. 2013;36(4):845–853. doi: 10.2337/dc12-0840. [DOI] [PMC free article] [PubMed] [Google Scholar]
- 33.Dalziel SR, Parag V, Rodgers A, Harding JE. Cardiovascular risk factors at age 30 following pre-term birth. Int J Epidemiol. 2007;36(4):907–915. doi: 10.1093/ije/dym067. [DOI] [PubMed] [Google Scholar]
- 34.Perry IJ, Wannamethee SG, Whincup PH, Shaper AG, Walker MK, Alberti KG. Serum insulin and incident coronary heart disease in middle-aged British men. Am J Epidemiol. 1996;144(3):224–234. doi: 10.1093/oxfordjournals.aje.a008917. [DOI] [PubMed] [Google Scholar]
- 35.Wannamethee SG, Perry IJ, Shaper AG. Nonfasting serum glucose and insulin concentrations and the risk of stroke. Stroke. 1999;30(9):1780–1786. doi: 10.1161/01.str.30.9.1780. [DOI] [PubMed] [Google Scholar]
- 36.Perry IJ, Wannamethee SG, Shaper AG, Alberti KG. Serum true insulin concentration and the risk of clinical non-insulin dependent diabetes during long-term follow-up. Int J Epidemiol. 1999;28(4):735–741. doi: 10.1093/ije/28.4.735. [DOI] [PubMed] [Google Scholar]
- 37.He J, Klag MJ, Caballero B, Appel LJ, Charleston J, Whelton PK. Plasma insulin levels and incidence of hypertension in African Americans and whites. Arch Intern Med. 1999;159(5):498–503. doi: 10.1001/archinte.159.5.498. [DOI] [PubMed] [Google Scholar]
- 38.Hu G, Qiao Q, Tuomilehto J, Eliasson M, Feskens EJ, Pyorala K. Plasma insulin and cardiovascular mortality in non-diabetic European men and women: a meta-analysis of data from eleven prospective studies. Diabetologia. 2004;47(7):1245–1256. doi: 10.1007/s00125-004-1433-4. [DOI] [PubMed] [Google Scholar]
- 39.Sidhu D, Naugler C. Fasting time and lipid levels in a community-based population: a cross-sectional study. Arch Intern Med. 2012;172(22):1707–1710. doi: 10.1001/archinternmed.2012.3708. [DOI] [PubMed] [Google Scholar]
- 40.Aldasouqi SA, Grunberger G. Is it time to eliminate the need for overnight fasting for lipid tests in patients with diabetes? JAMA Intern Med. 2013;173(10):936–937. doi: 10.1001/jamainternmed.2013.398. [DOI] [PubMed] [Google Scholar]
- 41.Martin SS, Blaha MJ, Jones SR. Nonfasting lipids: there is the population and then there is the patient. JAMA Intern Med. 2013;173(10):935–936. doi: 10.1001/jamainternmed.2013.383. [DOI] [PubMed] [Google Scholar]
Associated Data
This section collects any data citations, data availability statements, or supplementary materials included in this article.