Abstract
Virtually all biomedical applications of positron emission tomography (PET) use images to represent the distribution of a radiotracer. However, PET is increasingly used in cell tracking applications, for which the “imaging” paradigm may not be optimal. Here we investigate an alternative approach, which consists in reconstructing the time-varying position of individual radiolabeled cells directly from PET measurements. As a proof of concept, we formulate a new algorithm for reconstructing the trajectory of one single moving cell directly from list-mode PET data. We model the trajectory as a 3D B-spline function of the temporal variable and use non-linear optimization to minimize the mean-square distance between the trajectory and the recorded list-mode coincidence events. Using Monte Carlo simulations (GATE), we show that this new algorithm can track a single source moving within a small-animal PET system with <3 mm accuracy provided that the activity of the cell [Bq] is greater than four times its velocity [mm/s]. The algorithm outperforms conventional ML-EM as well as the “minimum distance” method used for positron emission particle tracking (PEPT). The new method was also successfully validated using experimentally acquired PET data. In conclusion, we demonstrated the feasibility of a new method for tracking a single moving cell directly from PET list-mode data, at the whole-body level, for physiologically relevant activities and velocities.
Index Terms: Positron emission tomography, cell tracking, single-cell methods, optimization
I. INTRODUCTION
Positron emission tomography (PET) is used for a variety of applications, ranging from clinical oncology and cardiology to pre-clinical drug discovery and neuroscience. Virtually all PET applications rely on the same workflow, which involves reconstructing one or more images representing the time-varying distribution of a radiotracer [1–3]. These images can later be processed and analyzed to extract biologically relevant parameters such as standardized uptake value. Increasingly, however, PET is used in “tracking” applications, for which the “imaging” paradigm may not be optimal.
In this article, we investigate the feasibility of tracking a single cell with PET. Cell tracking is a method that involves labeling cells ex vivo using a contrast agent and imaging their time-varying distribution in vivo [4–7]. Clinically, the most common use of cell tracking is for tracking white blood cells to identify occult sites of infection or inflammation [8]. More recently, advances in stem cell science and immunology have led to new cell-based therapies for cardiac, neural, and pancreatic tissue regeneration and cancer immunotherapy [9–11]. Cell tracking is also widely used as a preclinical research tool to study biological processes such as cancer metastasis. Transplanted cells can be labeled and imaged non-invasively using magnetic resonance imaging (MRI) [12–14], positron emission tomography (PET) [15–17], single-photon emission computed tomography (SPECT) [18, 19], and optical imaging [20, 21]. So far, no consensus has been reached on which imaging modality is best suited for cell tracking. MRI is the only imaging modality that has shown the capability to image single cells in vivo [22, 23], but only for a few anatomical sites such as the brain and the liver; furthermore, MRI lacks sufficient temporal resolution to track single cells circulating in the bloodstream and homing to sites of infection or injury.
Of all the existing imaging modalities, PET has the highest molecular sensitivity and thus offers the most promising path towards tracking single cells in vivo and at the whole-body level. However, conventional algorithms used for reconstructing PET images are not optimal for tracking the trajectory of a single cell. The output of a conventional PET scan—large 3D images with millions of elements—is poorly suited for representing a single moving point source with high temporal resolution. This inefficient representation leads to an ill-posed reconstruction problem, meaning that millions of image elements must be computed from a small number of recorded PET coincidence measurements. Furthermore, a sequence of tomographic images is inefficient at representing the continuous motion of a sparse set of sources because it implies a discretization of space and time. As a result, PET images reconstructed from low-activity point sources are noisy and not suitable for tracking a moving source. A few strategies have been proposed to reconstruct dynamic PET images that are continuous along the temporal dimension [24–27], but these methods still use represent the spatial dimension as a matrix of discrete elements.
Alternatives to conventional image reconstruction for tracking single positron-emitting sources using PET have been proposed and investigated, especially in the field of chemical engineering. Early studies at the University of Birmingham (UK) have shown that single particles labeled with a positron-emitting radionuclide can be used as tracers to analyze complex patterns of fluid and powder flows in chemical processes [28]. The technique was later refined and became known as positron emission particle tracking (PEPT). Unlike PET, PEPT uses a minimum-distance algorithm to localize a single moving source directly from PET measurements, that is, without reconstructing a tomographic image. Because the radiotracer is confined to a single particle, the reconstruction problem can be reformulated as a localization task and the position of the particle can be estimated directly from raw PET measurements, by finding the point in space that minimizes the average distance to the recorded coincidence lines [29]. PEPT further uses an iterative algorithm to reject scattered and random coincidences. By splitting coincidence events into temporal frames, PEPT makes it possible to estimate the time-varying position and velocity of a single moving particle. PEPT has been applied to a variety of problems in the chemical engineering world, including mapping the dynamic behavior of opaque fluids, and the flow structure in fluidized beds and in canned foodstuffs [30]. A variation of PEPT has also been developed to simultaneously track two independent particles [31].
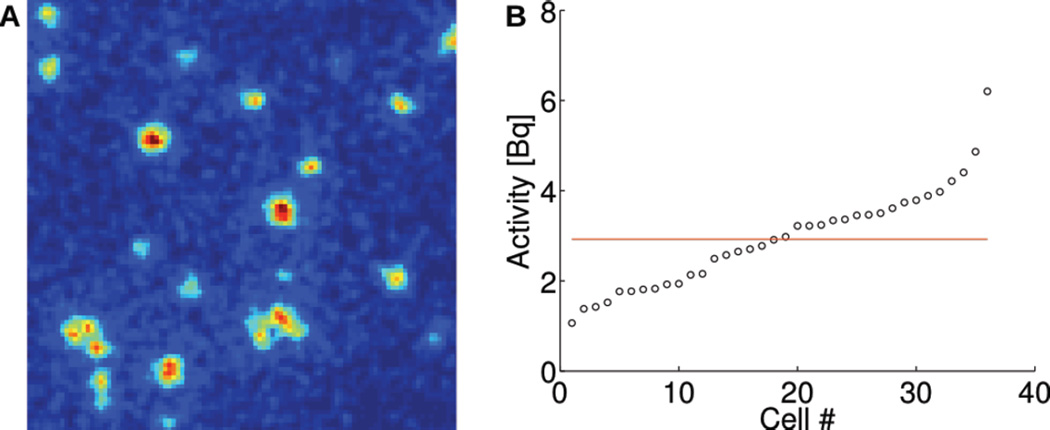
In most PEPT studies, single particles are labeled with 1–30 MBq of 18F and tracked using a dual-panel PET camera. However, it is likely impossible to label single cells with such high levels of activity. Using a new method called radioluminescence microscopy [32, 33], we have shown that single cells can be labeled with 1–10 Bq of radioactive 18F-fluorodeoxyglucose (FDG) (Fig. 1). Tracking single cells in vivo therefore requires novel reconstruction methods that can provide robust positioning information using fewer detected counts.
Fig. 1.
In vitro radioluminescence microscopy of single cells. (A) Radioluminescence micrograph showing uptake of FDG in single 4T1 cells. (B) Quantitative FDG uptake measurement shown for 40 single cells.
The goals and contributions of this article are multiple. First, we investigate whether a tracking scheme similar to PEPT could be applied in the context of biomedical imaging for tracking a single cell moving within a mouse. Second, to address the issue of the low radioactivity, we propose an improved localization scheme that uses a spline function to represent the time-varying position of a cell as a function of time. This model is advantageous because it represents space and time as two continuous quantities, and it models the trajectory of a cell as a smooth function. Third and last, we answer the question: For what combination of activity and velocity is single-cell tracking possible? Because this study focuses on feasibility, it does not address whether and how multiple cells could be tracked. These questions will be answered in future work.
II. THEORY
A. Trajectory representation
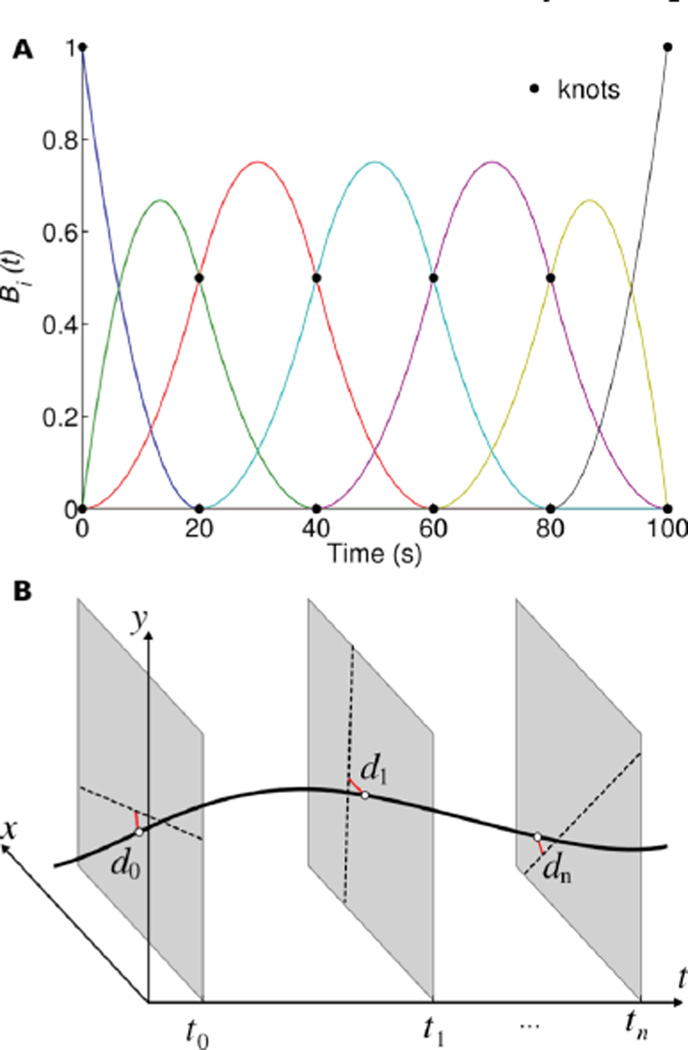
This section describes a new algorithm for tracking the position of a single moving point source directly from raw PET data. We represent the trajectory of the moving source as a 3D B-spline function of the temporal variable. A spline is simply a piecewise polynomial, where the intervals are delineated by spline “knots”. The spline function and its derivatives remain continuous at the spline knots. Splines can be represented in several ways. This work uses the convenient B-spline representation, which decomposes the spline as a weighted sum of basis functions (Fig. 2A). Thus, the trajectory of a moving point source can be represented as
| (1) |
where Bi(t) are 1D spline basis functions, ai = (aix, aiy, aiz) are spline coefficients and N is the number of basis functions used in the model. This model naturally incorporates the knowledge that the trajectory is a smooth and continuous function, and requires no discretization of the spatial or temporal variable. Furthermore, a complete trajectory can be described using only 3N variables, far fewer than the size of a 4D PET image. The parameter N, which controls the number of basis functions, allows the model to be adjusted as needed.
Fig. 2.
Depiction of the proposed trajectory reconstruction algorithm. (A) Example of cubic B-spline basis functions used to model the time-varying trajectory of a single moving source (N=7). (B) The optimal trajectory (black curved line) is estimated by finding the 3D spline that has minimum mean-square distance (red lines) to the recorded coincidence events (dashed lines). Tracking is performed in 3D but, for simplicity, only two spatial dimensions are shown.
B. Objective function
PET forms images by acquiring coinciding pairs of annihilation photons, which are emitted in opposing directions. When two events are detected nearly simultaneously, one can infer that a radioactive decay event occurred somewhere along the line than joins the two detectors. We note that, in principle, only two intersecting lines are required to localize a single static source in 3D. Intuitively, this concept can be transposed to a moving source by using the continuous stream of lines provided by a list-mode PET acquisition. Each element of a list-mode dataset contains the time and coordinates of each coincidence event. This format is thus ideal for locating a moving source because it preserves the full spatial and temporal resolution of the measurements. The advantages of reconstructing tomographic images directly from list-mode data have long been recognized [34–36].
We propose an algorithm for estimating the spatiotemporal trajectory r(t) of a moving point source given a set of list-mode coincidence events. In an ideal PET system with perfect spatial, temporal and spectral resolution, the trajectory of the moving source and the coincidence lines would intersect. Therefore, our approach, which is illustrated in Fig. 2B, selects the source trajectory that minimizes the mean-square distance between the time-varying source position and the measured coincidence lines. By representing the trajectory as a spline function, we limit the search space to a small subset of smooth and continuous trajectories, the size of which is determined by the number of intervals N used to define the spline trajectory.
A list-mode data file contains spatial and temporal information for all recorded coincidence events. Here, we mathematically represent this information as follows. The line of response corresponding to event j shall be defined as the position of one of the detectors, which will be noted as Pj, and the unit-length direction of the line, which will be noted as vj. The timestamp of the event will be noted as τj. We then calculate the Euclidian distance dj between line j and the corresponding point Mj = r(τj) that lies on the spline trajectory using the following relationship:
| (2) |
The mean-square distance between a given source trajectory r(t) and a set of K coincidence lines is given by
| (3) |
This objective function is a quadratic function of the spline coefficients and can be minimized using standard convex optimization methods to yield the optimal estimate of the source trajectory.
C. Uniqueness of solution and regularization
For low-activity sources, it should be noted that the trajectory that minimizes I(a) may not be unique. As shown in Fig. 2A, the ith spline basis function is non-zero only within the interval [ti−2, ti+1], thus if no count is recorded within that interval, ai is entirely decoupled from the objective function I(a). In that situation, it is impossible to objectively determine the value of ai and the algorithm may grossly misestimate the source trajectory. To circumvent this problem, we add a regularization term R(a) to the objective function. This term, which is defined as
| (4) |
favors trajectory for which the spline coefficients vary the least in the L2 sense. In other words, if no coincidence events are detected over a prolonged time interval, the reconstruction algorithm extrapolates from surrounding events, implicitly favoring shorter trajectories (less variation in the position of the source) over longer ones. The strength of the regularization is adjustable using a parameter λ and was set to 0.005 in our experiments.
Another solution, which was not investigated in this work, would be to space the spline knots non-uniformly such that coincidence events are equally distributed among spline intervals, thus ensuring that there are always enough counts within each spline interval.
D. Random and scattered coincidence
In addition to the aforementioned effects, PET measurements are invariably corrupted by erroneous events that are indistinguishable from true coincidence events. These events are caused by accidental coincidences and scattered photons, and yield lines that do not pass near the true position of the source. Due to the strong quadratic penalty, these distant events would distort the reconstructed trajectory. To remediate this problem, we keep dj constant beyond a distance dmax. This strategy aims at reducing the impact of distant outliers, here scattered and random counts, and is thus an example of robust statistical estimation [37]. Using this principle, the objective function can be rewritten as
| (5) |
This new objective is a non-convex function of the spline coefficients. Therefore, a conventional optimization method may converge to a different local minimum depending on the initial conditions. In this work, we used the trajectory that minimizes I(a) as the starting point for minimizing J(a). While not guaranteed to converge to the global minimum, we found that, in practice, this method yields satisfactory trajectories for a wide range of physical conditions, as seen in the next section. In the experiments described later, the parameter dmax was set to 3 mm, which is approximately twice the crystal size for the Inveon, but any value between 2 and 6 mm resulted in suitable performance.
III. METHODS
A. Monte Carlo simulation
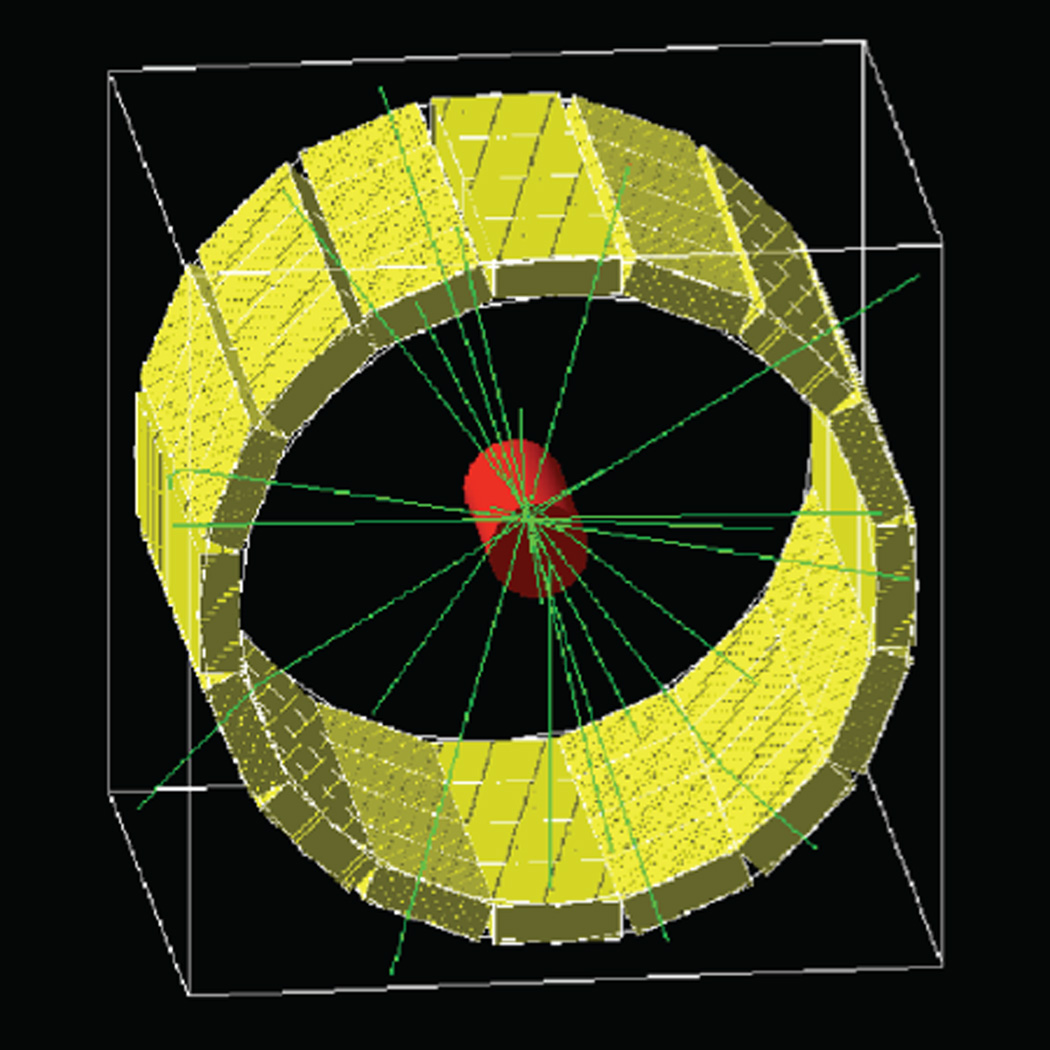
To validate the trajectory reconstruction algorithm, we used the GATE Monte Carlo package [38] to simulate the acquisition of list-mode data from the Siemens Inveon microPET scanner (Fig. 3). The system geometry was implemented as previously described, using LSO as the detector material [39]. The energy and time windows were set to 250–750 keV and 3.4 ns, respectively. Single events were positioned at the center of the crystal, at a depth of 3 mm. The simulation time was set to 100 s and divided into 10,000 time slices, thus providing a simulated temporal resolution of 10 ms. A single 18F point source was placed in a static water phantom which approximated the body of a mouse (a cylinder with a diameter of 2.5 cm and a height of 5 cm) and moved according to various predefined motion patterns, which are detailed in the Results section. Coincidence events generated by GATE were processed using Root and converted into a list-mode data file. With these simulation settings, we achieve a sensitivity of 8.4% for a 1000 Bq static point source placed at the center of the system.
Fig. 3.
Geometric model of the Inveon microPET. The acquisition of list-mode data was simulated using the GATE Monte Carlo package.
In performing the aforementioned simulations, we became aware of a limitation within GATE, which yielded incorrect results for very low activities and very short time slices. The issue becomes more apparent when the simulation has many more time slices than positron decays. We observed that the number of counts produced by GATE was several fold higher than expected based on the known activity and sensitivity. This apparent bias disappeared with longer time slices, but temporal resolution then became too poor for accurate tracking. Thus, as a temporary fix, we implemented a method that randomly discards excess counts based on a Bernoulli random process. The method was optimized to yield a number of counts consistent on average with the sensitivity of the Inveon measured at higher activity levels. The counts obtained with this method remain Poisson-distributed.
B. Optimization
Unconstrained non-linear optimization of the objective function was implemented in MATLAB using the fminunc function, which is an implementation of the quasi-Newton line search method. We chose this optimization method for its availability, although it is relatively slow. The maximum number of iterations was set to 2000, and the minimum step length to 0.01 mm.
The spatiotemporal trajectory of the source was represented using a 3D B-spline function of order 3. The number of spline intervals was chosen so that each interval contained an average of 5 counts. Spline knots were uniformly spaced and had single multiplicity except for the two knots at the extremities of the trajectory, which had triple multiplicity to allow for a discontinuity.
C. ML-EM image reconstruction
As a reference, we reconstructed PET images from simulated point sources (1, 10, 100, 1000 Bq) using standard maximum-likelihood expectation-maximization (MLEM), a popular reconstruction algorithm. Tomographic images (pixel size: 0.78125 mm × 0.78125 mm × 0.786 mm) were reconstructed directly from raw list-mode data using a previously developed GPU-accelerated package [34]. Due to the low count statistics, ordered subsets were not used. The reconstruction procedure was carried out for 100 iterations, which was deemed sufficient for convergence purposes.
D. Frame-based trajectory reconstruction
We also implemented the “minimum-distance” method that is currently used in PEPT for tracking moving particles in fluid and powder systems. This method models the trajectory as a sequence of discrete frames, which are reconstructed independently. For each frame, the method aims to find the point in space that minimizes the average perpendicular distance to the coincidence lines within that frame. Thus, the minimum-distance method can be formulated as a special case of spline trajectory reconstruction, but with piecewise-constant basis functions (i.e. first-order B spline). Thus, after optimization, the coefficients of the first-order B-spline correspond to the point in space that is closest to the lines recorded within the corresponding frames. We thus implemented the minimum-distance method simply by decreasing the order of the spline trajectory from 3 to 1. For comparison with third-order B-splines, the number of knots was kept the same and scatter and randoms rejection was implemented in the same manner.
E. Tracking Accuracy
We evaluated the performance of the trajectory reconstruction algorithm by computing the tracking accuracy, which we define as
| (6) |
where θk is a uniform subdivision of the time domain, Q = 5000, and pk is the known simulated trajectory.
F. Experimental Validation
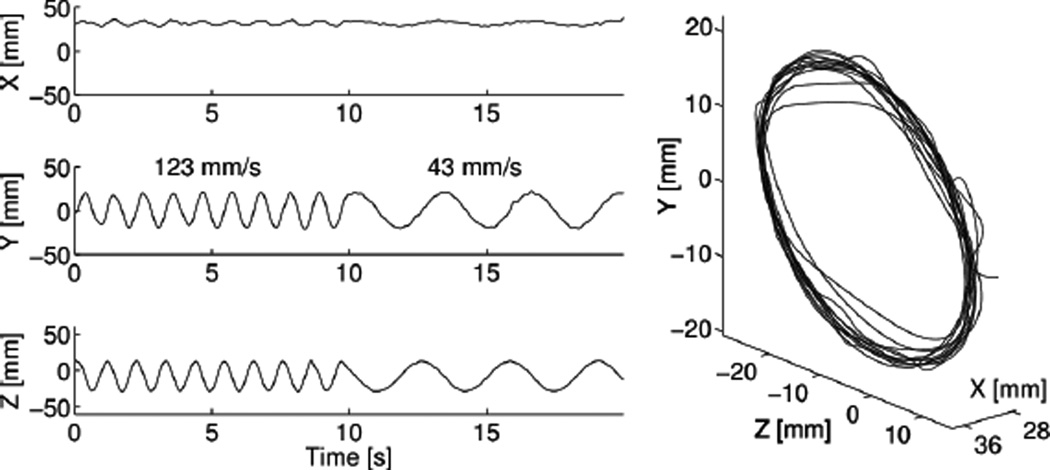
As a final validation, we acquired list-mode data of a moving 22Na point source (130 kBq) using an Inveon PET scanner (energy window of 350–650 keV, timing window of 3.4 ns). The point source was mounted onto a turntable powered by a stepper motor and scanned for 3 min. The rotation speed was initially set to 123 ±2 mm/s and was decreased halfway through the acquisition to 43 ±1 mm/s. List-mode data were retrieved from the Inveon workstation and imported into MATLAB for reconstruction. The reconstruction parameters were kept the same as in the Monte Carlo simulation study (5 counts/spline interval, dmax = 3 mm, and λ = 0.005). To simulate an even lower activity source, we randomly discarded 97.8% of the acquired counts, thus achieving count statistics equivalent to the previously simulated 1000 Bq source.
IV. RESULTS
A. Comparison with ML-EM and frame-based reconstruction
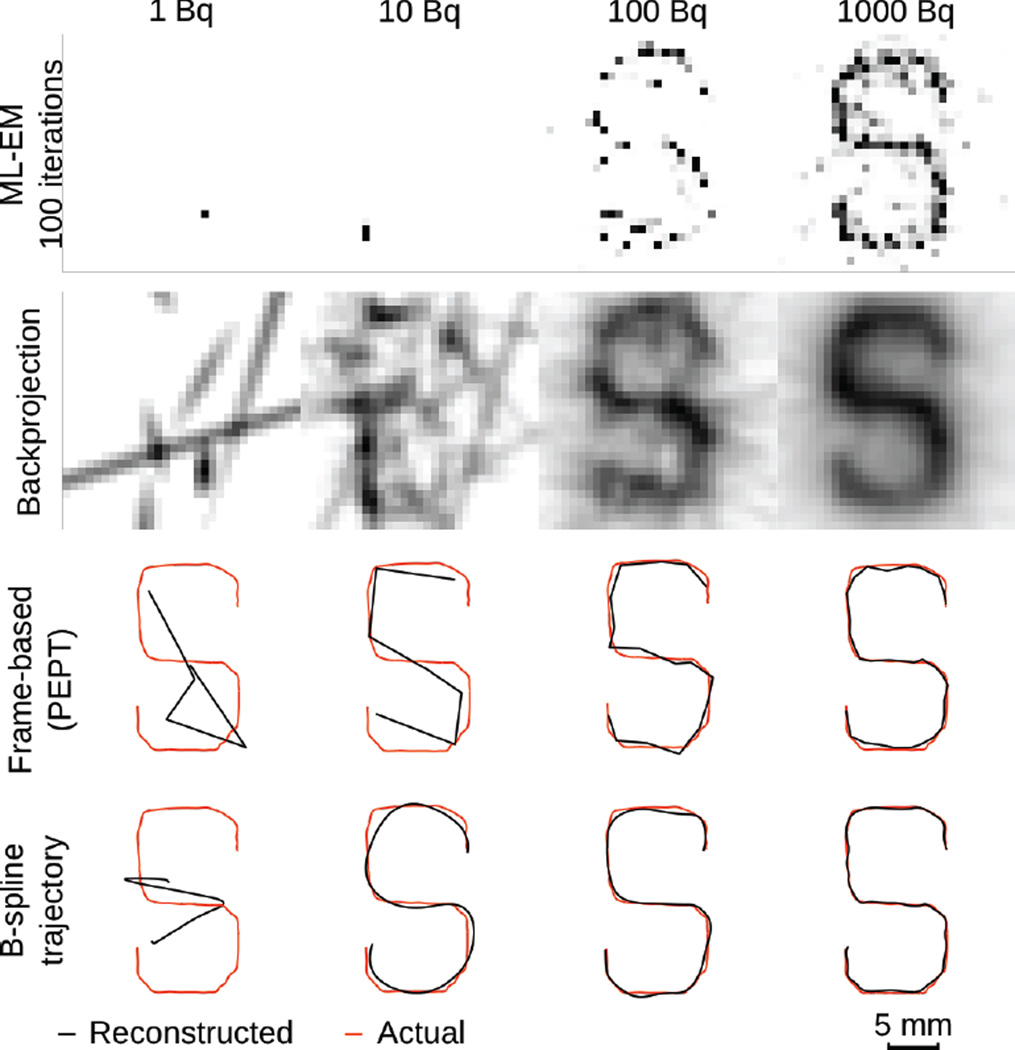
We first compare the proposed trajectory reconstruction algorithm against standard list-mode MLEM (Fig. 4). A point source (1, 10, 100, and 1000 Bq) following an S-like trajectory (0.5 mm/s) was simulated in GATE. List-mode data were generated and reconstructed using both MLEM and the novel trajectory reconstruction algorithm. For the 1000 Bq source, the pattern of the S trajectory was clearly visible in the MLEM image. However, with decreasing amounts of radioactivity, the MLEM images became noisier and no longer represented the accurate spatiotemporal trajectory of the moving point source, especially for physiologically achievable cell activities (i.e. less than 10 Bq). The first iteration of the reconstruction is a backprojection of all the recorded counts and provides a lower noise image.
Fig. 4.
From top to bottom: (1) MLEM reconstruction of list-mode PET data from a point source (1, 10, 100, 1000 Bq) moving at 0.5 mm/s in an S pattern (100 iterations). (2) Same data, processed using a single backprojection. (3) Source trajectory estimated directly from list-mode data using the minimum-distance method used in PEPT, which splits the events into independent frames. (4) Same data, reconstructed using a third-order B-spline. Spline parameters were optimized for each activity level.
In contrast to tomographic image reconstruction, direct reconstruction of the source position from raw list-mode data was possible for activities as low as 10 Bq. Furthermore, with increasing amounts of radioactivity, tracking accuracy improved dramatically. We note that all methods failed to suitably track the 1 Bq source because of unsufficient count statistics.
A visual comparison of the trajectories reconstructed using the frame-based method used in PEPT and the spline-based method introduced in this article shows that the spline-based method can more accurately estimate the trajectory of the moving source. This is likely due to the fact that the frame-based method does not account for the motion of the source within each temporal frame.
B. Velocity and activity
To better understand the capabilities and limitations of single-cell tracking with PET, we simulated a variety of point-source trajectories. Anticipating that the ability to track a moving point source would be determined both by the activity and velocity of the source, we simulated a single source (activity ranging from 1 to 1000 Bq) moving in a helical fashion (velocity ranging from 0.4 to 185 mm/s) inside a static water phantom. The range of velocities chosen in this experiment was meant to mimic the average blood flow velocity in humans, which ranges from 0.7 mm/s in capillaries to 400 mm/s in the aorta [40]. Each Monte Carlo simulation was repeated 10 times (with different random seeds) to assess statistical significance.
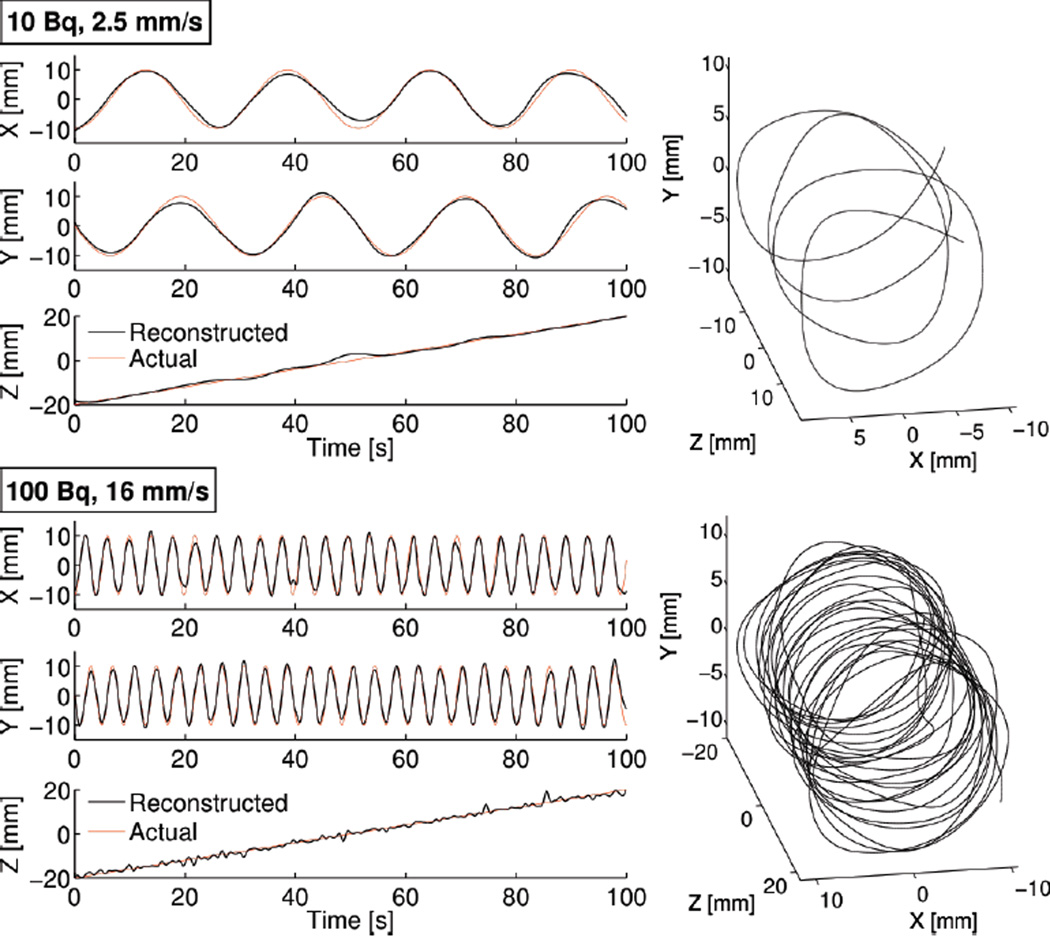
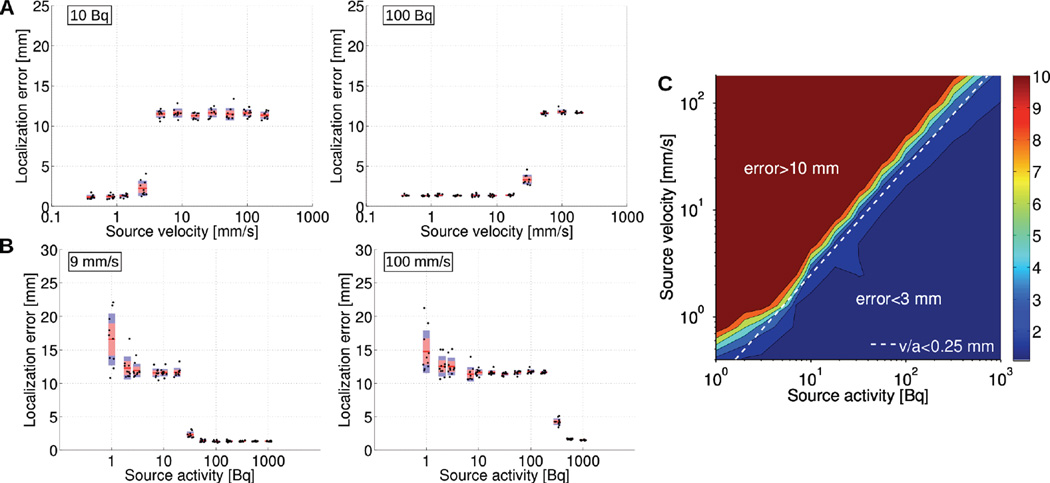
Our simulations show that the spline reconstruction algorithm can track a single source over a wide range of velocities and activities. For instance, both a 10 Bq source moving 2.5 mm/s and a 100 Bq source moving 16 mm/s were tracked with average localization error better than 3 mm (Fig. 5). Videos of these trajectories are included online as supplemental information. The general pattern we observed was that source tracking could lead to three possible outcomes, namely success, failure, or an intermediate state. For sufficiently low velocity (Fig. 6A) or sufficiently high activity (Fig. 6B), tracking was successful and achieved a constant localization error of ≈1.3 mm, independent of activity and velocity. In contrast, for certain combinations of low activities and high velocities, tracking simply failed, leading to poor tracking accuracy (i.e. > 10 mm). Last, we observed an intermediate outcome for which tracking was partially successful, meaning that the shape of the reconstructed trajectory could be recognized but it significantly deviated from the reference trajectory. Additionally, for low activity sources, we noticed that individual simulations of the same experiment showed a greater level of variability, compared to higher levels of activity.
Fig. 5.
Two examples of source tracking. Left column: The reconstructed position of two moving sources (10 and 100 Bq) is compared against the known simulated trajectory (helical motion, 2.5 or 16 mm/s). Right column: 3D rendering of the reconstructed trajectory. (5 counts / spline interval)
Fig. 6.
Influence of activity and velocity on the localization of a single moving source. (A) Localization error as a function of source velocity for a 10 and 100 Bq source. (B) Localization error as a function of source activity for a 9 and 100 mm/s velocity source. (C) Localization error as a function of source activity and velocity. The dashed line delineates the highest source velocity that can be tracked with < 3 mm tracking error for a given activity. (5 counts / spline interval)
We then sought to establish an empirical rule governing the feasibility of single-cell tracking, especially with regards to source velocity and activity. We consider a source to be successfully tracked if tracking accuracy is better than 3 mm. Based on this criteria, a source can be tracked if its activity [Bq] is greater than four times its velocity [mm/s] (Fig. 6C, dashed line). For example, a single cell moving 2.5 mm/s must be labeled with at least 10 Bq (4×2.5) of activity to be successfully tracked (e.g. Fig 5). This trend was observed over a wide range of velocities and activities.
C. Spline intervals
We also investigated how the number of intervals used in the B-spline model influenced the quality of the reconstructed trajectory. We used the same simulated helical motion to compare localization error when the number of spline intervals was varied. In general, tracking accuracy depends both on the absolute number of recorded counts and on the absolute number of spline intervals used in the reconstruction. However, a more thorough investigation revealed that tracking accuracy is really only a function of the ratio of these two quantities. In other word, as long as each spline interval contains, on average, a fixed number of counts, tracking accuracy is independent of source activity and velocity. Figs. 6A & 6B illustrate this point very clearly and show that the same tracking accuracy (1.3 mm) is achieved irrespective of source activity and velocity.
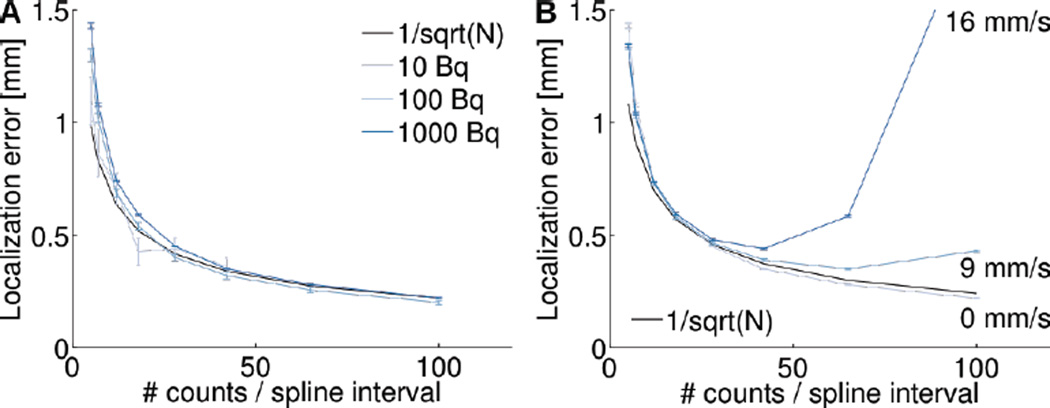
Now that it has been established that tracking accuracy only depends on one parameter, that is the number of counts per spline intervals, we investigate how tracking accuracy is related to this parameter. First, we vary the number of spline intervals used in the spline model, thus varying the number of counts per spline interval from 5 to 100. We observe that as more counts are available within each spline interval, the tracking accuracy of a static point source improves (Fig. 7A). This result is expected since more independent measurements are combined to estimate the individual spline coefficients. We also observe that the tracking accuracy is approximately proportional to , which is consistent with the averaging of N independent and identically distributed measurements.
Fig. 7.
Influence of the number of spline knots on localization error. (A) Localization error as a function of the number of spline knots for a static source containing 10, 100, and 1000 Bq. (B) Localization error as a function of the number of spline knots for a 1000 Bq source moving with a velocity of 0, 9, and 16 mm/s. Error bars from 10 realizations.
For a moving point source (1000 Bq; 9 and 16 mm/s), we observe that a similar pattern holds (Fig. 7B). With larger spline intervals, more counts are available for estimating individual spline coefficients and, therefore, the tracking accuracy improves. However, if the spline intervals are too large, the spline is too rigid and cannot represent the complex motion of the source. This highlights the need for tailoring the spline model to each application.
D. Crystal size
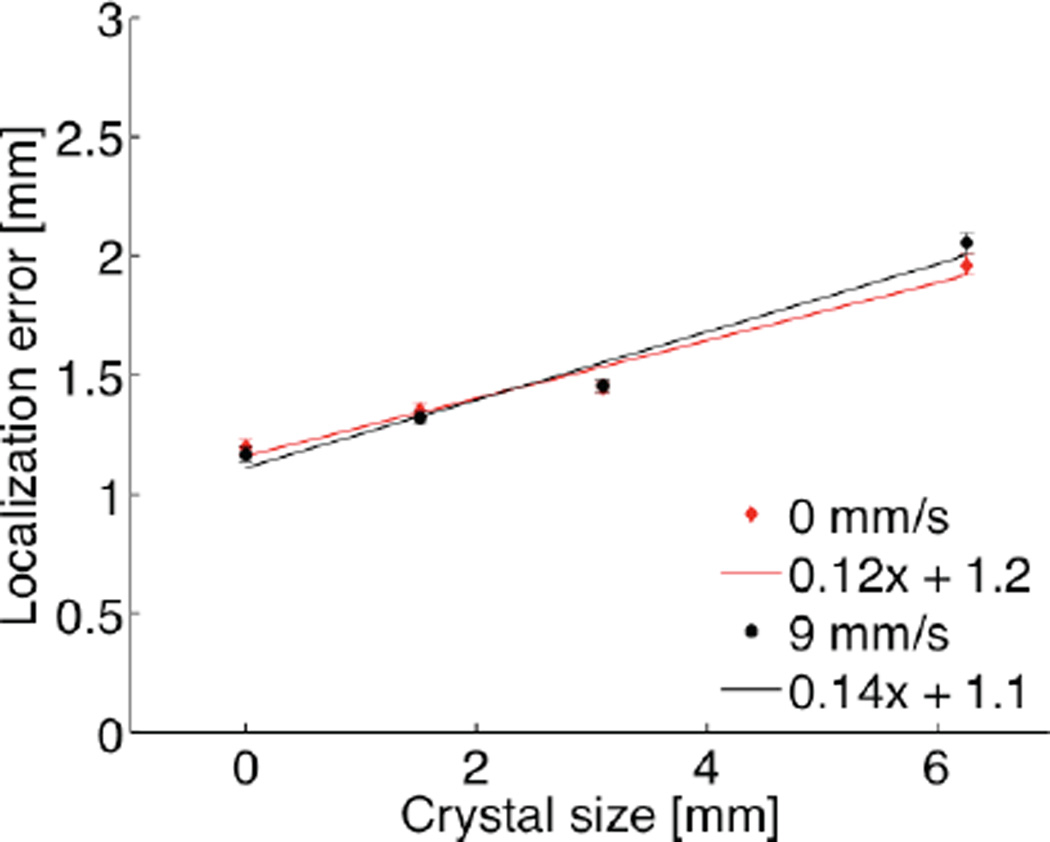
To evaluate the performance of the trajectory reconstruction algorithm, we simulated hypothetical variations of the Inveon scanner that were equipped with detector crystals of various sizes, including the standard size (1.59 mm), as well as larger crystals (3.10 and 6.28 mm, respectively). As a thought experiment, we also simulated perfect detector resolution (positron range and acolinearity effects were still included). We acquired and reconstructed list-mode data from a 100 Bq point source, which was either static or moved at 9 mm/s. Unsurprisingly, these studies showed that larger crystals lead to less accurate tracking of the point source (Fig. 8). However, we also found that the loss of tracking accuracy was quite moderate compared to the change in crystal size. Linear regression analysis show than a 1 mm increase in crystal size results in a modest 0.1 mm increase in localization error, independently of velocity.
Fig. 8.
Localization error as a function of detector crystal size, shown for a 100 Bq source moving at 0 and 9 mm/s, respectively (R2 = 0.95; Error bars from 10 independent realizations; 5 counts/spline interval).
E. Experimental validation
The spline reconstruction method was experimentally validated by reconstructing list-mode data from a moving point source scanned on an Inveon PET/CT scanner. The circular trajectory of the source can be easily recognized (Fig. 9). Notice that the rotation axis was not perfectly vertical, therefore some motion is seen along the X axis. Using Fourier analysis, we measured the rotation frequency and found it to be 0.94 and 0.31 Hz, respectively, which matches the true rotation speed (0.95 and 0.33 Hz). The average rotation radius was measured (20.1 mm) and found to be consistent with the true radius (20.8 mm). Overall, these results confirm the validity of our computer simulations.
Fig. 9.
Experimental validation using a 1000 Bq-equivalent point source. (left) Estimated position of the source as a function of time. (right) 3D representation of the reconstructed trajectory. (10 counts / spline interval)
V. DISCUSSION
In this study, we found that PET can potentially be used to track and reconstruct the trajectory of a single moving cell at the whole-body level, in a mouse. Such trajectory reconstruction methods have thus far only been used for 3D particle velocimetry in chemical engineering. Due to the unique constraints of live-cell tracking, we developed an improved tracking method that fully utilizes the fine temporal resolution of the list-mode format. Similar to PEPT, our new method performs trajectory reconstruction directly from raw list-mode measurements. Rather than an image, our method uses a B-spline to model the trajectory of a single source. This model is advantageous because it incorporates the continuous nature of spatiotemporal motion, which allowed us to achieve higher tracking accuracy.
One of the main finding of this paper is that within a “feasible range”, tracking accuracy (as defined in Eq. 6) depends primarily on a single parameter, the average number of counts per spline interval. As long as this ratio remains constant, tracking accuracy is independent of activity and velocity. In this article, we performed most of the reconstructions using 5 counts per spline interval, but larger spline intervals can be used as well (Fig. 7).
We also found that tracking accuracy is not simply equal to the spatial resolution of the PET system used for tracking (Fig. 8). For small-animal PET imaging, spatial resolution is primarily determined by the size and configuration of the detectors. Other factors such as acolinearity and positron range are negligible due to the small bore of small-animal imaging systems and the short range of 18F positrons [41]. Perhaps counter-intuitively, a given PET system can track a point source with far better accuracy than its spatial resolution would suggest. This is because the position of a source, when estimated from many independent measurements, can be known with a variance inversely proportional to the number of measurements, as clearly shown by Fig. 7. Conceptually, the 3D position of a static point source can also be estimated from a tomographic PET image with accuracy better than the spatial resolution of PET—for instance, by computing the center of mass of the image.
This concept of tracking a moving point source with high resolution using multiple low-resolution measurements has been successfully applied for localization of single molecules using fluorescence microscopy [42, 43]. Work in this area has shown that a single fluorescence molecule can be localized with spatial resolution better than the optical diffraction limit. Using this approach, the dynamic trafficking of single fluorescent molecules in live cells has been tracked with <25 nm spatial resolution [44]. The approach proposed here relies on the same fundamental principles, albeit at a different scale.
The performance of a tracking algorithm is also defined by its ability to track a fast-moving source using as few counts as possible. Empirically, we found that the feasibility of source tracking is determined by a linear relationship between the activity and velocity of the source (Fig. 6C). This relationship can be generalized to yield the range F of point sources that can be tracked:
| (7) |
where a is the source activity, v the source velocity, s the sensitivity of the PET system, and ε a parameter. The parameter ε has units of distance and can be physically interpreted as the average distance traveled by the point source between two detected counts. Thus, a tracking algorithm that achieves a higher ε requires fewer counts to successfully track a moving source. We call this parameter the tracking efficiency. This metric is largely independent of the scanner characteristics and depends only on the reconstruction parameters, that is, the number of counts per spline interval.
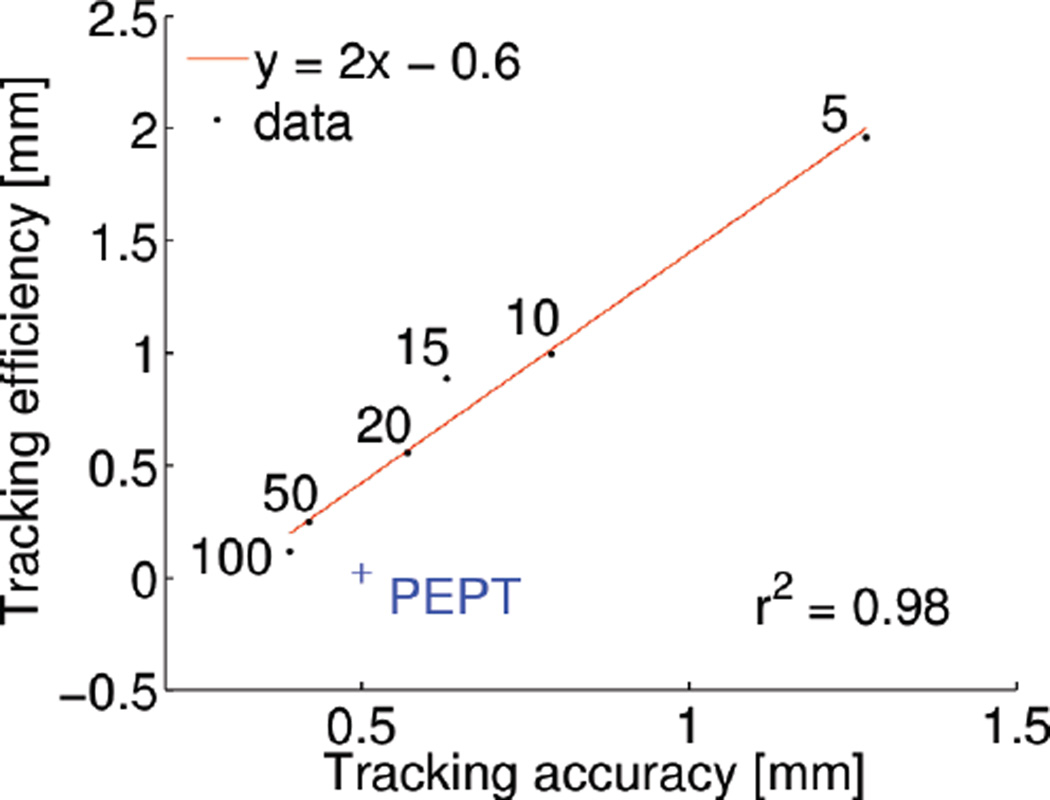
It follows from this discussion that the performance of a tracking algorithm can be fully characterized by two global metrics, the tracking accuracy and the tracking efficiency. The two metrics relate however to competing objectives, which can be balanced by adjusting the length of the spline intervals. Longer spline intervals increase tracking accuracy but hinder tracking efficiency. To better understand how these two metrics relate to each other, we reran the analysis of Fig. 6C using different spline parameters, ranging from 5 to 100 counts per spline intervals. We then computed tracking accuracy and efficiency for each spline parameterization. The results of this analysis, which are summarized in Fig. 10, show that tracking efficiency and accuracy are linearly related. An increase in tracking efficiency (beneficial) implies a linear increase in tracking accuracy (detrimental).
Fig. 10.
Trade-off between tracking efficiency and accuracy, shown for a range of spline interval length, ranging from 5 counts/interval to 100 counts/interval.
The concept of tracking accuracy and tracking efficiency can be applied to estimate how the tracking method used in PEPT would compare to spline tracking. PEPT can track a point source moving 2 m/s with accuracy as low as 0.5 mm, using 105 counts/s [45]. Based on these numbers, the tracking efficiency of PEPT is approximately 0.02 mm. As shown on Fig. 10, the spline tracking method can achieve similar accuracy but 20-fold better efficiency, meaning that a fast-moving source can be tracked using 20 times fewer counts. This finding is significant, given that radiolabeling efficiency is the limiting factor for tracking single cells. The better tracking efficiency is achieved by representing the motion of the source using a smooth spline function rather than a discrete number of static positions. On the other hand, it should also be mentioned that PEPT acquisitions tend to suffer from a higher rate of scatter and randoms, which could also be a factor contributing to the lower tracking efficiency.
Having established the requirements for tracking a single point source in silico, we would like to comment on how this method translates into the real world. As shown in Fig. 9, at high activity levels, our experimental findings are fully consistent with our simulation results. However, at low activity levels, a discrepancy arises due to the fact that our computer simulations do not account for the natural radioactivity of 176Lu, which is present in LSO detectors (natural abundance, 2.6%). This isotope decays with a half-life of 3.8×10¹⁰ years by emitting a beta particle (endpoint energy of 596 keV) and a cascade of prompt gamma photons (primarily 202 and 307 keV). This intrinsic radioactivity yields a background coincidence rate that may overshadow the weak signal from a single radiolabeled cell. A study of the Inveon found that the count rate from intrinsic 176Lu decay was equivalent to a 100 Bq source (lower-level discriminator of 400 keV) [46]. Therefore, our opinion is that single-cell tracking will ultimately be limited to PET systems built from non-lutecium scintillator materials, such as bismuth germinate (BGO) or lanthanum bromide (LaBr3). As found in a recent comparison study, the background rate in a clinical BGO PET scanner is 1000 times lower than in an equivalent LSO scanner [47]. This suggests that <1 Bq equivalent background rate could be achieved for a small-animal scanner equipped with BGO detectors. Although most pre-clinical PET systems use LSO scintillators, we are aware of at least one system that uses BGO detectors [48].
This article studied the feasibility of tracking a single moving source in the context of in vivo cell tracking. However, we are also contemplating using this method for other applications. For instance, the trajectory reconstruction algorithm may be a useful tool for estimating breathing motion during 4D PET/CT imaging. This approach could provide a data-driven method for gating the reconstruction of the emission images [49]. Another application where tracking may be useful is in emission-guided radiation therapy, a recently proposed technique in which radiotracer uptake is used to estimate tumor position in real time during delivery of radiation therapy [50, 51].
Reconstructing the trajectory of a single cell may also have clinical applications. A growing number of clinical studies are using PET imaging to track cells during cell-based therapies [52–55]. The ability to track and reconstruct the trajectory of single cells may reveal new dynamic behaviors of cells following their transplantation in vivo. From a conceptual standpoint, the proposed trajectory reconstruction algorithm could be applied to whole-body clinical PET scanners. However, the configuration of these scanners is less amenable to single-cell tracking. Clinical PET scanners have lower sensitivity and higher scatter fraction than preclinical systems. This may hinder the precise localization of a weakly emitting cell [56]. Furthermore, a clinical scanner has limited axial coverage and cannot follow the circulation of a cell at the whole-body level. Despites these drawbacks, tracking single sources may be possible with clinical scanners but it will likely require labeling the cells with higher activity. Time-of-flight information could also be used within this framework to increase the accuracy of the localization.
VI. CONCLUSION
Using computer simulations, we tested the performance of a novel algorithm designed to estimate the spatiotemporal trajectory of a moving source directly from list-mode PET data. The algorithm was also successfully tested using experimentally acquired PET data. This algorithm models the trajectory of the source as a 3D spline of the temporal variable and does not require tomographic images to be reconstructed in the conventional sense. The main finding of our study can be summarized by the following equation, which relates the best achievable tracking accuracy to the activity and velocity of the source, and to the sensitivity of the PET system:
| (8) |
Our future investigations will focus on developing new approaches for tracking multiple moving sources simultaneously.
Supplementary Material
Acknowledgements
The Monte Carlo model used in this work was based on a GATE script written by Arda Konik (University of Massachusetts Medical School). We would also like to thank Arne Vandenbroucke for help with image reconstruction.
This work was supported in part by a developmental grant from the Stanford In vivo and Cellular Molecular Imaging Center (5P50CA114747) and by a NIH R21 grant (R21HL127900).
Footnotes
This paper has supplementary downloadable material available at http://ieeexplore.ieee.org, provided by the authors. This includes one multimedia MPEG-4 movie file, which shows examples of source tracking using PET. This material is 20.6 MB in size.
Contributor Information
Keum Sil Lee, Department of Radiology, Stanford University, CA 94305 USA.
Tae Jin Kim, Department of Radiation Oncology, Stanford University, CA 94305 USA.
Guillem Pratx, Email: pratx@stanford.edu, Department of Radiation Oncology, Stanford University, CA 94305 USA.
References
- 1.Rogers J, Harrop R, Kinahan P. The theory of three-dimensional image reconstruction for PET. IEEE Trans Med Imag. 1986;6:239–243. doi: 10.1109/TMI.1987.4307832. [DOI] [PubMed] [Google Scholar]
- 2.Leahy RM, Qi J. Statistical approaches in quantitative positron emission tomography. Stat Comput. 2000;10:147–165. [Google Scholar]
- 3.Lewitt RM, Matej S. Overview of methods for image reconstruction from projections in emission computed tomography. Proc IEEE. 2003;91:1588–1611. [Google Scholar]
- 4.Hoshino K, Ly HQ, Frangioni JV, Hajjar RJ. In vivo tracking in cardiac stem cell-based therapy. Prog Cardiovasc Dis. 2007;49:414–420. doi: 10.1016/j.pcad.2007.02.005. [DOI] [PubMed] [Google Scholar]
- 5.Kircher MF, Gambhir SS, Grimm J. Noninvasive cell-tracking methods. Nat Rev Clin Oncol. 2011 Nov;8:677–688. doi: 10.1038/nrclinonc.2011.141. [DOI] [PubMed] [Google Scholar]
- 6.Ruggiero A, Thorek DL, Guenoun J, Krestin GP, Bernsen MR. Cell tracking in cardiac repair: what to image and how to image. Eur Radiol. 2012;22:189–204. doi: 10.1007/s00330-011-2190-7. [DOI] [PMC free article] [PubMed] [Google Scholar]
- 7.Zhang SJ, Wu JC. Comparison of imaging techniques for tracking cardiac stem cell therapy. J Nucl Med. 2007;48:1916–1919. doi: 10.2967/jnumed.107.043299. [DOI] [PMC free article] [PubMed] [Google Scholar]
- 8.Doherty PW, Bushberg JT, Lipton MJ, Meares CF, Goodwin DA. The Use of lndium-111-Labeled Leukocytes for Abscess Detection. Clin Nucl Med. 1978;3:108–110. doi: 10.1097/00003072-197803000-00008. [DOI] [PubMed] [Google Scholar]
- 9.Soria B, Skoudy A, Martin F. From stem cells to beta cells: new strategies in cell therapy of diabetes mellitus. Diabetologia. 2001;44:407–415. doi: 10.1007/s001250051636. [DOI] [PubMed] [Google Scholar]
- 10.Garbern JC, Lee RT. Cardiac Stem Cell Therapy and the Promise of Heart Regeneration. Cell Stem Cell. 2013;12:689–698. doi: 10.1016/j.stem.2013.05.008. [DOI] [PMC free article] [PubMed] [Google Scholar]
- 11.Goldman S. Stem and progenitor cell–based therapy of the human central nervous system. Nat Biotech. 2005;23:862–871. doi: 10.1038/nbt1119. [DOI] [PubMed] [Google Scholar]
- 12.Liu W, Frank JA. Detection and quantification of magnetically labeled cells by cellular MRI. Eur J Radiol. 2009;70:258–264. doi: 10.1016/j.ejrad.2008.09.021. [DOI] [PMC free article] [PubMed] [Google Scholar]
- 13.Rogers WJ, Meyer CH, Kramer CM. Technology insight: in vivo cell tracking by use of MRI. Nat Clin Pract Card. 2006;3:554–562. doi: 10.1038/ncpcardio0659. [DOI] [PubMed] [Google Scholar]
- 14.Shapiro EM, Skrtic S, Koretsky AP. Sizing it up: Cellular MRI using micron-sized iron oxide particles. Magn Reson Med. 2005;53:329–338. doi: 10.1002/mrm.20342. [DOI] [PubMed] [Google Scholar]
- 15.Adonai N, Nguyen KN, Walsh J, Iyer M, Toyokuni T, Phelps ME, et al. Ex vivo cell labeling with 64Cu–pyruvaldehyde-bis(N4-methylthiosemicarbazone) for imaging cell trafficking in mice with positron-emission tomography. P Natl Aacad Sci USA. 2002 Mar 5;99:3030–3035. doi: 10.1073/pnas.052709599. 2002. [DOI] [PMC free article] [PubMed] [Google Scholar]
- 16.Melder RJ, Elmaleh D, Brownell AL, Brownell GL, Jain RK. A method for labeling cells for positron emission tomography (PET) studies. J Immunol Methods. 1994;175:79–87. doi: 10.1016/0022-1759(94)90333-6. [DOI] [PubMed] [Google Scholar]
- 17.Aicher A, Brenner W, Zuhayra M, Badorff C, Massoudi S, Assmus B, et al. Assessment of the tissue distribution of transplanted human endothelial progenitor cells by radioactive labeling. Circulation. 2003 Apr 29;107:2134–2139. doi: 10.1161/01.CIR.0000062649.63838.C9. [DOI] [PubMed] [Google Scholar]
- 18.Stodilka RZ, Blackwood KJ, Kong H, Prato FS. A method for quantitative cell tracking using SPECT for the evaluation of myocardial stem cell therapy. Nucl Med Commun. 2006;27:807–813. doi: 10.1097/01.mnm.0000237987.31597.cf. [DOI] [PubMed] [Google Scholar]
- 19.Chin B, Nakamoto Y, Bulte JW, Pittenger M, Wahl R, Kraitchman D. 111In oxine labelled mesenchymal stem cell SPECT after intravenous administration in myocardial infarction. Nucl Med Commun. 2003;24:1149–1154. doi: 10.1097/00006231-200311000-00005. [DOI] [PubMed] [Google Scholar]
- 20.Sutton EJ, Henning TD, Pichler BJ, Bremer C, Daldrup-Link HE. Cell tracking with optical imaging. Eur Radiol. 2008;18:2021–2032. doi: 10.1007/s00330-008-0984-z. [DOI] [PubMed] [Google Scholar]
- 21.Yamauchi K, Yang M, Jiang P, Yamamoto N, Xu M, Amoh Y, et al. Real-time in vivo dual-color imaging of intracapillary cancer cell and nucleus deformation and migration. Cancer Res. 2005;65:4246–4252. doi: 10.1158/0008-5472.CAN-05-0069. [DOI] [PubMed] [Google Scholar]
- 22.Heyn C, Ronald JA, Ramadan SS, Snir JA, Barry AM, MacKenzie LT, et al. In vivo MRI of cancer cell fate at the single-cell level in a mouse model of breast cancer metastasis to the brain. Magn Reson Med. 2006 Nov;56:1001–1010. doi: 10.1002/mrm.21029. [DOI] [PubMed] [Google Scholar]
- 23.Hinds KA, Hill JM, Shapiro EM, Laukkanen MO, Silva AC, Combs CA, et al. Highly efficient endosomal labeling of progenitor and stem cells with large magnetic particles allows magnetic resonance imaging of single cells. Blood. 2003;102:867–872. doi: 10.1182/blood-2002-12-3669. [DOI] [PubMed] [Google Scholar]
- 24.Nichols TE, Qi J, Asma E, Leahy RM. Spatiotemporal reconstruction of list-mode PET data. IEEE Trans Med Imag. 2002;21:396–404. doi: 10.1109/TMI.2002.1000263. [DOI] [PubMed] [Google Scholar]
- 25.Reader AJ, Sureau FC, Comtat C, Trébossen R, Buvat I. Joint estimation of dynamic PET images and temporal basis functions using fully 4D ML-EM. Phys Med Biol. 2006;51:5455. doi: 10.1088/0031-9155/51/21/005. [DOI] [PubMed] [Google Scholar]
- 26.Rahmim A, Tang J, Zaidi H. Four-dimensional (4D) image reconstruction strategies in dynamic PET: beyond conventional independent frame reconstruction. Med Phys. 2009;36:3654–3670. doi: 10.1118/1.3160108. [DOI] [PubMed] [Google Scholar]
- 27.Wernick MN, Infusino EJ, Milosevic M. Fast spatio-temporal image reconstruction for dynamic PET. IEEE Trans Med Imag. 1999;18:185–195. doi: 10.1109/42.764885. [DOI] [PubMed] [Google Scholar]
- 28.Bemrose C, Fowles P, Hawkesworth M, O'dwyer M. Application of positron emission tomography to particulate flow measurement in chemical engineering processes. Nucl Instrum Meth A. 1988;273:874–880. [Google Scholar]
- 29.Parker D, Broadbent C, Fowles P, Hawkesworth M, McNeil P. Positron emission particle tracking-a technique for studying flow within engineering equipment. Nucl Instrum Meth A. 1993;326:592–607. [Google Scholar]
- 30.Barigou M, Fairhurst P, Fryer P, Pain J-P. Concentric flow regime of solid–liquid food suspensions: theory and experiment. Chem Eng Sci. 2003;58:1671–1686. [Google Scholar]
- 31.Yang Z, Fryer P, Bakalis S, Fan X, Parker D, Seville J. An improved algorithm for tracking multiple, freely moving particles in a positron emission particle tracking system. Nucl Instrum Meth A. 2007;577:585–594. [Google Scholar]
- 32.Pratx G, Chen K, Sun C, Martin L, Carpenter CM, Olcott PD, et al. Radioluminescence Microscopy: Measuring the Heterogeneous Uptake of Radiotracers in Single Living Cells. PLOS One. 2012;7:e46285. doi: 10.1371/journal.pone.0046285. [DOI] [PMC free article] [PubMed] [Google Scholar]
- 33.Pratx G, Chen K, Sun C, Axente M, Sasportas L, Carpenter C, et al. High-Resolution Radioluminescence Microscopy of 18F-FDG Uptake by Reconstructing the beta-Ionization Track. J Nucl Med. 2013 Oct;54:1841–1846. doi: 10.2967/jnumed.112.113365. [DOI] [PMC free article] [PubMed] [Google Scholar]
- 34.Cui J, Pratx G, Prevrhal S, Levin CS. Fully 3D list-mode time-of-flight PET image reconstruction on GPUs using CUDA. Med Phys. 2011;38:6775. doi: 10.1118/1.3661998. [DOI] [PubMed] [Google Scholar]
- 35.Parra L, Barrett HH. List-mode likelihood: EM algorithm and image quality estimation demonstrated on 2-D PET. IEEE Trans Med Imag. 1998;17:228–235. doi: 10.1109/42.700734. [DOI] [PMC free article] [PubMed] [Google Scholar]
- 36.Pratx G, Surti S, Levin C. Fast List-Mode Reconstruction for Time-of-Flight PET Using Graphics Hardware. IEEE Trans Nucl Sci. 2011:1–1. [Google Scholar]
- 37.Committee AM. Robust statistics–how not to reject outliers. Part 1. Basic concepts. Analyst. 1989;114:1693–1697. [Google Scholar]
- 38.Jan S, Santin G, Strul D, Staelens S, Assie K, Autret D, et al. GATE: a simulation toolkit for PET and SPECT. Phys Med Biol. 2004;49:4543. doi: 10.1088/0031-9155/49/19/007. [DOI] [PMC free article] [PubMed] [Google Scholar]
- 39.Konik A, Madsen M, Sunderland J. GATE simulations of human and small animal PET for determination of scatter fraction as a function of object size. IEEE Trans Nucl Sci. 2010;57:2558–2563. [Google Scholar]
- 40.Ganong WF, Barrett KE. Review of medical physiology. Vol. 21. New York: McGraw-Hill Medical; 2005. [Google Scholar]
- 41.Levin CS, Hoffman EJ. Calculation of positron range and its effect on the fundamental limit of positron emission tomography system spatial resolution. Phys Med Biol. 1999;44:781. doi: 10.1088/0031-9155/44/3/019. [DOI] [PubMed] [Google Scholar]
- 42.Mortensen KI, Churchman LS, Spudich JA, Flyvbjerg H. Optimized localization analysis for single-molecule tracking and super-resolution microscopy. Nat Meth. 2010;7:377–381. doi: 10.1038/nmeth.1447. [DOI] [PMC free article] [PubMed] [Google Scholar]
- 43.Betzig E, Patterson GH, Sougrat R, Lindwasser OW, Olenych S, Bonifacino JS, et al. Imaging Intracellular Fluorescent Proteins at Nanometer Resolution. Science. 2006 Sep 15;313:1642–1645. doi: 10.1126/science.1127344. 2006. [DOI] [PubMed] [Google Scholar]
- 44.Manley S, Gillette JM, Patterson GH, Shroff H, Hess HF, Betzig E, et al. High-density mapping of single-molecule trajectories with photoactivated localization microscopy. Nat Meth. 2008;5:155–157. doi: 10.1038/nmeth.1176. [DOI] [PubMed] [Google Scholar]
- 45.Barigou M. Particle tracking in opaque mixing systems: an overview of the capabilities of PET and PEPT. Chem Eng Res Des. 2004;82:1258–1267. [Google Scholar]
- 46.Bao Q, Chatziioannou AF. Estimation of the minimum detectable activity of preclinical PET imaging systems with an analytical method. Med Phys. 2010;37:6070–6083. doi: 10.1118/1.3495817. [DOI] [PMC free article] [PubMed] [Google Scholar]
- 47.Freedenberg MI, Badawi RD, Tarantal AF, Cherry SR. Performance and limitations of positron emission tomography (PET) scanners for imaging very low activity sources. Phys Medica. 2014;30:104–110. doi: 10.1016/j.ejmp.2013.04.001. [DOI] [PMC free article] [PubMed] [Google Scholar]
- 48.Herrmann K, Dahlbom M, Nathanson D, Wei L, Radu C, Chatziioannou A, et al. Evaluation of the Genisys4, a bench-top preclinical PET scanner. J Nucl Med. 2013;54:1162–1167. doi: 10.2967/jnumed.112.114926. [DOI] [PMC free article] [PubMed] [Google Scholar]
- 49.Nehmeh SA, Erdi YE. Respiratory motion in positron emission tomography/computed tomography: a review. Sem Nucl Med. 2008;38:167–176. doi: 10.1053/j.semnuclmed.2008.01.002. [DOI] [PubMed] [Google Scholar]
- 50.Fan Q, Nanduri A, Yang J, Yamamoto T, Loo B, Graves E, et al. Toward a planning scheme for emission guided radiation therapy (EGRT): FDG based tumor tracking in a metastatic breast cancer patient. Med Phys. 2013;40:081708. doi: 10.1118/1.4812427. [DOI] [PMC free article] [PubMed] [Google Scholar]
- 51.Tashima H, Yamaya T, Yoshida E, Kinouchi S, Watanabe M, Tanaka E. A single-ring OpenPET enabling PET imaging during radiotherapy. Phys Med Biol. 2012;57:4705. doi: 10.1088/0031-9155/57/14/4705. [DOI] [PubMed] [Google Scholar]
- 52.Kang WJ, Kang H-J, Kim H-S, Chung J-K, Lee MC, Lee DS. Tissue distribution of 18F-FDG-labeled peripheral hematopoietic stem cells after intracoronary administration in patients with myocardial infarction. J Nucl Med. 2006;47:1295–1301. [PubMed] [Google Scholar]
- 53.Ritchie D, Mileshkin L, Wall D, Bartholeyns J, Thompson M, Coverdale J, et al. In vivo tracking of macrophage activated killer cells to sites of metastatic ovarian carcinoma. Cancer Immunol Immunother. 2007;56:155–163. doi: 10.1007/s00262-006-0181-3. [DOI] [PMC free article] [PubMed] [Google Scholar]
- 54.Oku N, Koike C, Sugawara M, Tsukada H, Irimura T, Okada S. Positron emission tomography analysis of metastatic tumor cell trafficking. Cancer Res. 1994;54:2573–2576. [PubMed] [Google Scholar]
- 55.Doyle B, Kemp BJ, Chareonthaitawee P, Reed C, Schmeckpeper J, Sorajja P, et al. Dynamic tracking during intracoronary injection of 18F-FDG-labeled progenitor cell therapy for acute myocardial infarction. J Nucl Med. 2007 Oct;48:1708–1714. doi: 10.2967/jnumed.107.042838. [DOI] [PubMed] [Google Scholar]
- 56.Fischer BM, Olsen MW, Ley CD, Klausen TL, Mortensen J, Hojgaard L, et al. How few cancer cells can be detected by positron emission tomography? A frequent question addressed by an in vitro study. Eur J Nucl Med Mol Imaging. 2006 Jun;33:697–702. doi: 10.1007/s00259-005-0038-6. [DOI] [PubMed] [Google Scholar]
Associated Data
This section collects any data citations, data availability statements, or supplementary materials included in this article.


