Abstract
The RNA-guided endonuclease Cas9 has emerged as a versatile genome-editing platform. However, the size of the commonly used Cas9 from Streptococcus pyogenes (SpCas9) limits its utility for basic research and therapeutic applications that employ the highly versatile adeno-associated virus (AAV) delivery vehicle. Here, we characterize six smaller Cas9 orthologs and show that Cas9 from Staphylococcus aureus (SaCas9) can edit the genome with efficiencies similar to those of SpCas9, while being >1kb shorter. We packaged SaCas9 and its sgRNA expression cassette into a single AAV vector and targeted the cholesterol regulatory gene Pcsk9 in the mouse liver. Within one week of injection, we observed >40% gene modification, accompanied by significant reductions in serum Pcsk9 and total cholesterol levels. We further demonstrate the power of using BLESS to assess the genome-wide targeting specificity of SaCas9 and SpCas9, and show that SaCas9 can mediate genome editing in vivo with high specificity.
Introduction
Cas9, an RNA-guided endonuclease derived from the Type II CRISPR-Cas bacterial adaptive immune system1–7, has been harnessed for genome editing8,9 and holds tremendous promise for biomedical research. Genome editing of somatic tissue in post-natal animals, however, has been limited in part by the challenge of delivering Cas9 in vivo. For this purpose, adeno-associated virus (AAV) vectors are attractive vehicles10 because of their low immunogenic potential, reduced oncogenic risk from host-genome integration11, and broad-range of serotype specificity12–15. Nevertheless, the restrictive cargo size (~4.5kb) of AAV presents an obstacle for packaging the commonly used Streptococcus pyogenes Cas9 (SpCas9, ~4.2kb) and its sgRNA in a single vector; although technically feasible16,17, this approach leaves little room for customized expression and control elements.
In search of smaller Cas9 enzymes for efficient in vivo delivery by AAV, we have previously described a short Cas9 from the CRISPR1 locus of Streptococcus thermophilus LMD-9 (St1Cas9, ~3.3kb)8 as well as a rationally-designed truncated form of SpCas918 for genome editing in human cells. However, both systems have important practical drawbacks: the former requires a complex Protospacer-Associated Motif (PAM) sequence (NNAGAAW)3, which restricts the range of accessible targets, whereas the latter exhibits reduced activity. Given the substantial diversity of CRISPR-Cas systems present in sequenced microbial genomes19, we therefore sought to interrogate and discover additional Cas9 enzymes that are small, efficient, and broadly targeting.
In vitro cleavage by small Cas9s
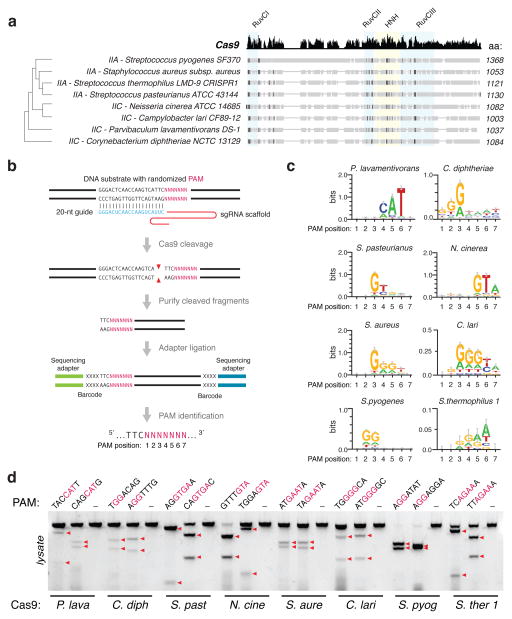
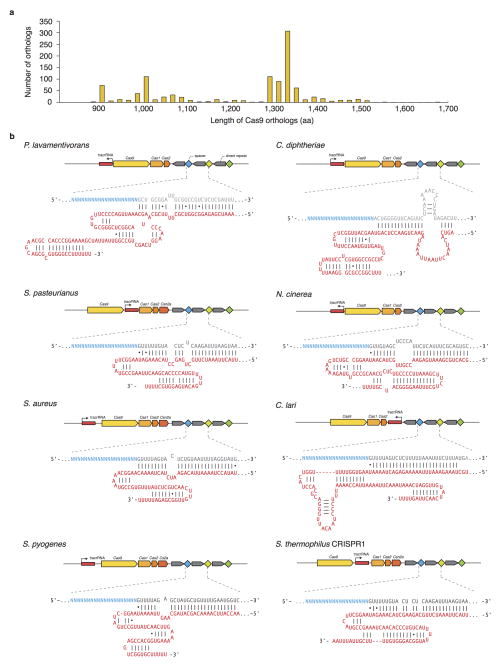
Type II CRISPR-Cas systems require only two main components for eukaryotic genome editing: a Cas9 enzyme, and a chimeric single guide RNA (sgRNA)6 derived from the CRISPR RNA (crRNA) and the noncoding trans-activating crRNA (tracrRNA)4,20. Analysis of over 600 Cas9 orthologs shows that these enzymes are clustered into two length groups with characteristic protein sizes of approximately 1350aa and 1000aa residues, respectively19,21 (Extended Data Fig. 1a), with shorter Cas9s having significantly truncated REC domains (Fig. 1a). From these shorter Cas9s, which belong to Type IIA and IIC subtypes, we selected six candidates for profiling (Fig. 1a and Extended Data Fig. 1b). To determine the cognate crRNA and tracrRNA for each Cas9, we computationally identified regularly interspaced repeat sequences (direct repeats) within a 2-kb window flanking the CRISPR locus. We then predicted the tracrRNA by detecting sequences with strong complementarity to the direct repeat sequence (an anti-repeat region), at least two predicted stem-loop structures, and a Rho-independent transcriptional termination signal up to 150-nt downstream of the anti-repeat region. Although a truncated tracrRNA can support robust DNA cleavage in vitro6, previous reports show that the secondary structures of the tracrRNA are important for Cas9 activity in mammalian cells8,9,18,22. Therefore, we designed sgRNA scaffolds for each ortholog by fusing the 3′ end of a truncated direct repeat with the 5′ end of the corresponding tracrRNA, including the full-length tail, via a 4-nt linker6 (Extended Data Fig. 1b and Supplementary Table 1). To identify the PAM sequence for each Cas9, we first constructed a library of plasmid DNA containing a constant 20-bp target followed by a degenerate 7-bp sequence (5′-NNNNNNN). We then incubated cell lysate from human embryonic kidney 293FT (293FT) cells expressing the Cas9 ortholog with its in vitro transcribed sgRNA and the plasmid library. By generating a consensus from the 7-bp sequence found on successfully cleaved DNA plasmids (Fig. 1b), we determined putative PAMs for each Cas9 (Fig. 1c). We observed that, similar to SpCas9, most Cas9 orthologs cleaved targets 3-bp upstream of the PAM (Extended Data Fig. 2). To validate each putative PAM from the library, we then incubated a DNA template bearing the consensus PAM with cell lysate and the corresponding sgRNA. We found that the Cas9 orthologs, in combination with the sgRNA designs, successfully cleaved the appropriate targets (Fig. 1d and Supplementary Table 2).
Figure 1. Biochemical screen for small Cas9 orthologs.
a, Phylogenetic tree of selected Cas9 orthologs. Subfamily and sizes (amino acids) are indicated, with nuclease domains highlighted in colored boxes, and conserved sequences in black. b, Schematic illustration of the in vitro cleavage-based method used to identify the first seven positions (5′-NNNNNNN) of protospacer adjacent motifs (PAMs). c, Consensus PAMs for eight Cas9 orthologs from sequencing of cleaved fragments. Error bars are Bayesian 95% confidence interval45. d, Cleavage using different orthologs and sgRNAs targeting loci bearing the putative PAMs (consensus shown in red). Red triangles indicate cleavage fragments.
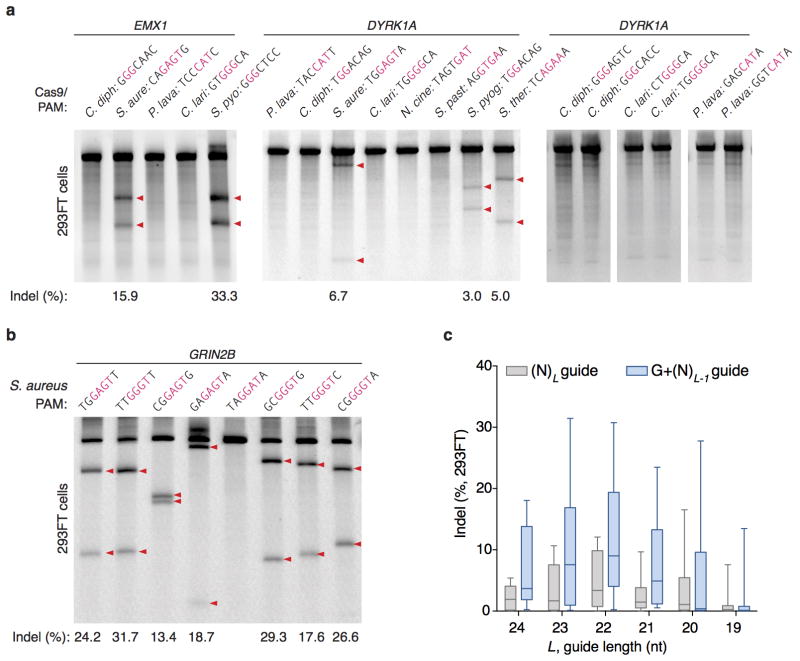
To test whether each Cas9 ortholog can facilitate genome editing in mammalian cells, we co-transfected 293FT cells with individual Cas9s and their respective sgRNAs targeting human endogenous loci containing the appropriate PAMs. Of the six Cas9 orthologs tested, only the one from Staphylococcus aureus (SaCas9) produced indels with efficiencies comparable to those of SpCas9 (Extended Data Fig. 3a, b and Supplementary Table 3), suggesting that DNA-cleavage activity in cell-free assays does not necessarily reflect the activity in mammalian cells. These observations prompted us to focus on harnessing SaCas9 and its sgRNA for in vivo applications.
SaCas9 sgRNA design and PAM discovery
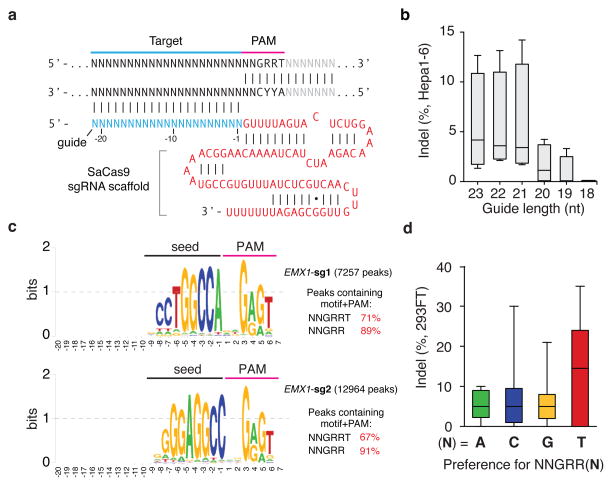
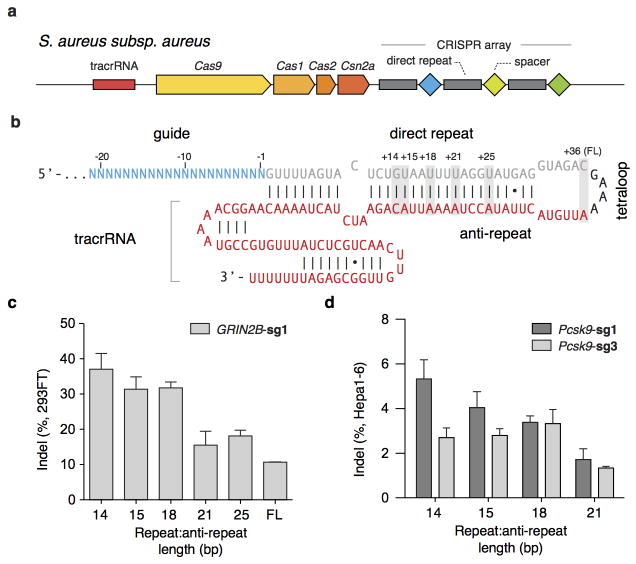
Although mature crRNAs in S. pyogenes are processed to contain 20-nt spacers (guides) and 19- to 22-nt direct repeats4, RNA sequencing of crRNAs from other organisms reveals that the spacer and direct repeat sequence lengths can vary4,20,23. We therefore tested sgRNAs for SaCas9 with variable guide lengths and repeat:anti-repeat duplexes. We found that SaCas9 achieves the highest editing efficiency in mammalian cells with guides between 21- to 23-nt long and can accommodate a range of lengths for the direct repeat:anti-repeat region (Fig. 2a, b, Extended Data Fig. 4). This notably contrasts with SpCas9, where the natural 20-nt guide length can be truncated to 17-nt without significantly compromising nuclease activity, while increasing specificity24. Additionally, replacing the first base of the guide with guanine further improved SaCas9 activity (Extended Data Fig. 3c).
Figure 2. Characterization of Staphylococcus aureus Cas9 (SaCas9) in 293FT cells.
a, SaCas9 sgRNA scaffold (red) and guide (blue) base-pairing at target locus (black) immediately 5′ of PAM. b, Box-whisker plot showing indels vary depending on the length of the guide sequence (n=4). c, dSaCas9-ChIP reveals peaks associated with seed + PAM. Text to the right indicates the total number of peaks and percentage containing significant (FDR < 0.1) match to the guide motif followed by NNGRRT PAMs. d, Pooled indel values for NNGRR(A), (C), (G), or (T) PAM combinations (n=12, 21, 39, and 44 respectively).
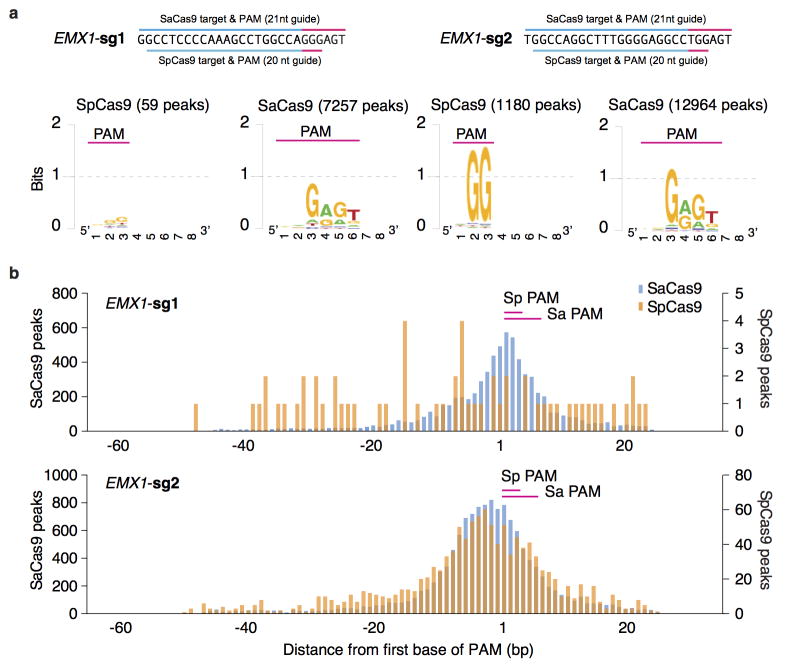
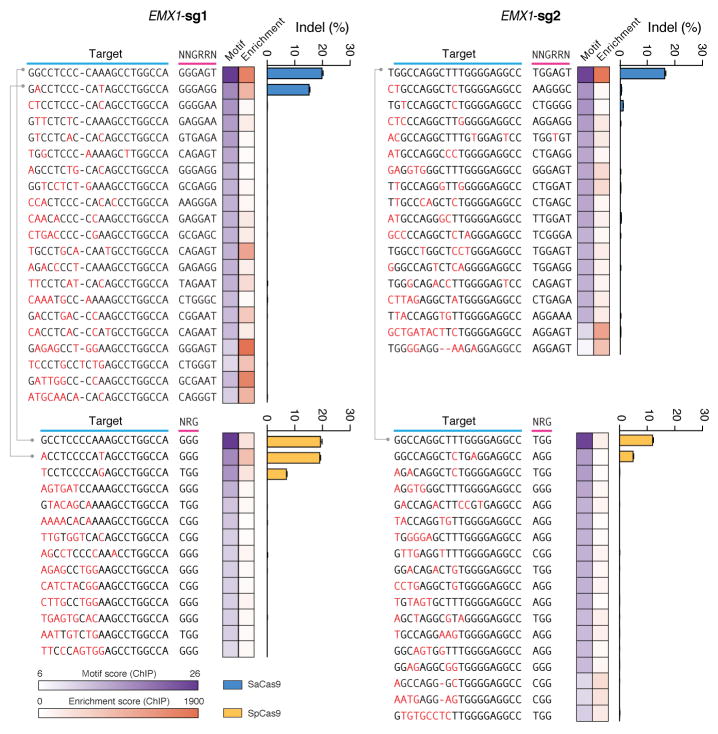
To fully characterize the SaCas9 PAM and the seed region within its guide sequence25, we performed ChIP using catalytically mutant forms of SaCas9 (dSaCas9, D10A and N580A mutations, based on homology to SpCas9) or SpCas9 (dSpCas9, D10A and H840A mutations) and their corresponding sgRNAs. We targeted two loci in the human EMX1 gene with composite NGGRRT PAMs, which allow targeting by both Cas9 variants. A search for motifs containing both the guide region and PAM within 50-nt of the ChIP peak summits revealed seed sequences of 7–8 nt for dSaCas9 (Fig. 2c). In addition, NNGRRT and NGG PAMs were found adjacent to the seed sequences for dSaCas9 and dSpCas9, respectively (Extended Data Fig. 5). Although the 6th position of the PAM is predominantly thymine, we did observe low levels of degeneracy in both the biochemical and ChIP-based PAM discovery assays (Fig. 1c and Extended Data Fig. 5a). We therefore tested the base preference for this position and determined that although SaCas9 cleaves genomic targets most efficiently with NNGRRT, all NNGRR PAMs can be cleaved and should be considered as potential targets, especially in the context of off-target evaluations (Fig. 2d, Extended Data Fig. 6, and Supplementary Table 4).
Unbiased profiling of Cas9 specificity
As advances in Cas9 technology promise to enable a broad range of in vivo and therapeutic applications, accurate, genome-wide identification of off-target nuclease activity has become increasingly important. Although a number of studies have employed sequence similarity-based off-target search22,26–30 or dCas9-ChIP31,32 to predict off-target sites for Cas9, such approaches cannot assess the nuclease activity of Cas9 in a comprehensive and unbiased manner. To directly measure the genome-wide cleavage activity of SaCas9 and SpCas9, we applied BLESS (direct in situ breaks labeling, enrichment on streptavidin and next-generation sequencing)33 to capture Cas9-induced DNA double-stranded breaks (DSBs) in cells. We transfected 293FT cells with SaCas9 or SpCas9 and the same EMX1 targeting guides used in the previous ChIP experiment, or pUC19 as negative controls. After cells are fixed, free genomic DNA ends from DSBs are captured using biotinylated adaptors and analyzed by deep sequencing (Fig. 3a). To identify candidate Cas9-induced DSB sites genome-wide, we established a three-step analysis pipeline following alignment of the sequenced BLESS reads to the genome (Extended Data Fig. 7a, Supplementary Discussion). First, we applied nearest-neighbor clustering on the aligned reads to identify groups of DSBs (DSB clusters) across the genome. Second, we sought to separate potential Cas9-induced DSB clusters from background DSB clusters resulting from low frequency biological processes and technical artifacts, as well as high frequency telomeric and centromeric DSB hotspots33. From the on-target and a small subset of verified off-target sites (predicted by sequence similarity using a previously established method22 and sequenced to detect indels), we found that reads in Cas9-induced DSB clusters mapped to characteristic, well-defined genomic positions compared to the more diffuse alignment pattern at background DSB clusters. To distinguish between the two types of DSB clusters, we calculated in each cluster the distance between all possible pairs of forward and reverse-oriented reads (corresponding to 3′ and 5′ ends of DSBs), and filtered out the background DSB clusters based on the distinctive pairwise-distance distribution of these clusters (Extended Data Fig. 7b, c). Third, the DSB score for a given locus was calculated by comparing the count of DSBs in the experimental and negative control samples using a maximum-likelihood estimate (MLE)22 (Supplementary Discussion). This analysis identified the on-target loci for both SaCas9 and SpCas9 guides as the top scoring sites, and revealed additional sites with high DSB scores (Fig. 3b–d).
Figure 3. Characterization of genome-wide nuclease activity of SaCas9 and SpCas9.
a, Schematic of BLESS processing steps. b, Manhattan plots of genome-wide DSB clusters generated by each Cas9 and sgRNA pair, with on-target loci shown above. c, Correlation between DSB scores and indel levels for top-scoring DSB clusters. Trendlines, r2, and p-values are calculated using ordinary least squares. d, Off-target loci from BLESS with detectable indels through targeted deep sequencing (n=3) are shown. Heatmaps indicate DSB score (blue), motif score from ChIP (purple), or sequence similarity score (green) for each locus. Blue triangles indicate peak positions of BLESS signal.
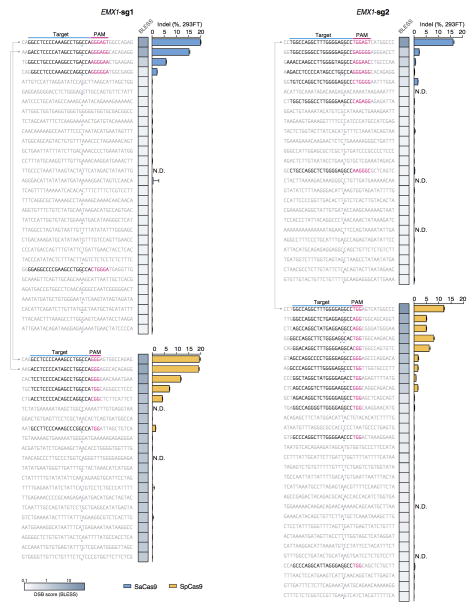
Next, we sought to assess whether DSB scores correlated with indel formation. We used targeted deep sequencing to detect indel formation on the ~30 top-ranking off-target sites identified by BLESS for each Cas9 and sgRNA combination. We found that only those sites that contained PAM and homology to the guide sequence exhibited indels (Extended Data Fig. 8). We observed a strong linear correlation between DSB scores and indel levels for each Cas9 and sgRNA pairing (r2 = 0.948 and 0.989 for the two EMX1 targets with SaCas9 and r2 = 0.941 and 0.753 for those with SpCas9) (Fig. 3c, Extended Fig. 9b–d). Furthermore, BLESS identified additional off-target sites not previously predicted by sequence similarity to target or ChIP (Extended Data Fig. 7 and 9, Supplementary Tables 5 and 6). These new off-target sites include not only those containing Watson-Crick base-pairing mismatches to the guide, but also the recently reported insertion and deletion mismatches in the guide:target heteroduplex (Fig. 3d)29,30. Together, these results highlight the need for more precise understanding of rules governing Cas9 nuclease activity, a requisite step towards improving the predictive power of computational guide design programs.
In vivo genome editing using SaCas9
Following in vitro characterization, we incorporated SaCas9 and its sgRNA into an AAV vector to test its efficacy and specificity in vivo. The small size of SaCas9 enables packaging of both a U6-driven sgRNA and a CMV- or TBG-driven SaCas9 expression cassette into a single AAV vector within the 4.5kb packaging limit. Using hepatocyte-tropic AAV serotype 8, we targeted the mouse apolipoprotein (Apob) gene (Extended Data Fig. 10a). One week after intravenous administration of virus into C57BL/6 mice, we observed ~5% indel formation in liver tissue; after four weeks, the liver tissue showed characteristic hepatic lipid accumulation from Apob knockdown following histology analysis using oil red staining34–37 (Extended Data Fig. 10b, c).
We next targeted proprotein convertase subtilisin/kexin type 9 (Pcsk9), a therapeutically relevant gene involved in cholesterol homeostasis38. Inhibitors of the human convertase PCSK9 have emerged as a promising new class of cardioprotective drugs after human genetic studies revealed that loss of PCSK9 is associated with a reduced risk of cardiovascular disease and lower levels of LDL cholesterol39–41. We designed two Pcsk9-targeting sgRNAs and validated their activity in vitro. Each sgRNA was packaged into AAV-SaCas9 and injected into mice (2E11 total genome copies) (Fig. 4a). One week after administration, we observed greater than 40% indel formation at either locus in whole liver tissue, with similar levels two and four weeks post-injection (Fig. 4b). To determine the effect of Pcsk9-targeting AAV-SaCas9 dosage on serum Pcsk9 and total cholesterol levels, we administered a range of AAV titers from 0.5E11 to 4E11 total genome copies. With all titers, we observed a ~95% decrease in serum Pcsk9 and a ~40% decrease in total cholesterol one week after administration, both of which were sustained throughout the course of four weeks (Fig. 4c, d).
Figure 4. AAV-delivery of SaCas9 for in vivo genome editing.
a, Single-vector AAV system and experimental timeline. b, Indels at Pcsk9 targets in liver tissue following injection of AAV at 2E11 total genome copies (n=3 animals). Time course of c, serum Pcsk9 and d, total cholesterol in animals (n=3 for all titers and time points, error bars show S.E.M.). e, Manhattan plots of BLESS-identified DSB clusters in N2a cells. Inset indicates indel levels at top DSB scoring loci. f, Indels in liver tissue (n=3 animals, error bars indicate Wilson intervals) at BLESS-identified off-target loci. Heatmap indicates DSB scores.
Given the importance of targeting specificity in a therapeutic context, we next considered SaCas9 off-target modifications in vivo. To identify candidate off-target cleavage sites for the two Pcsk9-targeting guides, we transiently transfected an AAV-CMV::SaCas9 vector into mouse Neuroblastoma-2a (N2a) cells and applied BLESS to detect Cas9-induced DSBs in the genome. For both guides, we found very low levels of DSB signal across the genome except at the on-target locus (Fig. 4e). Targeted deep sequencing of the candidate off-target sites identified by BLESS in N2a cells did not reveal appreciable levels of indels in either N2a cells or liver tissue (4 weeks post injection of 2E11 total genome copies) (Fig. 4e, f and Supplementary Table 8). We additionally sequenced off-target sites predicted by target sequence similarity, and likewise did not detect indel formations (Supplementary Table 9).
Finally, we examined the titer-matched Pcsk9-targeting and TBG-GFP cohorts as well as naïve animals for signs of toxicity or acute immune response. At 1 week post-injection, necropsy and gross examination of liver tissue of the cohorts revealed no abnormalities; further histological examination of the liver by hematoxylin and eosin (H&E) staining showed no signs of inflammation, such as aggregates of lymphocytes or macrophages (Fig. 5a). Throughout the time course of the experiment, there were no elevated levels of serum ALT, albumin, and total bilirubin in any of the cohorts. We observed a slight trend in AST increase across all cohorts at four weeks, including the un-injected animals. The elevated levels did not exceed the upper limit of normal and is not indicative of hepatocellular injury (Fig. 5b). However, a larger cohort study should be conducted to further evaluate the effects of in vivo toxicity.
Figure 5. Liver function tests and toxicity examination in injected animals.
a., Histological analysis of the liver at 1-week post-injection by H&E stain. Scale bar = 10μm. b, Liver function tests in Pcsk9-targeted (both Pcsk9-sg1 and Pcsk9-sg2; 2E11 total genome copies, n ≥ 4), TBG::EGFP injected (2E11 total genome copies, n=3), and un-injected (n=5) animals. Dashed lines show the upper and lower ranges of normal value in mice where applicable.
Discussion
Here, we develop a small and efficient Cas9 from S. aureus for in vivo genome editing17. The results of these experiments highlight the power of using comparative genomic analysis19,42 in expanding the CRISPR-Cas toolbox. Identification of new Cas9 orthologs19,42, in addition to structure-guided engineering, could yield a repertoire of Cas9 variants with expanded capabilities and mimized molecular weight, for nucleic acid manipulation to further advance genome and epigenome engineering.
The AAV-SaCas9 system is able to mediate efficient and rapid editing of Pcsk9 in the mouse liver, resulting in reductions of serum Pcsk9 and total cholesterol levels. To assess the specificity of SaCas9, we used an unbiased DSB detection method, BLESS, to identify a list of candidate off-target cleavage sites in mouse cells. We examined these sites in liver tissue transduced by AAV-SaCas9 and did not observe any indel formation within the detection limits of targeted deep sequencing. However, the off-target sites identified in vitro might differ from those in vivo, which need to be further evaluated by the in vivo applications of BLESS or other unbiased techniques such as those published during the revision of this work43,44. Finally, we did not observe any overt signs of acute toxicity at one to four weeks post virus administration. Although further studies are needed to further improve the SaCas9 system for in vivo genome editing, such as assessing the long-term impact of Cas9 and sgRNA expression, these findings suggest that in vivo genome editing using SaCas9 has the potential to be highly efficient, specific, and well-tolerated.
Methods
In vitro transcription and cleavage assay
Cas9 orthologs were human codon-optimized and synthesized by GenScript, and transfected into 293FT cells as described below. Whole cell lysates from 293FT cells were prepared with lysis buffer (20 mM HEPES, 100 mM KCl, 5 mM MgCl2, 1 mM DTT, 5% glycerol, 0.1% Triton X-100) supplemented with Protease Inhibitor Cocktail (Roche). T7-driven sgRNA was transcribed in vitro using custom oligos (Supplementary Information) and HiScribe T7 In vitro Transcription Kit (NEB), following the manufacturer’s recommended protocol. The in vitro cleavage assay was carried out as follows: for a 20 μl cleavage reaction, 10 μl of cell lysate was incubated with 2 μl cleavage buffer (100 mM HEPES, 500 mM KCl, 25 mM MgCl2, 5 mM DTT, 25% glycerol), 1 μg in vitro transcribed RNA and 200 ng EcoRI-linearized pUC19 plasmid DNA or 200 ng purified PCR amplicons from mammalian genomic DNA containing target sequence. After 30 min incubation, cleavage reactions were purified using QiaQuick Spin Columns and treated with RNase A at final concentration of 80 ng/μl for 30 min and analyzed on a 1% Agarose E-Gel (Life Technologies).
In vitro PAM screen
Rho-independent transcriptional termination was predicted using the ARNold terminator search tool47,48. For the PAM library, a degenerate 7-bp sequence was cloned into a pUC19 vector. For each ortholog, the in vitro cleavage assay was carried out as above with 1 μg T7-transcribed sgRNA and 400 ng pUC19 with degenerate PAM. Cleaved plasmids were linearized by NheI, gel extracted, and ligated with Illumina sequencing adaptors. Barcoded and purified DNA libraries were quantified by Quant-iT PicoGreen dsDNA Assay Kit or Qubit 2.0 Fluorometer (Life Technologies) and pooled in an equimolar ratio for sequencing using the Illumina MiSeq Personal Sequencer (Life Technologies). MiSeq reads were filtered by requiring an average Phred quality (Q score) of at least 23, as well as perfect sequence matches to barcodes. For reads corresponding to each ortholog, the degenerate region was extracted. All extracted regions were then grouped and analyzed with Weblogo45.
Cell culture and transfection
Human embryonic kidney 293FT (Life Technologies), Neuro-2a (N2a), and Hepa1-6 (ATCC) cell lines were maintained in Dulbecco’s modified Eagle’s Medium (DMEM) supplemented with 10% FBS (HyClone), 2 mM GlutaMAX (Life Technologies), 100 U/ml penicillin, and 100 μg/ml streptomycin at 37 °C with 5% CO2 incubation.
Cells were seeded into 24-well plates (Corning) one day prior to transfection at a density of 240,000 cells per well, and transfected at 70–80% confluency using Lipofectamine 2000 (Life Technologies) following the manufacturer’s recommended protocol. For each well of a 24-well plate, a total of 500 ng DNA was used. For ChIP and BLESS, a total of 4.5 million cells are seeded the day before transfection into a 100mm plate, and a total of 20 ug DNA was used.
DNA isolation from cells and tissue
Genomic DNA was extracted using the QuickExtract DNA Extraction Solution (Epicentre). Briefly, pelleted cells were resuspended in QuickExtract solution and incubated at 65 °C for 15 min, 68 °C for 15 min, and 98 °C for 10 min8. Genomic liver DNA was extracted from bulk tissue fragments using a microtube bead mill homogenizer (Beadbug, Denville Scientific) by homogenizing approximately 30–50 mg of tissue in 600 μL of DPBS (Gibco). The homogenate was then centrifuged at 2000 to 3000×g for 5 minutes at 4°C and the pellet was resuspended in 300–600 μL QuickExtract DNA Extraction Solution (Epicentre) and incubated as above.
Indel analysis and guide:target basepairing mismatch search
Indel analyses by SURVEYOR assay and targeted deep sequencing were carried out and analyzed as previously described8,22. The methods for identification of potential off-target sites for SpCas9 based on Watson-Crick base-pairing mismatch between guide RNA and target DNA has been previously described22, and adapted for SaCas9 by considering NNGRR for possible off-target PAMs.
Chromatin immunoprecipitation and analysis
Cells are passaged at 24 hours post-transfection into a 150mm dish, and fixed for ChIP processing at 48 hours post-transfection. For each condition, 10 million cells are used for ChIP input, following experimental protocols and analyses as previously described31 with the following modifications: instead of pairwise peak-calling, ChIP peaks were only required to be enriched over both ‘empty’ controls (dSpCas9 only, dSaCas9 only) as well as the other Cas9/other sgRNA sample (e.g., SpCas9/EMX-sg2 peaks must be enriched over SaCas9/EMX-sg1 peaks in addition to the empty controls). This was done to avoid filtering out of real peaks present in two related samples as much as possible.
To identify off-targets ranked by motif or sequence similarity to guide, motif scores for ChIP peaks were calculated as follows: For a given ChIP peak, the 100-nt interval around the peak summit, the target sequence, and a given sgRNA guide region L, the query, an alignment score is calculated for every subsequence of length L in the target. The subsequence with the highest score is reported as the best match to the query. For each subsequence alignment, the score calculation begins at the 5′ end of the query. For each position in the alignment, 1 is added or subtracted for match or mismatch between the query and target, respectively. If the score becomes negative, it is set to 0 and the calculation continued for the remainder of the alignment. The score at the 3′ end of the query is reported as the final score for the alignment. MACS scores = −10log(p-value relative to the empty control) are determined as previously described49. For unbiased determination of PAM from ChIP peaks, the peaks were analyzed for the best match by motif score to the guide region only within 50-nt of the peak summit; the alignment was extended for 10-nt at the 3′ end and visualized using Weblogo45.
To calculate the motif score threshold at which FDR < 0.1 for each sample, 100-nt sequences centered around peak summits were shuffled while preserving dinucleotide frequency. The best match by motif score to the guide+PAM (NGG for SpCas9, NNGRRT for SaCas9) in these shuffled sequences was then found. The score threshold for FDR < 0.1 was defined as the score such that less than 10% of shuffled peaks had a motif score above that score threshold.
BLESS for DSB detection
Cells are harvested at 24 hours post-transfection, then processed as previously described33 with the following alterations: a total of 10 million cells are fixed for nuclei isolation and permeabilization, and treated with Proteinase K for 4 min at 37°C before inactivation with PMSF. All deproteinized nuclei are used for DSB labeling with 100 mM of annealed proximal linkers overnight. After Proteinase K digestion of labeled nuclei, chromatin are mechanically sheared with a 26G needle before sonication (BioRuptor, 20 min on High, 50% duty cycle). 20 ug of sheared chromatin are captured on streptavidin beads, washed, and ligated to 200 mM of distal linker. Linker hairpins are then cleaved off with I-SceI digestion for 1 hour at 37°C, and products PCR-enriched for 18 cycles before proceeding to library preparation with TruSeq Nano LT Kit (Illumina). For the negative control, cells mock transfected with Lipofectamine 2000 and pUC19 DNA were parallel processed through the assay.
BLESS Analysis
Fastq files were demultiplexed, and 30-bp genomic sequences were separated from the BLESS ligation handles for alignment. Bowtie was used to map the genomic sequences to hg19 or mm9, allowing for a maximum of 2 mismatches. Following alignment, reads from all bio-replicates for an individual sample were first pooled, and then nearest neighbor clustering was performed with a 30-bp moving window to identify regions of enrichment across the genome. Within each cluster, the pairwise distance was calculated between all forward and reverse read strand mappings (Extended Data Figure 7b, c). Pairwise distance distributions were used to filter out wide and poorly-defined DSB clusters from the well-defined DSB clusters characteristically found at Cas9-induced cleavage sites (see Supplementary Information). Finally, we adjusted the count of predicted Cas9-induced DSBs at a given locus by using a binomial model to calculate the maximum-likelihood estimate (MLE) of peak enrichment in the Cas9-sgRNA treated sgRNAs given BLESS measurements from an untreated negative control. After the MLE calculation, a list of loci ranked by their DSB scores could be obtained and plotted (Figure 3b, Extended Data Figure 8). Additional descriptions can be found in Supplementary Information.
The top-ranking ~30 sites from the list of Cas9 induced DSB clusters were sequenced for indel formation (Extended Data Figure 8; validated targets in Figure 3d). Within these loci, PAMs and regions of target homology were identified by first searching all PAM sites within a ±50 bp window around the DSB cluster, then selecting the adjacent sequence with fewest mismatches to the target sequence.
Code Availability
BLESS analysis code is available upon request.
Virus Production and Titration
For in-house viral production, 293FT cells (Life Technologies) were maintained as described above in 150mm plates. For each transfection, 8 ug of pAAV8 serotype packaging plasmid, 10 ug of pDF6 helper plasmid, and 6 ug of AAV2 plasmid carrying the construct of interest were added to 1mL of serum-free DMEM. 125 μL of PEI “Max” solution (1mg/mL, pH = 7.1) was then added to the mixture and incubated at room temperature for 5 to 10 seconds. After incubation, the mixture was added to 20 mL of warm maintenance media and applied to each dish to replace the old growth media. Cells were harvested between 48h and 72h post transfection by scraping and pelleting by centrifugation. The AAV2/8 (AAV2 ITR vectors pseudo-typed with AAV8 capsid) viral particles were then purified from the pellet according to a previously published protocol50.
High titer and purity viruses were also produced by vector core facilities at Children’s Hospital Boston and Massachusetts Eye and Ear Infirmary (MEEI). These AAV vectors were then titered by real-time qPCR using a customized TaqMan probe against the transgene, and all viral preparations were titer-matched across different batches and production facilities prior to experiments. The purity of AAV vector was further verified by SDS-PAGE.
Animal Injection and Processing
All mice cohorts were maintained at animal facility with standard diet and housing following IRB-approved protocols. AAV vector was delivered to 5–6 week old male C57/BL6 mice intravenously via lateral tail vein injection. All dosages of AAV were adjusted to 100 μL or 200 μL with sterile phosphate buffered saline (PBS), pH 7.4 (Gibco) before the injection. Animals were not immunosuppressed or otherwise handled differently prior to injection or during the course of the experiment except the pre-bleed fasting as noted below. The animals were randomized to the different experimental conditions, with the investigator not blinded to the assignments.
To track the serum levels of Pcsk9 and total cholesterol, animals were fasted overnight for 12 hours prior to blood collection by saphenous vein bleeds (no more than 100 μL or 10% of total blood volume per week). Multiple bleeds were made prior to tail vein delivery of AAV vector or control to collect pre-injection samples and to habituate the animals to handling during the procedure. After the blood was allowed to clot at room temperature, the serum was separated by centrifugation and stored at −20°C for subsequent analysis. For terminal procedures to collect liver tissue and larger serum volumes for chemistry panels, mice were euthanized by carbon dioxide inhalation. Subsequently, blood was collected via cardiac puncture. Transcardial perfusion with 30 mL PBS removed the remaining blood, after which liver samples were collected. The median lobe of liver was removed and fixed in 10% neutral buffered formalin for histological analysis, while the remaining lobes were sliced in small blocks of size less than 1×1×3mm3 and frozen for subsequent DNA or protein extraction.
Histology and serum analysis
Following tissue harvesting as described above, flash-frozen mouse liver samples were embedded in O.C.T. compound (Tissue Tek, Cat # 4583), snap-frozen, and stored at −80°C prior to processing. Frozen tissues were cryosectioned at 4-micron in thickness and stained with Oil Red O following manufacturer’s recommended protocol. Liver histology was assessed by H&E staining sections of 10% neutral buffer formalin fixed liver sections.
Serum levels of Pcsk9 were determined by ELISA using the Mouse Proprotein Convertase 9/PCSK9 Quantikine ELISA Kit (MPC-900, R&D Systems), following the manufacturer’s instructions. Total cholesterol levels were measured using the Infinity Cholesterol Reagent (Thermo Fisher) per the manufacturer’s instructions. Serum ALT, AST, albumin and total bilirubin were measured by an Olympus AU5400 (IDEXX Memphis, TN).
Extended Data
Extended Data Figure 1. Selection of Type II CRISPR-Cas loci from eight bacterial species.
a, Distribution of lengths for Cas9 >600 Cas9 orthologs19. b, Schematic of Type II CRISPR-Cas loci and sgRNA from eight bacterial species. Spacer or “guide” sequences are shown in blue, followed by direct repeat (gray). Predicted tracrRNAs are shown in red, and folded based on the Constraint Generation RNA folding model46.
Extended Data Figure 2. Cas9 ortholog cleavage pattern in vitro.

Stacked bar graph indicates the fraction of targets cleaved at 2, 3, 4, or 5-bp upstream of PAM for each Cas9 ortholog; most Cas9s cleave stereotypically at 3-bp upstream of PAM (red triangle).
Extended Data Figure 3. Test of Cas9 ortholog activity in 293FT cells.
a, SURVEYOR assays showing indel formation at human endogenous loci from co-transfection of Cas9 orthologs and sgRNA. PAM sequences for individual targets are shown above each lane, with the consensus region for each PAM highlighted in red. Red triangles indicate cleaved fragments. b, SaCas9 generates indels efficiently for a multiple targets. c, Box-whisker plot of indel formation as a function of SaCas9 guide length L, with unaltered guides (perfect match of L nucleotides, gray bars) or replacement of the 5′-most base of guide with guanine (G + L −1 nucleotides, blue bars) (n = 8 guides).
Extended Data Figure 4. Optimization of SaCas9 sgRNA scaffold in mammalian cells.
a, Schematic of the Staphylococcus aureus subspecies aureus CRISPR locus. b, Schematic of SaCas9 sgRNA with 21-nt guide, crRNA repeat (gray), tetraloop (black) and tracrRNA (red). The number of crRNA repeat to tracrRNA anti-repeat base-pairing is indicated above the gray boxes. SaCas9 cleaves targets with varying repeat:anti-repeat lengths in c, HEK 293FT and d, Hepa1-6 cell lines. (n=3, error bars show S.E.M.)
Extended Data Figure 5. Genome-wide binding by Cas9-chromatin immunoprecipitation (dCas9-ChIP).
a, Unbiased identification of PAM motif for dSaCas9 and dSpCas9. Peaks were analyzed for the best match by motif score to the guide region only within 50-nt of the peak summit. The alignment extended for 10-nt at the 3′ end and visualized using Weblogo. Numbers in parentheses indicate the number of called peaks. b, Histograms show the distribution of the peak summit relative to motif for dSaCas9 and dSpCas9. Position 1 on x-axis indicates the first base of PAM.
Extended Data Figure 6. Indel measurements at candidate off-target sites based on ChIP.
Indels at top off-target sites predicted by dCas9-ChIP for each Cas9 and sgRNA pair, based on ChIP peaks ranked by sequence similarity of the genomic loci to the guide motif (heatmap in purple), or p-value of ChIP enrichment over control (heatmap in red). Lines connect the common targets (EMX1) and off-targets between the two Cas9s.
Extended Data Figure 7. Analysis pipeline of sequencing data from BLESS.
a, Overview of the data analysis pipeline starting from the raw sequencing reads. Representative sequencing read mappings and corresponding histograms of the pairwise distances between all the forward orientation (red) reads and reverse orientation (blue) reads, displayed for representative b, DSB hotspots and poorly-defined DSB sites and c, Cas9 induced DSBs with detectable indels. Fraction of pairwise distances between reads overlapping by no more than 6bp (dashed vertical line) are indicated over histogram plots.
Extended Data Figure 8. Indel measurements at off-target sites based on DSB scores.
List of top off-target sites ranked by DSB scores for each Cas9 and sgRNA pair. Indel levels are determined by targeted deep sequencing. Blue triangles indicate positions of peak BLESS signal, and where present, PAMs and targets with sequence homology to the guide are highlighted. Lines connect the common on-targets (EMX1) and off-targets between the two Cas9s. N.D. not determined.
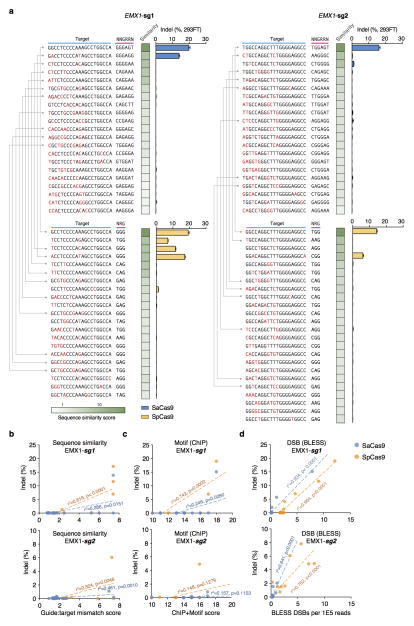
Extended Data Figure 9. Indel measurements of top candidate off-target sites based on sequence similarity score.
Off-targets are predicted based on sequence similarity to on-target, accounting for number and position of Watson-Crick base-pairing mismatches as previously described22. NNGRR and NRG are used as potential PAMs for SaCas9 and SpCas9, respectively. Lines connect the common targets (EMX1) and off-targets between the two Cas9s. Correlation plots between indel percentages and b, prediction based on sequence similarity, c, ChIP peaks ranked by motif similarity, or d, DSB scores for top ranking off-target loci. Trendlines, r2, and p-values are calculated using ordinary least squares.
Extended Data Figure 10. SaCas9 targeting Apob locus in the mouse liver.
a, Schematics illustrating the mouse Apob gene locus and the positions of the three guides tested. b, Experimental time course and c, SURVEYOR assay showing indel formation at target loci after intravenous injection of AAV2/8 carrying thyroxine-binding globulin (TBG) promoter-driven SaCas9 and U6-driven guide at 2E11 total genome copies (n = 1 animal each). d, Oil-red staining of liver tissue from AAV- or saline-injected animals. Male C56BL/6 mice were injected at 8 weeks of age and analyzed 4 weeks post injection.
Supplementary Material
Acknowledgments
We thank Emmanuelle Charpentier, Ines Fonfara, and Krzysztof Chylinski for discussions; Abigail Scherer-Hoock, Bailey Clear, and the MIT Division of Comparative Medicine for assistance with animal experiments; Boston Children’s Hospital Viral Core and Ru Xiao at the Massachusetts Eye & Ear Infirmary Viral Vector Core for assistance with AAV production; Nicola Crosetto for advice on BLESS; Chie-Yu Lin and Ian Slaymaker with experimental assistance; and the entire Zhang lab for support and advice. F.A.R. is a Junior Fellow at the Harvard Society of Fellows. W.X.Y. is supported by T32GM007753 from the National Institute of General Medical Sciences and a Paul and Daisy Soros Fellowship. J.S.G. is supported by a D.O.E. Computational Science Graduate Fellowship. F.Z. is supported by the National Institutes of Health through (NIMH: 5DP1-MH100706) and (NIDDK: 5R01DK097768-03), a Waterman Award from the National Science Foundation, the Keck, New York Stem Cell, Damon Runyon, Searle Scholars, Merkin, and Vallee Foundations, and Bob Metcalfe. F.Z. is a New York Stem Cell Foundation Robertson Investigator. The Children’s Hospital virus core is supported by NIH core grant (5P30EY012196-17). The content is solely the responsibility of the authors and does not necessarily represent the official views of the National Institute of General Medical Sciences or the National Institutes of Health. CRISPR reagents are available to the academic community through Addgene, and information about the protocols, plasmids, and reagents can be found at the Zhang Lab website www.genome-engineering.org.
Footnotes
Supplementary Information is available in the online version of the paper.
Author Contributions
F.A.R. and F.Z. conceived this study. F.A.R., L.C., W.X.Y., and F.Z. designed and performed the experiments with help from all authors. F.A.R., J.S.G., O.S., K.S.M., E.K., and F.Z. performed analysis on Cas9 orthologs, crRNA, and tracrRNA, and PAM. A.J.K., F.A.R., and X.W. performed ChIP and computational analysis and validation. F.A.R., W.X.Y., and L.C. performed BLESS and targeted sequencing of BLESS-identified off-target sites, and D.A.S. contributed computational analysis of BLESS data. W.X.Y., F.A.R., L.C., and B.Z. contributed animal data. W.X.Y., F.A.R., L.C., J.S.G., and F.Z. wrote the manuscript with help from all authors.
All reagents described in this manuscript have been deposited with Addgene (plasmid IDs 61591, 61592, and 61593).
Source data are available online and deep sequencing data are available at Sequence Read Archive under BioProject ID PRJNA274149.
The authors declare competing financial interests: details are available in the online version of the paper.
Readers are welcome to comment on the online version of the paper.
References
- 1.Bolotin A, Quinquis B, Sorokin A, Ehrlich SD. Clustered regularly interspaced short palindrome repeats (CRISPRs) have spacers of extrachromosomal origin. Microbiol Read Engl. 2005;151:2551–2561. doi: 10.1099/mic.0.28048-0. [DOI] [PubMed] [Google Scholar]
- 2.Barrangou R, et al. CRISPR provides acquired resistance against viruses in prokaryotes. Science. 2007;315:1709–1712. doi: 10.1126/science.1138140. [DOI] [PubMed] [Google Scholar]
- 3.Garneau JE, et al. The CRISPR/Cas bacterial immune system cleaves bacteriophage and plasmid DNA. Nature. 2010;468:67–71. doi: 10.1038/nature09523. [DOI] [PubMed] [Google Scholar]
- 4.Deltcheva E, et al. CRISPR RNA maturation by trans-encoded small RNA and host factor RNase III. Nature. 2011;471:602–607. doi: 10.1038/nature09886. [DOI] [PMC free article] [PubMed] [Google Scholar]
- 5.Sapranauskas R, et al. The Streptococcus thermophilus CRISPR/Cas system provides immunity in Escherichia coli. Nucleic Acids Res. 2011;39:9275–9282. doi: 10.1093/nar/gkr606. [DOI] [PMC free article] [PubMed] [Google Scholar]
- 6.Jinek M, et al. A programmable dual-RNA-guided DNA endonuclease in adaptive bacterial immunity. Science. 2012;337:816–821. doi: 10.1126/science.1225829. [DOI] [PMC free article] [PubMed] [Google Scholar]
- 7.Gasiunas G, Barrangou R, Horvath P, Siksnys V. Cas9-crRNA ribonucleoprotein complex mediates specific DNA cleavage for adaptive immunity in bacteria. Proc Natl Acad Sci U S A. 2012;109:E2579–2586. doi: 10.1073/pnas.1208507109. [DOI] [PMC free article] [PubMed] [Google Scholar]
- 8.Cong L, et al. Multiplex genome engineering using CRISPR/Cas systems. Science. 2013;339:819–823. doi: 10.1126/science.1231143. [DOI] [PMC free article] [PubMed] [Google Scholar]
- 9.Mali P, et al. RNA-guided human genome engineering via Cas9. Science. 2013;339:823–826. doi: 10.1126/science.1232033. [DOI] [PMC free article] [PubMed] [Google Scholar]
- 10.Gaudet D, et al. Review of the clinical development of alipogene tiparvovec gene therapy for lipoprotein lipase deficiency. Atheroscler Suppl. 2010;11:55–60. doi: 10.1016/j.atherosclerosissup.2010.03.004. [DOI] [PubMed] [Google Scholar]
- 11.Vasileva A, Jessberger R. Precise hit: adeno-associated virus in gene targeting. Nat Rev Microbiol. 2005;3:837–847. doi: 10.1038/nrmicro1266. [DOI] [PubMed] [Google Scholar]
- 12.Mingozzi F, High KA. Therapeutic in vivo gene transfer for genetic disease using AAV: progress and challenges. Nat Rev Genet. 2011;12:341–355. doi: 10.1038/nrg2988. [DOI] [PubMed] [Google Scholar]
- 13.Gao G, Vandenberghe LH, Wilson JM. New recombinant serotypes of AAV vectors. Curr Gene Ther. 2005;5:285–297. doi: 10.2174/1566523054065057. [DOI] [PubMed] [Google Scholar]
- 14.Kay MA. State-of-the-art gene-based therapies: the road ahead. Nat Rev Genet. 2011;12:316–328. doi: 10.1038/nrg2971. [DOI] [PubMed] [Google Scholar]
- 15.Zincarelli C, Soltys S, Rengo G, Rabinowitz JE. Analysis of AAV serotypes 1-9 mediated gene expression and tropism in mice after systemic injection. Mol Ther J Am Soc Gene Ther. 2008;16:1073–1080. doi: 10.1038/mt.2008.76. [DOI] [PubMed] [Google Scholar]
- 16.Swiech L, et al. In vivo interrogation of gene function in the mammalian brain using CRISPR-Cas9. Nat Biotechnol. 2015;33:102–106. doi: 10.1038/nbt.3055. [DOI] [PMC free article] [PubMed] [Google Scholar]
- 17.Senís E, et al. CRISPR/Cas9-mediated genome engineering: an adeno-associated viral (AAV) vector toolbox. Biotechnol J. 2014;9:1402–1412. doi: 10.1002/biot.201400046. [DOI] [PubMed] [Google Scholar]
- 18.Nishimasu H, et al. Crystal structure of Cas9 in complex with guide RNA and target DNA. Cell. 2014;156:935–949. doi: 10.1016/j.cell.2014.02.001. [DOI] [PMC free article] [PubMed] [Google Scholar]
- 19.Chylinski K, Makarova KS, Charpentier E, Koonin EV. Classification and evolution of type II CRISPR-Cas systems. Nucleic Acids Res. 2014;42:6091–6105. doi: 10.1093/nar/gku241. [DOI] [PMC free article] [PubMed] [Google Scholar]
- 20.Chylinski K, Le Rhun A, Charpentier E. The tracrRNA and Cas9 families of type II CRISPR-Cas immunity systems. RNA Biol. 2013;10:726–737. doi: 10.4161/rna.24321. [DOI] [PMC free article] [PubMed] [Google Scholar]
- 21.Hsu PD, Lander ES, Zhang F. Development and applications of CRISPR-Cas9 for genome engineering. Cell. 2014;157:1262–1278. doi: 10.1016/j.cell.2014.05.010. [DOI] [PMC free article] [PubMed] [Google Scholar]
- 22.Hsu PD, et al. DNA targeting specificity of RNA-guided Cas9 nucleases. Nat Biotechnol. 2013;31:827–832. doi: 10.1038/nbt.2647. [DOI] [PMC free article] [PubMed] [Google Scholar]
- 23.Hou Z, et al. Efficient genome engineering in human pluripotent stem cells using Cas9 from Neisseria meningitidis. Proc Natl Acad Sci U S A. 2013;110:15644–15649. doi: 10.1073/pnas.1313587110. [DOI] [PMC free article] [PubMed] [Google Scholar]
- 24.Fu Y, Sander JD, Reyon D, Cascio VM, Joung JK. Improving CRISPR-Cas nuclease specificity using truncated guide RNAs. Nat Biotechnol. 2014;32:279–284. doi: 10.1038/nbt.2808. [DOI] [PMC free article] [PubMed] [Google Scholar]
- 25.Semenova E, et al. Interference by clustered regularly interspaced short palindromic repeat (CRISPR) RNA is governed by a seed sequence. Proc Natl Acad Sci U S A. 2011;108:10098–10103. doi: 10.1073/pnas.1104144108. [DOI] [PMC free article] [PubMed] [Google Scholar]
- 26.Fu Y, et al. High-frequency off-target mutagenesis induced by CRISPR-Cas nucleases in human cells. Nat Biotechnol. 2013;31:822–826. doi: 10.1038/nbt.2623. [DOI] [PMC free article] [PubMed] [Google Scholar]
- 27.Mali P, et al. CAS9 transcriptional activators for target specificity screening and paired nickases for cooperative genome engineering. Nat Biotechnol. 2013;31:833–838. doi: 10.1038/nbt.2675. [DOI] [PMC free article] [PubMed] [Google Scholar]
- 28.Pattanayak V, et al. High-throughput profiling of off-target DNA cleavage reveals RNA-programmed Cas9 nuclease specificity. Nat Biotechnol. 2013;31:839–843. doi: 10.1038/nbt.2673. [DOI] [PMC free article] [PubMed] [Google Scholar]
- 29.Lin Y, et al. CRISPR/Cas9 systems have off-target activity with insertions or deletions between target DNA and guide RNA sequences. Nucleic Acids Res. 2014;42:7473–7485. doi: 10.1093/nar/gku402. [DOI] [PMC free article] [PubMed] [Google Scholar]
- 30.Bae S, Park J, Kim JS. Cas-OFFinder: a fast and versatile algorithm that searches for potential off-target sites of Cas9 RNA-guided endonucleases. Bioinforma Oxf Engl. 2014;30:1473–1475. doi: 10.1093/bioinformatics/btu048. [DOI] [PMC free article] [PubMed] [Google Scholar]
- 31.Wu X, et al. Genome-wide binding of the CRISPR endonuclease Cas9 in mammalian cells. Nat Biotechnol. 2014;32:670–676. doi: 10.1038/nbt.2889. [DOI] [PMC free article] [PubMed] [Google Scholar]
- 32.Kuscu C, Arslan S, Singh R, Thorpe J, Adli M. Genome-wide analysis reveals characteristics of off-target sites bound by the Cas9 endonuclease. Nat Biotechnol. 2014;32:677–683. doi: 10.1038/nbt.2916. [DOI] [PubMed] [Google Scholar]
- 33.Crosetto N, et al. Nucleotide-resolution DNA double-strand break mapping by next-generation sequencing. Nat Methods. 2013;10:361–365. doi: 10.1038/nmeth.2408. [DOI] [PMC free article] [PubMed] [Google Scholar]
- 34.Young SG. Recent progress in understanding apolipoprotein B. Circulation. 1990;82:1574–1594. doi: 10.1161/01.cir.82.5.1574. [DOI] [PubMed] [Google Scholar]
- 35.Soutschek J, et al. Therapeutic silencing of an endogenous gene by systemic administration of modified siRNAs. Nature. 2004;432:173–178. doi: 10.1038/nature03121. [DOI] [PubMed] [Google Scholar]
- 36.Rozema DB, et al. Dynamic PolyConjugates for targeted in vivo delivery of siRNA to hepatocytes. Proc Natl Acad Sci U S A. 2007;104:12982–12987. doi: 10.1073/pnas.0703778104. [DOI] [PMC free article] [PubMed] [Google Scholar]
- 37.Wolfrum C, et al. Mechanisms and optimization of in vivo delivery of lipophilic siRNAs. Nat Biotechnol. 2007;25:1149–1157. doi: 10.1038/nbt1339. [DOI] [PubMed] [Google Scholar]
- 38.Fitzgerald K, et al. Effect of an RNA interference drug on the synthesis of proprotein convertase subtilisin/kexin type 9 (PCSK9) and the concentration of serum LDL cholesterol in healthy volunteers: a randomised, single-blind, placebo-controlled, phase 1 trial. Lancet. 2014;383:60–68. doi: 10.1016/S0140-6736(13)61914-5. [DOI] [PMC free article] [PubMed] [Google Scholar]
- 39.Abifadel M, et al. Mutations in PCSK9 cause autosomal dominant hypercholesterolemia. Nat Genet. 2003;34:154–156. doi: 10.1038/ng1161. [DOI] [PubMed] [Google Scholar]
- 40.Cohen J, et al. Low LDL cholesterol in individuals of African descent resulting from frequent nonsense mutations in PCSK9. Nat Genet. 2005;37:161–165. doi: 10.1038/ng1509. [DOI] [PubMed] [Google Scholar]
- 41.Horton JD, Cohen JC, Hobbs HH. Molecular biology of PCSK9: its role in LDL metabolism. Trends Biochem Sci. 2007;32:71–77. doi: 10.1016/j.tibs.2006.12.008. [DOI] [PMC free article] [PubMed] [Google Scholar]
- 42.Briner AE, et al. Guide RNA functional modules direct Cas9 activity and orthogonality. Mol Cell. 2014;56:333–339. doi: 10.1016/j.molcel.2014.09.019. [DOI] [PubMed] [Google Scholar]
- 43.Tsai SQ, et al. GUIDE-seq enables genome-wide profiling of off-target cleavage by CRISPR-Cas nucleases. Nat Biotechnol. 2014 doi: 10.1038/nbt.3117. [DOI] [PMC free article] [PubMed] [Google Scholar]
- 44.Frock RL, et al. Genome-wide detection of DNA double-stranded breaks induced by engineered nucleases. Nat Biotechnol. 2014 doi: 10.1038/nbt.3101. [DOI] [PMC free article] [PubMed] [Google Scholar]
- 45.Crooks GE, Hon G, Chandonia JM, Brenner SE. WebLogo: a sequence logo generator. Genome Res. 2004;14:1188–1190. doi: 10.1101/gr.849004. [DOI] [PMC free article] [PubMed] [Google Scholar]
- 46.Zuker M. Mfold web server for nucleic acid folding and hybridization prediction. Nucleic Acids Res. 2003;31:3406–3415. doi: 10.1093/nar/gkg595. [DOI] [PMC free article] [PubMed] [Google Scholar]
- 47.Gautheret D, Lambert A. Direct RNA motif definition and identification from multiple sequence alignments using secondary structure profiles. J Mol Biol. 2001;313:1003–1011. doi: 10.1006/jmbi.2001.5102. [DOI] [PubMed] [Google Scholar]
- 48.Macke TJ, et al. RNAMotif, an RNA secondary structure definition and search algorithm. Nucleic Acids Res. 2001;29:4724–4735. doi: 10.1093/nar/29.22.4724. [DOI] [PMC free article] [PubMed] [Google Scholar]
- 49.Feng J, Liu T, Qin B, Zhang Y, Liu XS. Identifying ChIP-seq enrichment using MACS. Nat Protoc. 2012;7:1728–1740. doi: 10.1038/nprot.2012.101. [DOI] [PMC free article] [PubMed] [Google Scholar]
- 50.Veldwijk MR, et al. Development and optimization of a real-time quantitative PCR-based method for the titration of AAV-2 vector stocks. Mol Ther J Am Soc Gene Ther. 2002;6:272–278. doi: 10.1006/mthe.2002.0659. [DOI] [PubMed] [Google Scholar]
Associated Data
This section collects any data citations, data availability statements, or supplementary materials included in this article.


