Abstract
We employed a microfluidic device to study the effects of hydraulic pressure on cardiomyoblast H9c2. The 170 mm Hg pressure increased the cellular area and the expression of atrial natriuretic peptide. With the same device, we demonstrated that the effects of hydraulic pressure on the cardiomyoblast could be reduced by the inhibitor of focal adhesion kinase. This mechanical–chemical antagonism could lead to a potential therapeutic strategy of hypertension-induced cardiac hypertrophy.
INTRODUCTION
Hypertension or acute aortic stenosis increases mechanical pressure to cardiomyocyte and leads to pathological cardiac hypertrophy.1 Patients with cardiac hypertrophy have a higher risk for morbidity of cardiac vascular diseases, cardiovascular death, and all-cause mortality.2 Cardiac hypertrophy is a result of increase in the cardiomyocyte size rather than number.3 The hypertrophic growth of cardiomyocyte is accompanied by reprogramming of gene expression as well as the increase of atrial natriuretic peptide (ANP) expression.3,4 Extensive studies using genetically modified mouse models have revealed the intracellular signal pathways of cardiac hypertrophy except those activated by mechanical pressure.3 This is because of the difficulty in separating the mechanical stimulations from endocrined and nerve stimulations in animal models. Thus, an in vitro cellular model could be better for studying the mechanical pressure-induced signal pathways.
In order to introduce mechanical force to cardiomyocytes, most studies applied stretch force by culturing the cardiomyocytes in a silicone chamber and stretching them longitudinally.5,6 The stretch models mainly mimic the mechanical stress during the muscle contraction rather than hemodynamic force. Other methods like ambient7,8 and osmotic pressure9 cannot represent the hemodynamic force in vivo, either. Belmonte and Morad used pressurized flows (PFs) of solutions to imitate the hemodynamic stress to cardiomyocyte.10 However, their PFs produced a pressure head of 20.5 mm Hg, which was significantly lower than the blood pressure in human hypertension (higher than 140 mm Hg). Recently, Giridharan et al. developed a microfluidic cardiac cell culture model (μCCCM) that incorporated pulsatile stretch and pressure on cardiac cells in a single device.11 The mechanical stimulations can mimic various physiological conditions, including heart failure, hypertension, and hypotension. However, the structure and manipulation of this model device is too complicated for daily operations in a common biological laboratory.
In the present study, we developed a simple microfluidic cell culture device that allowed hydraulic pressures higher than 160 mm Hg to represent the hemodynamic stress to cardiomyocyte in human hypertension disease. The hydraulic pressure was generated by a continuously flowing medium through a meander-shaped microfluidic channel with relatively high flow resistance.12 The device design allows the cells cultured under desired hydraulic pressure without utilizing pressured gases, which greatly simplifies the experimental setup. In addition, the device eliminates the potential problems caused by gas composition variation in the culture medium in pneumatically driven systems. In comparison with the device in Ref. 12, we re-designed the geometry of the channel to achieve high hydraulic pressure while minimizing the shear stress. The resulted shear stress in the cell culture area was smaller than that presented in Ref. 12 by more than 20 times. On the other hand, the hydraulic pressure within the cell culture area was approximately 170 mm Hg, which was comparable to that achieved with the device in Ref. 12. Because the shear stress in the cell culture area was less than 0.4 dyn/cm2, much lower than that in an artery (10–70 dyn/cm2) or a vein (1–6 dyn/cm2),13 the observed cellular responses could be regarded as being induced by the hydraulic pressure only. We thus quantified the cellular areas as well as the expression levels of ANP as measures of the cardiomyoblast responses to hemodynamic stress. We also tested the effects of the focal adhesion kinase (FAK) inhibitor on these pressure-induced responses of cardiomyoblasts in the same device. The results suggested that FAK is involved in the pressure-induced signaling pathways in cardiomyoblast.
MATERIALS AND METHODS
Fabrication and verification of the microfluidic device
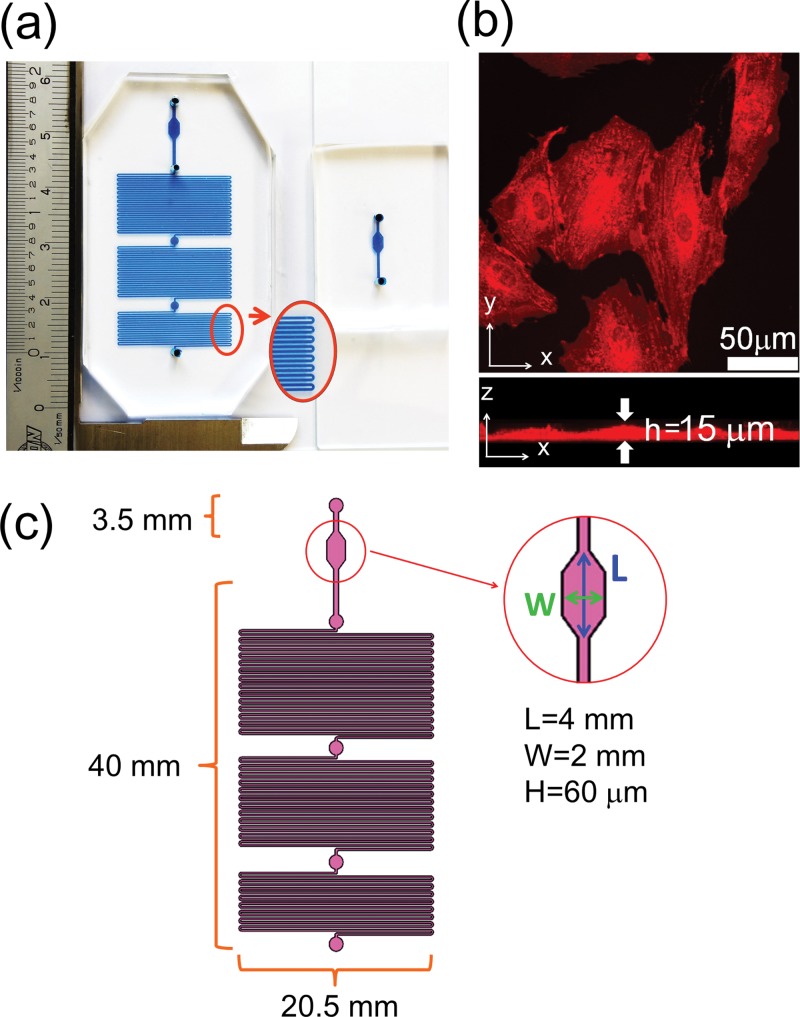
The microfluidic cell culture device used in the present study is shown in Fig. 1(a). The larger device is for the experimental group, while the smaller one is for the control. We used standard soft-lithography microfabrication techniques to make this device with polydimethylsiloxane (PDMS) from a master mold made of SU-8 negative photoresist. The channel was defined by patterning a 60 μm layer of an SU8–2025 mold. Because the cell thickness measured by confocal microscopy was ∼15 μm as shown in Fig. 1(b), we assumed that the 60 μm channel height did not affect the growth and spreading of cells in this device. The PDMS replicas were bonded on a glass slide with oxygen plasmas. After bonding, the device was cured at 60 °C for more than 2 h. More details about the device fabrication can be found in our previous publication.14 The dimensions of the channels are marked in Fig. 1(c). Because of the high flow resistance in the curved channel, elevated hydraulic pressure was established while the culture medium was pumped into the channel with a constant flow rate. We designed a 4 mm × 2 mm observation area close to the medium inlet of the channel. All the experimental data were collected from cells residing in this observation area. We also placed three outlets for adjusting the pressure inside the channel. However, in this present work, we only used the final one to obtain the highest hydraulic pressure.
FIG. 1.
(a) The cell culture device filled with a blue food pigment. The smaller one is for the control, and the larger one is for the experimental group. (b) Confocal microscopy image of the H9c2 cells stained with a fluorescent dye DiD. The cell height is about 15 μm. (c) The channel dimensions of the cell culture device. The channel height is 60 μm.
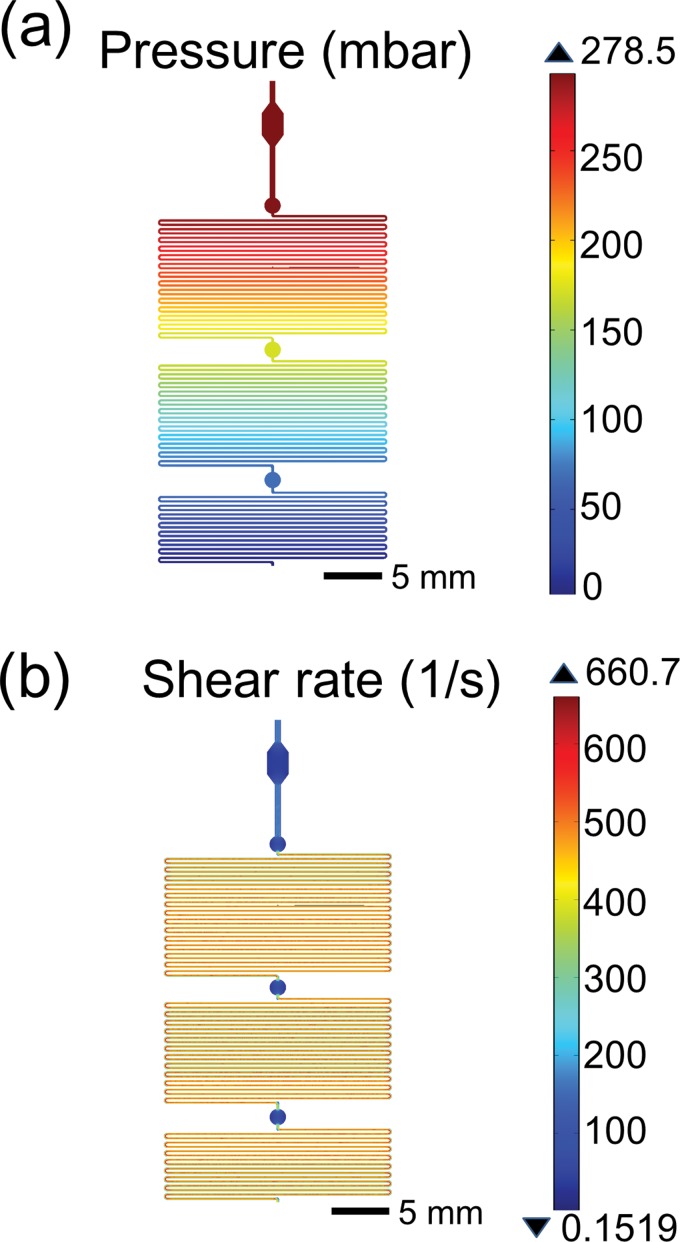
Before the experimental work, we used COMSOL Multiphysics (COMSOL, Burlington, MA, U.S.A.) to simulate the pressure and shear rate in the device. Because we did not find reliable values of the density and dynamic viscosity of the Leibovitz L-15 medium used in the present work, we referred to the density and dynamic viscosity of Dulbecco's Modified Eagle's Medium (DMEM) instead. The density and viscosity of serum-free DMEM was measured to be 1.006 g/ml and 0.9598 mPa·s respectively.15 The simulation results in Figs. 2(a) and 2(b) show that when the injection flow rate was set as 3.5 μl/min, the hydraulic pressure and shear rate in the 4 mm × 2 mm observation area were 278.5 mbar (209 mm Hg) and 44.1 s−1, respectively. The shear stress was therefore ∼0.39 dyn/cm2.
FIG. 2.
Simulations of the pressure (a) and shear rate (b) inside the channel at a volumetric flow rate of 3.5 μl/min by using COMSOL Multiphysics. The simulated pressure is 278.5 mbar (about 209 mm Hg) in the observation region. The simulated shear rate is 44.1 s−1. After multiplying by the viscosity coefficient of the culture medium, we obtained the shear stress as 0.39 dyn/cm2 in the observation region.
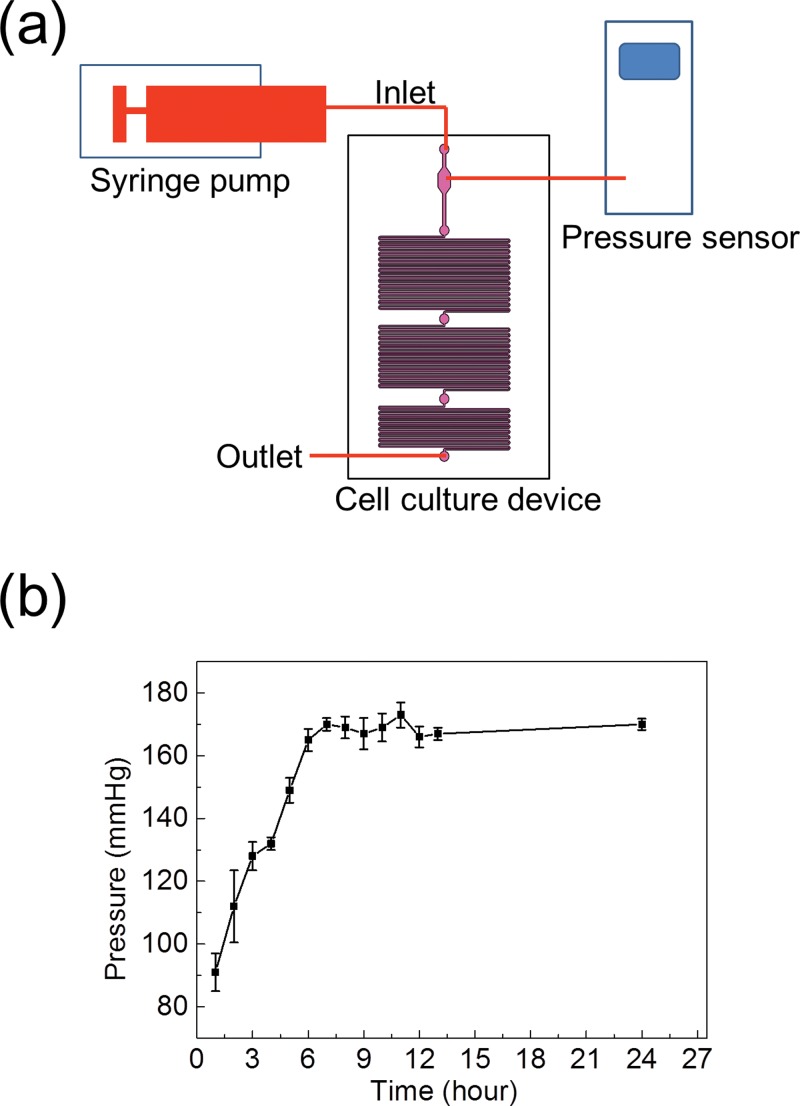
We used the setup in Fig. 3(a) to measure the hydraulic pressure in the channel. The pressure was recorded by using a calibrated pressure meter (717–30G, Fluke, Everett, WA, U.S.A.) through a hole punched on the observation region of the microfluidic device. The volumetric flow rate of the syringe pump was set as 3.5 μl/min. The pressure elevation along with time is plotted in Fig. 3(b), in which the data points are the averages of the values measured in three devices. The hydraulic pressure gradually became stable after 6 h of pumped medium flow, and the pressure elevation in the channel could be sustained up to 24 h. However, the pressure was fluctuating between 165 and 173 mm Hg. The mean of the stabilized pressure was 170 mm Hg, approximately 19% smaller than the simulated value. We suspected that this discrepancy was due to the deformation of the curved channel under the pumped flow.16
FIG. 3.
(a) Experimental setup for measuring the pressure in the observation region. (b) A stable hydraulic pressure was established after ∼6 h of flow, and the pressure was fluctuating around 170 mm Hg. The data were obtained from three devices and presented as mean ± standard deviation.
Cell preparation
We cultured rat cardiomyoblast H9c2 (Bioresource Collection and Research Center, Hsinchu, Taiwan) in DMEM (11965, Gibco, Life Technologies, Taipei, Taiwan) supplemented with 10% fetal bovine serum (FBS) and 1% antibiotic pen-strep-ampho. The culture dish containing the cells was placed in an incubator at 37 °C with a 5% CO2 atmosphere. We used the H9c2 cardiomyoblasts less than 30 passages of culture in the following experiments. Before being injected into the device, the culture medium was replaced by the Leibovitz L-15 medium (11415, Gibco, Life Technologies, Taipei, Taiwan) that is optimized for a CO2-independent culture condition. According to our experiences, although the medium was continuously renewed in the microfluidic cell culture device and the medium was not contacted by the air, the cellular attachment and proliferation in the microfluidic devices were sometimes worse than those of cells in an incubator supplied with 5% CO2. The Leibovitz L-15 medium was modified to provide a stable pH level for cell cultures in the air. Because the L-15 medium contains high levels of free base forms of amino acids and uses galactose to replace glucose as the carbohydrate source, the pH level is more stably buffered than those in common culture media.17 In this present work, the culture device was placed in a 37 °C cage on the microscope without the supply of CO2. Therefore, we used the L-15 medium in the microfluidic device for an experimental period longer than 1 h. The concentration of FBS was reduced to 1% for the experiments in the microfluidic device.
For the observation of F-actin in the H9c2 cells, we fixed and permeabilized the cells by injecting BD Perm buffer (554714, BD Biosciences, Taipei, Taiwan) into the device for 30 min. We labeled the cells with Alexa Fluor® 546 phalloidin (A22283, Life Technologies) diluted in BD Wash buffer (554723, BD Biosciences) with a 1:40 volume ratio for 30 min at room temperature, and then washed it away with the same buffer. The images of F-actin were acquired by a confocal microscope (TCS-SP5, Leica Microsystems, Wetzlar, Germany) with a 40×, 1.25 numerical aperture oil-immersion objective.
In order to quantify the expression levels of ANP in the cells, the cells were also permeabilized and washed. Then we labeled the cells with anti-ANP rabbit polyclonal antibody (PA3–228, Thermo Fisher Scientific, Rockford, IL, U.S.A.) diluted in BD Wash buffer with a 1:400 volume ratio at 4 °C for 12 h. Next, we washed the cells for three times, and then stained the anti-ANP antibodies with DyLight® 550-conjugated rabbit IgG-heavy and light chain antibody (A120–100D3, Bethyl Laboratories, Montgomery, TX, U.S.A.) diluted in BD Wash buffer with a 1:200 volume ratio at 4 °C for 2 h. The fluorescence images of ANP were captured by an electron multiplying CCD camera (iXon 885, Andor, Belfast, United Kingdom). The fluorescence intensity of the ANP was recorded after subtracting the background.
Data analysis
In the present work, we used a 20×, 0.45 numerical aperture objective to capture the phase-contrast and fluorescence images of the H9c2 cells in the observation region of the device. In order to reduce data uncertainty, we selected single cells well separated from neighboring ones to calculate the cell area and the fluorescence intensity. The cell area and ANP intensity were recorded from cells under the hydraulic pressure for 24 h. Typical phase-contrast and fluorescence images of the H9c2 cells are presented in Figs. 4(a) and 6(a). We manually plotted the boundary of each cell, and then used ImageJ to calculate the cell area on the phase-contrast image and average intensity of each cell on the fluorescence image. The ANP intensity per cell was calculated by multiplying the average intensity with the cellular area. The data in Figs. 4(b) and 6(b) were obtained from five independent experiments. In each experiment, we calculated the cell areas and ANP intensities of more than 15 cells. All the values in Figs. 4(b) and 6(b) are normalized to the values measured from the cells in the control device.
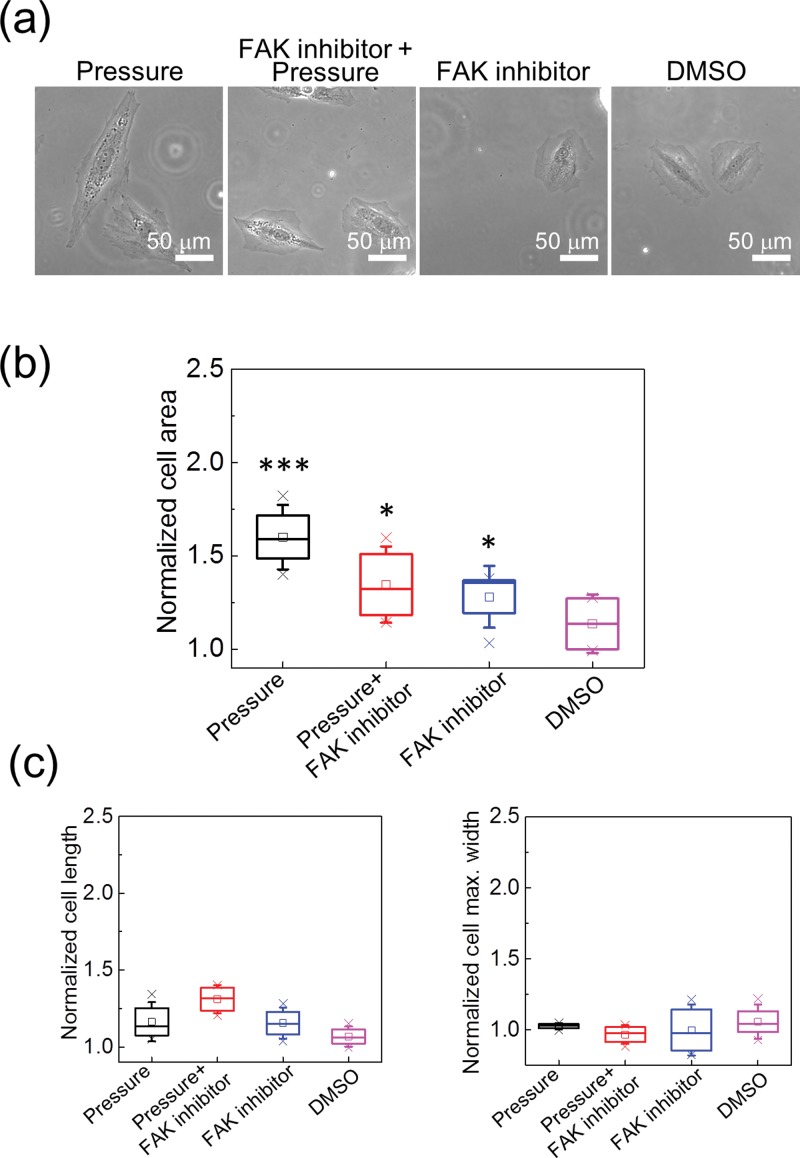
FIG. 4.
(a) Phase contrast images of the H9c2 cells under various treatments. (b) The cellular areas of the H9c2 cells under various treatments. All values are normalized to those obtained from cells in the control group. The cellular areas were significantly increased by the 170 mm Hg hydraulic pressure, and the FAK inhibitor suppressed the influence from the pressure. However, the FAK inhibitor also caused the enlargement of the cellular area. The data were from five repeated experiments. In each experiment, more than 15 cells were measured. *p < 0.05 and ***p < 0.005, in comparison with the control group. (c) The cell lengths and maximum cell widths under various treatments. Because the increases in both the cell lengths and widths were smaller than that in the cell area, we confirmed that the hydraulic pressure actually enlarged the cell area isotropically rather than increasing the cell lengths or widths only.
FIG. 6.
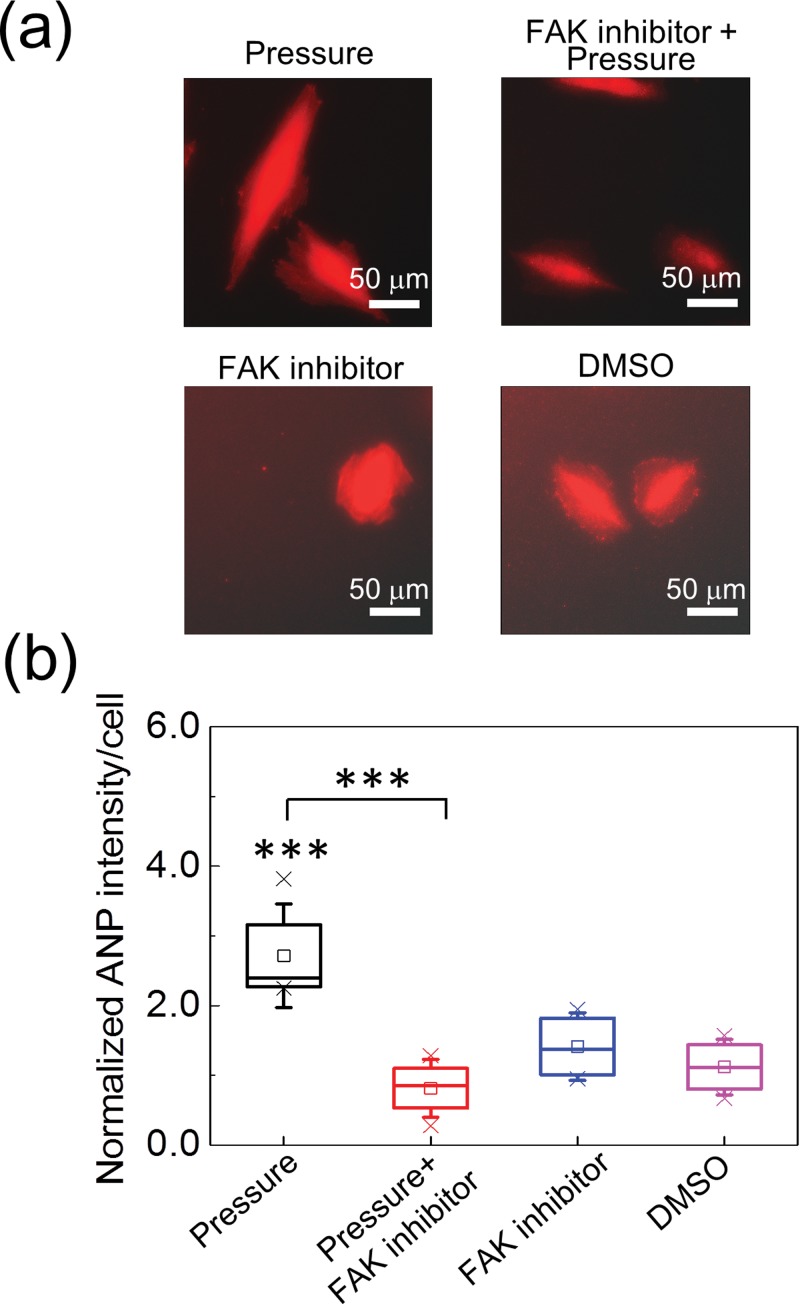
(a) Fluorescence images of ANP in the H9c2 cells under various treatments. (b) The ANP intensity per cell under various treatments. All values are normalized to those obtained from cells in the control group. Under the 170 mm Hg hydraulic pressure, the ANP intensity was increased by ∼2.2 folds. The FAK inhibitor suppressed the pressure-induced ANP expression effectively and did not increase ANP expression by itself. The data were from five repeated experiments. In each experiment, more than 15 cells were measured. ***p < 0.005.
RESULTS AND DISCUSSION
Figure 4(b) shows the variations of cellular areas under 170 mm Hg hydraulic pressure and the treatment of 50 μM FAK inhibitor (PF-573228, Sigma-Aldrich, St. Louis, MO, U.S.A.). The hydraulic pressure significantly increased the area of H9c2 cells. The FAK inhibitor reduced the degree of cellular enlargement, but the cellular area was still larger than that of the control group (p < 0.05). Because the FAK inhibitor impedes the maturation of focal adhesions,18 we suspected that it could also reduce the retraction force during cell spreading. Therefore, we conducted the measurement on cellular areas under the treatments of the FAK inhibitor and its solvent, dimethyl sulfoxide (DMSO), in the device for the control group. The data in Fig. 4(b) confirmed that the FAK inhibitor could also increase cellular area without the pressure loading (p < 0.05); while the DMSO did not produce significant influence on cellular area. We also compared the cell lengths and the maximum cell widths transverse to the long axis of a cell under the same mechanical and chemical treatments. The results in Fig. 4(c) show that the lengths and widths of the H9c2 cells were not increased significantly under the hydraulic pressure. Therefore, the cells were actually expanded isotropically by the pressure, rather than being elongated or widened along a single axis.
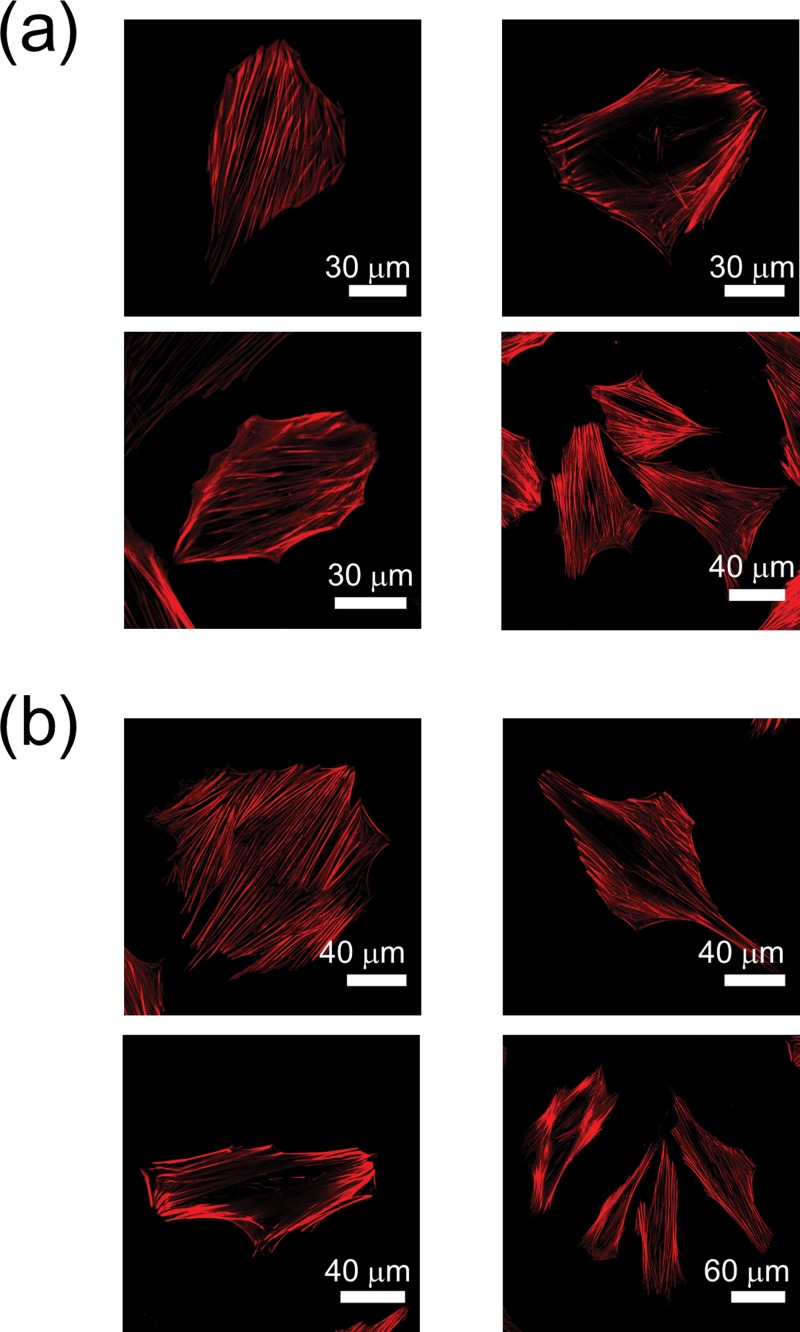
Mechanical stimulations could cause cytoskeletal variations in some types of cells. For example, fibroblasts under mechanical tension tend to express more α-smooth muscle actin and F-actin, and transform into the phenotype of myofibroblasts.19 Therefore, we would also like to know how the hydraulic pressure changes the structures of F-actin in cardiomyoblast. The images in Fig. 5 show the F-actin labelled with Alexa Fluor® 546 phalloidin in some H9c2 cells without and with the pressure loading. Nevertheless, we did not observe significant variations in the numbers or distributions of the F-actin induced by the hydraulic pressure.
FIG. 5.
Confocal microscopy images of F-actin in the H9c2 cells labelled with Alexa Fluor® 546 phalloidin. (a) The control group. (b) Cells under 170 mm Hg hydraulic pressure. The numbers and distributions of the F-actin are similar in these two cases.
In order to verify the hypertrophic effects of hydraulic pressure on the H9c2 cardiomyoblast, we compared the levels of ANP in the cells under the stimulations of pressure and the FAK inhibitor. It has been suggested that the expression levels of natriuretic peptides or α-skeletal actin can be used as features to identify pathological hypertrophy from physiological hypertrophy.20 Therefore, we used the total ANP fluorescence signal in each cell to evaluate the degree of pathological hypertrophy induced by the hydraulic pressure. Figure 6(b) shows that the ANP levels in the cells under pressure were significantly higher than those in the control group, and the treatment of the FAK inhibitor eliminated this response very effectively. In addition, when there was no pressure applied, both the treatments of the FAK inhibitor and DMSO did not induce extra expression of ANP in comparison with the control group. Combining the results in Figs. 4 and 6, we conjecture that the hydraulic pressure induced pathological hypertrophy, while the increase of cellular area by the FAK inhibitor only reflects the suppression of focal adhesion maturation.
It is verified that left ventricle pressure overload results in phosphorylation of various potential mechanosensing proteins in mice.21 FAK is early phosphorylated, activated, and forms a signaling complex in the heart following pressure overload.22 FAK is also early activated by stretch in cardiomyocyte.23 The importance of FAK in cardiac hypertrophy has been proved by mouse cardiac-specific knockout of FAK.24,25 Inhibition of FAK reduces load-induced cardiac hypertrophy in mice26 as well as the stretch-induced ANP expression and cardiomyocyte hypertrophy.23 FAK also mediates the stretch-induced activation of mouse embryonic fibroblast transcription factor and the expression of c-Jun immediate early gene.27 The mechanism of FAK activation by stretch may be through the RhoA/ROCK signaling pathway in cardiomyocyte.28 In the present study, we found that the FAK inhibitor reduced the size enlargement and ANP expression in H9c2 cells induced by elevated hydraulic pressure. This finding suggests that FAK is also critical for pressure-induced cardiomyocyte hypertrophy, but how FAK is activated and what the signaling pathways downstream FAK after the pressure stimulation are unclear at present.
Cells in different locations of an organ see different forms of mechanical stresses. For example, cardiomyocytes see cyclic stretch and pressure stresses, but endothelia see shear and pressure stresses in the heart. Although our device provides static hydraulic pressure only, it has the advantage for us to study the cellular responses to pressure without other forms of mechanical loading, and the results can be compared with those obtained with stretch or shear stress only. This feature could be useful to elucidate the effects from individual mechanical stimulations in comparison with animal studies.
CONCLUSION
In the present work, we designed and fabricated a simple microfluidic device for investigating the responses of H9c2 cardiomyoblast to elevated hydraulic pressure and the treatment of FAK inhibitor. The structure and fabrication of this device is straightforward, such that a biological laboratory can easily adopt it. With this device, we directly observed that the cellular areas of H9c2 cells were increased by 170 mm Hg hydraulic pressure, accompanied by the increase in ANP expression. Therefore, the cells under pressure were in a status close to pathological hypertrophy. Although the pressure-induced ANP expression was suppressed by the FAK inhibitor, we found that the cellular areas under the FAK inhibitor treatment only were also increased. Therefore, both the ANP expression level and the cellular area should be considered together for evaluating the effect of mechanical stimulations on the cardiomyoblast.
Pressure stimulations exist in various microenvironments in vivo, such as the cardiovascular system, the pulmonary alveoli, or solid tumors. The device developed in the present work will be useful for testing various reagents that can enhance or suppress the cellular responses to pressure loading. It is thus useful for the assays in mechanosignal transductions as well as the evaluation of potential therapeutic chemicals.
ACKNOWLEDGMENTS
This work was financially supported by the Ministry of Science and Technology of Taiwan (Contract No. MOST 103-2112-M-001-019-MY3).
References
- 1.Devereux R. B., Pickering T. G., Harshfield G. A., Kleinert H. D., Denby L., Clark L., Pregibon D., Jason M., Kleiner B., Borer J. S., and Laragh J. H., Circulation 68, 470 (1983). 10.1161/01.CIR.68.3.470 [DOI] [PubMed] [Google Scholar]
- 2.Levy D., Garrison R. J., Savage D. D., Kannel W. B., and Castelli W. P., N. Engl. J. Med. 322, 1561 (1990). 10.1056/NEJM199005313222203 [DOI] [PubMed] [Google Scholar]
- 3.Hill J. A. and Olson E. N., N. Engl. J. Med. 358, 1370 (2008). 10.1056/NEJMra072139 [DOI] [PubMed] [Google Scholar]
- 4.Holtwick R., van Eickels M., Skryabin B. V., Baba H. A., Bubikat A., Begrow F., Schneider M. D., Garbers D. L., and Kuhn M., J. Clin. Invest. 111, 1399 (2003). 10.1172/JCI17061 [DOI] [PMC free article] [PubMed] [Google Scholar]
- 5.Komuro I., Kaida T., Shibazaki Y., Kurabayashi M., Katoh Y., Hoh E., Takaku F., and Yazaki Y., J. Biol. Chem. 265, 3595 (1990). [PubMed] [Google Scholar]
- 6.Salameh A., Wustmann A., Karl S., Blanke K., Apel D., Rojas-Gomez D., Franke H., Mohr F. W., Janousek J., and Dhein S., Circ. Res. 106, 1592 (2010). 10.1161/CIRCRESAHA.109.214429 [DOI] [PubMed] [Google Scholar]
- 7.Sato T., Ohkusa T., Suzuki S., Nao T., Yano M., and Matsuzaki M., Hypertens. Res. 29, 1013 (2006). 10.1291/hypres.29.1013 [DOI] [PubMed] [Google Scholar]
- 8.Xie F., Liu W., Feng F., Li X., Yang L., Lv D., Qin X., Li L., and Chen L., Acta Biochim. Biophys. Sin. (Shanghai) 46, 699 (2014). 10.1093/abbs/gmu046 [DOI] [PubMed] [Google Scholar]
- 9.Wright A. R., Rees S. A., Vandenberg J. I., Twist V. W., and Powell T., J. Physiol. 488(Pt. 2), 293 (1995). 10.1113/jphysiol.1995.sp020967 [DOI] [PMC free article] [PubMed] [Google Scholar]
- 10.Belmonte S. and Morad M., J. Physiol. 586, 1379 (2008). 10.1113/jphysiol.2007.149294 [DOI] [PMC free article] [PubMed] [Google Scholar]
- 11.Giridharan G. A., Nguyen M.-D., Estrada R., Parichehreh V., Hamid T., Ismahil M. A., Prabhu S. D., and Sethu P., Anal. Chem. 82, 7581 (2010). 10.1021/ac1012893 [DOI] [PubMed] [Google Scholar]
- 12.Liu M.-C., Shih H.-C., Wu J.-G., Weng T.-W., Wu C.-Y., Lu J.-C., and Tung Y.-C., Lab Chip 13, 1743 (2013). 10.1039/c3lc41414k [DOI] [PubMed] [Google Scholar]
- 13.Nigro P., Abe J., and Berk B. C., Antioxid. Redox Signaling 15, 1405 (2011). 10.1089/ars.2010.3679 [DOI] [PMC free article] [PubMed] [Google Scholar]
- 14.Kao Y.-C., Hsieh M.-H., Liu C.-C., Pan H.-J., Liao W.-Y., Cheng J.-Y., Kuo P.-L., and Lee C.-H., Biomicrofluidics 8, 024107 (2014). 10.1063/1.4870401 [DOI] [PMC free article] [PubMed] [Google Scholar]
- 15.Hinderliter P. M., Minard K. R., Orr G., Chrisler W. B., Thrall B. D., Pounds J. G., and Teeguarden J. G., Part. Fibre Toxicol. 7, 36 (2010). 10.1186/1743-8977-7-36 [DOI] [PMC free article] [PubMed] [Google Scholar]
- 16.Wu C.-Y., Liao W.-H., and Tung Y.-C., Lab Chip 11, 1740 (2011). 10.1039/c0lc00620c [DOI] [PubMed] [Google Scholar]
- 17.Barngrover D., Thomas J., and Thilly W. G., J. Cell Sci. 78, 173 (1985). [DOI] [PubMed] [Google Scholar]
- 18.Slack-Davis J. K., Martin K. H., Tilghman R. W., Iwanicki M., Ung E. J., Autry C., Luzzio M. J., Cooper B., Kath J. C., Roberts W. G., and Parsons J. T., J. Biol. Chem. 282, 14845 (2007). 10.1074/jbc.M606695200 [DOI] [PubMed] [Google Scholar]
- 19.Tomasek J. J., Gabbiani G., Hinz B., Chaponnier C., and Brown R. A., Nat. Rev. Mol. Cell Biol. 3, 349 (2002). 10.1038/nrm809 [DOI] [PubMed] [Google Scholar]
- 20.Bernardo B. C., Weeks K. L., Pretorius L., and McMullen J. R., Pharmacol. Ther. 128, 191 (2010). 10.1016/j.pharmthera.2010.04.005 [DOI] [PubMed] [Google Scholar]
- 21.Chang Y.-W., Chang Y.-T., Wang Q., Lin J.-J., Chen Y.-J., and Chen C.-C., Mol. Cell Proteomics 12, 3094 (2013). 10.1074/mcp.M113.027649 [DOI] [PMC free article] [PubMed] [Google Scholar]
- 22.Franchini K. G., Torsoni A. S., Soares P. H., and Saad M. J., Circ. Res. 87, 558 (2000). 10.1161/01.RES.87.7.558 [DOI] [PubMed] [Google Scholar]
- 23.Torsoni A. S., Constancio S. S., W. Nadruz, Jr. , Hanks S. K., and Franchini K. G., Circ. Res. 93, 140 (2003). 10.1161/01.RES.0000081595.25297.1B [DOI] [PubMed] [Google Scholar]
- 24.DiMichele L. A., Doherty J. T., Rojas M., Beggs H. E., Reichardt L. F., Mack C. P., and Taylor J. M., Circ. Res. 99, 636 (2006). 10.1161/01.RES.0000240498.44752.d6 [DOI] [PMC free article] [PubMed] [Google Scholar]
- 25.Peng X., Kraus M. S., Wei H., Shen T. L., Pariaut R., Alcaraz A., Ji G., Cheng L., Yang Q., Kotlikoff M. I., Chen J., Chien K., Gu H., and Guan J. L., J. Clin. Invest. 116, 217 (2006). 10.1172/JCI24497 [DOI] [PMC free article] [PubMed] [Google Scholar]
- 26.Clemente C. F., Tornatore T. F., Theizen T. H., Deckmann A. C., Pereira T. C., Lopes-Cendes I., Souza J. R., and Franchini K. G., Circ. Res. 101, 1339 (2007). 10.1161/CIRCRESAHA.107.160978 [DOI] [PubMed] [Google Scholar]
- 27. W. Nadruz, Jr. , Corat M. A., Marin T. M., Guimaraes Pereira G. A., and Franchini K. G., Cardiovasc. Res. 68, 87 (2005). 10.1016/j.cardiores.2005.05.011 [DOI] [PubMed] [Google Scholar]
- 28.Torsoni A. S., Marin T. M., Velloso L. A., and Franchini K. G., Am. J. Physiol. Heart Circ. Physiol. 289, H1488 (2005). 10.1152/ajpheart.00692.2004 [DOI] [PubMed] [Google Scholar]


