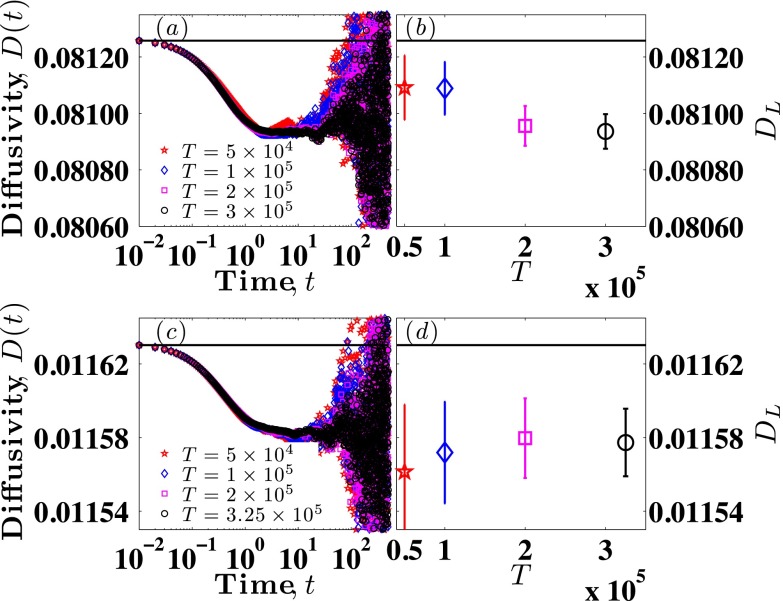
FIG. 6.
Convergence of DL for Nb = 6 and 41. (a) Time series D(t) based on different simulation lengths for Nb = 6, H = 6. (b) Mean value of DL as a function of simulation length T for Nb = 6, H = 6. (c) Time series D(t) based on different simulation lengths for Nb = 41, H = 6. (d) Mean value of DL as a function of simulation length T for Nb = 41, H = 6. Solid black lines in all four subplots indicate corresponding values of D(K) for that molecular weight.

