Abstract
When bacteria are exposed to osmotic stress, some cells recover and grow, while others die or are unculturable. This leads to a viable count growth curve where the cell number decreases before the onset of the exponential growth phase. From such curves, it is impossible to estimate what proportion of the initial cells generates the growth because it leads to an ill-conditioned numerical problem. Here, we applied a combination of experimental and statistical methods, based on optical density measurements, to infer both the probability of growth and the maximum specific growth rate of the culture. We quantified the growth potential of a bacterial population as a quantity composed from the probability of growth and the “suitability” of the growing subpopulation to the new environment. We found that, for all three laboratory media studied, the probability of growth decreased while the “work to be done” by the growing subpopulation (defined as the negative logarithm of their suitability parameter) increased with NaCl concentration. The results suggest that the effect of medium on the probability of growth could be described by a simple shift parameter, a differential NaCl concentration that can be accounted for by the change in the medium composition. Finally, we highlighted the need for further understanding of the effect of the osmoprotectant glycine betaine on metabolism.
INTRODUCTION
In food microbiology studies, the maximum specific growth rate of a bacterial population in a given static environment is routinely estimated by (mostly empirical) predictive models based on viable-count measurements (1) (www.combase.cc). These models take key environmental factors, such as temperature, pH, and water activity, as the explanatory variables. Their relative accuracy is between 5 and 10% if the prediction is made in the interpolation region of the data used to develop the model and if the effect of only one environmental factor is considered while the other factors are close to optimal (2).
The maximum specific growth rate, μ, is an autonomous parameter; i.e., it is independent of the history of the cells and depends only on the growth conditions. Compared to the growth rate, the lag period has been studied little, although its exact and quantitative characterization is vital to understand the ability of microbes to survive and proliferate under a wide range of conditions (3), and modeling the adaptation to environmental stress especially remains a challenge in food microbiology studies (4). Another parameter, which characterizes the adaptation of bacteria to environmental stress, is the probability of growth. It is usually modeled under static conditions, either independently of the growth rate (5, 6) or as part of a set of models describing the effect of environmental factors on various response parameters within a space where growth is possible (7–9). No attempt has yet been made to include probability of growth in kinetic models describing the temporal variation of bacterial cell concentration under stress conditions.
Under osmotic stress, bacteria divide into two subpopulations: one adapts and grows exponentially, while the other does not proliferate (10). This may be because the cells die or are in a persistent state (3) or are viable but nonculturable (10). In this case, the viable count growth curve exhibits a decrease after inoculation, described as the phoenix phenomenon (11). When trying to estimate the fraction of the initial cells, p0, that produces the exponentially growing lineage, the numerical task leads to an ill-conditioned problem (10).
It has been demonstrated that, theoretically, an approach based on a quantification of the physiological state of the growing cell population, defined by the expression α0 = exp(−μλ) (λ being the population lag time), is a quantity compatible with probability concepts (12). This is because α0, a number between 0 and 1, represents the fraction of the initial cell population, x0, that could have produced the observed exponential phase, had the cells grown from the α0x0 level at the specific rate μ without a lag period. This lends itself to introducing the growth potential of the population as follows.
The overall lag of the population, λa, is defined as
| (1) |
This parameter is a delay in the onset of exponential growth. The exponential growth phase can be described by the linear function
| (2) |
where y(t) is the natural logarithm of the cell concentration, meant for time t > λa (12). This concept was studied by K. Koutsoumanis (13), too, using colony counts.
We applied a method based on optical density measurements (14) for the parallel estimation of the main parameters above: the probability of growth, p0, the maximum specific growth rate, μ, and the physiological state parameter of the growing subpopulation. From these parameters, λa can be calculated. We utilized this method to study the effect of the medium composition on the probability of growth of Salmonella enterica serovar Typhimurium under osmotic stress.
MATERIALS AND METHODS
Strain.
Salmonella enterica serovar Typhimurium strain SL1344 was maintained in basic minimal medium (BMM) (10) with 40% glycerol or in tryptone soy broth (TSB) with 40% glycerol, stored at −80°C. Before each experiment, Salmonella was subcultured twice in BMM or TSB and incubated at 37°C for 7 h and 17 h.
Growth conditions.
The osmotic stress of three media, Luria-Bertani medium (LB; 10 g liter−1 tryptone, 5 g liter−1 yeast extract, 10 g liter−1 NaCl), BMM, and BMM with glycine betaine (150 μM glycine betaine [Sigma Chemical Co., United Kingdom] added as an osmoprotectant), was increased by adding NaCl; LB with up to 55 g liter−1 NaCl added (equivalent to 6.5% total NaCl), BMM with up to 35 g liter−1 NaCl added, and BMM plus betaine with up to 55 g liter−1 NaCl added.
Growth curves.
Cultures (17 h at 37°C) in TSB and BMM were diluted and inoculated into 100 ml of prewarmed (37°C) growth medium, from TSB to LB and from BMM to BMM both with and without glycine betaine. Sampling was carried out at appropriate intervals up to 15 days according to the growth conditions. The growth curves were measured by plate counts on tryptone soy agar (TSA) (CM0131; Oxoid). The experiments were repeated, and the results reported are averages for replicate samples.
Bioscreen experiments.
Salmonella Typhimurium SL1344 was grown from frozen stock in BMM or TSB plus 40% glycerol for 7 h at 37°C. An inoculum of 25 μl was placed in 10 ml fresh BMM or TSB and incubated at 37°C for 17 h. Based on plate counts of test cultures in TSB or BMM incubated at 37°C for 17 h, a dilution series was devised to ultimately give a concentration of 1 cell in 50 μl. For the Bioscreen experiments, cultures were diluted in the test media, e.g., BMM plus NaCl and glycine betaine or LB plus NaCl, by serial 10-fold dilutions, and then these were further diluted 1 in 2 and, for the highest 10-fold dilution, up to 1 in 64. Wells of a pair of Bioscreen plates (100 wells on each plate) were then filled with 50 μl diluted cells and 350 μl test medium. Each well of the first plate was inoculated with a target concentration of 1 cell per well. This was obtained by a series of binary dilutions. On the other plate, 50 wells were inoculated with ca. 2 cells, 25 wells with 4 cells, 12 with 8 cells, and 5 with 16 cells. These cultures were suitable for studying the stochastic birth/death process of single (or at least few) cells. The remaining 8 wells of this second plate represented population kinetics: they were inoculated with ca 32, 64, 320, 640, 3,200, 6,400, 32,000, and 64,000 cells. Plates were incubated in the Bioscreen at 37°C for up to 10 days. The number of cells inoculated into each well was estimated from plate counts of the highest 10-fold dilution.
Estimation of the probability of growth for a single cell (p0).
The total number of cells, ρa, inoculated in the 100 wells of the first microtiter plate, was estimated by plate counts. The aim was to obtain ca. 1-cell/well via dilutions, so we made sure that ρa was around 100. The relative standard deviation (RSD) of the plate count method is usually ca. 10 to 15% (1). As shown in Table A1, our plate count accuracy was 10% or less, so we took RSD2[ρa] to be ≈0.01.
After incubation in the Bioscreen, the number of negative wells (i.e., where no growth was detected) was recorded. Negative wells could appear only if the number of initial cells or the probability of growth was low. The number of cells in a well follows the Poisson distribution with the parameter ρ = ρa/n. The expected total number of growing cells on the plate is , where w0 is the number of negative wells (where no growth was observed). This formula is meaningful only for 0 < w0 < n.
An estimator for the probability of growth of a single cell is
| (3) |
The method of C. Dupont and J. C. Augustin (15) was based on the same formula. Note that, at our ρa ≈100-cell/plate target concentration, holds only if w0 > n/e, where e equals exp(1) ≈ 2.718. Therefore, we included only experiments where 37 < w0 < n = 100.
In Appendix, we provide a formula for the RSD2 of the numerator of . Using the result that the RSD2 of the ratio of independent variables can be estimated by the sum of the RSD2 values of the numerator and denominator (16), the accuracy of the above statistic can be approximated by
| (4) |
The error bars on Fig. 1 are calculated from the above estimation. A simulation study was also carried out to show that this is an accurate estimation of the expected relative error of (see Fig. A1).
FIG 1.
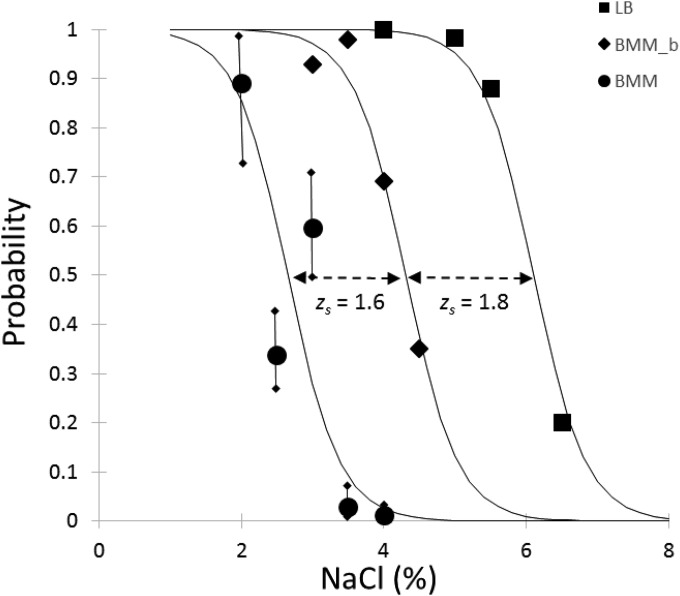
Effect of NaCl concentration on the probability of growth of Salmonella single cells. Data were obtained by Bioscreen based on equation 3. Error bars based on equation 4 are also shown for the results in BMM. The measured probabilities were fitted by weighted logistic regression. An F test showed that the maximum slopes could be considered identical in the three media; therefore, the s0 parameter (the NaCl percentage where the probability of growth is 0.5) characterizes the effect of the medium composition on the probability of growth: s0 = 6.1% in LB, 4.3% in BMM with glycine betaine (BMM_b), and 2.7% in BMM. The solid lines show the fit with the same maximum slope for the three media.
Estimation of the maximum specific growth rate, μ, and the physiological state, α0, from OD detection time data.
From an optical density (OD) curve of growth in a well, let Tdet denote the time necessary to reach a detection level, which we set as an ODdet of 0.25. The Tdet detection times were estimated for wells with high inocula. The maximum specific growth rate was estimated by the negative reciprocal of the differential quotient
| (5) |
using only the last 8 wells where the expected number of inoculated cells was more than 30 (14). The physiological state of the growing subpopulation, α0, was determined by averaging the transformed Tdet values of the other 192 wells, as in reference 14.
RESULTS
Primary model: growth response parameters obtained from Bioscreen experiments.
Table 1 shows the probability of growth for single cells of Salmonella, the physiological state, and the maximum specific growth rate of the growing subpopulation under various conditions in the three media. All three parameters decrease with NaCl concentration.
TABLE 1.
Estimations of growth response parameters obtained from Bioscreen experiments at different NaCl concentrations in three different media
| Medium | s (%) | p0a | α0b | ln μ (h−1)c |
|---|---|---|---|---|
| LB | 4.0 | 1.00 | 0.0468 | 1.100 |
| 5.0 | 0.98 | 0.0185 | 0.740 | |
| 5.5 | 0.88 | 0.0165 | 0.590 | |
| 6.5 | 0.20 | 0.0013 | 0.330 | |
| BMM + betaine | 3.0 | 0.93 | 0.0418 | 0.474 |
| 3.5 | 0.98 | 0.0365 | 0.384 | |
| 4.0 | 0.69 | 0.3208 | 0.350 | |
| 4.5 | 0.35 | 0.0187 | 0.270 | |
| BMM | 2.0 | 0.89 | 0.0199 | 0.445 |
| 2.5 | 0.34 | 0.0342 | 0.290 | |
| 3.0 | 0.60 | 0.0036 | 0.232 | |
| 3.5 | 0.03 | NDd | 0.200 | |
| 4.0 | 0.01 | ND | 0.140 |
Physiological state of the growing subpopulation (17).
Probability of growth.
Natural log of the specific growth rate.
ND, not determined. The physiological state could not be evaluated in these conditions because there were not enough data due to the low probability of growth.
Secondary models: modeling the effect of NaCl and medium on the response parameters.
To compare the effect of the growth medium on p0, the data were fitted by weighted logistic regression as a function of s, the NaCl concentration, where the weights were derived from the above error estimation for :
| (6) |
Here, a is a coefficient characterizing the maximum slope of the sigmoid curve describing the effect of NaCl variation on the probability of growth (Fig. 1), and s0 is the salt concentration where that probability is 0.5. An F test showed that the rate parameter a could be assumed to be the same in the different media (P = 0.56); therefore, it was a reasonable simplification that the three models for the probability of growth should differ from each other only by a zs shift in NaCl. The best fit for the parameter a was 2.7, while the s0 parameters were estimated as 6.1% in LB, 4.3% in BMM with glycine betaine, and 2.7% in BMM without osmoprotectant.
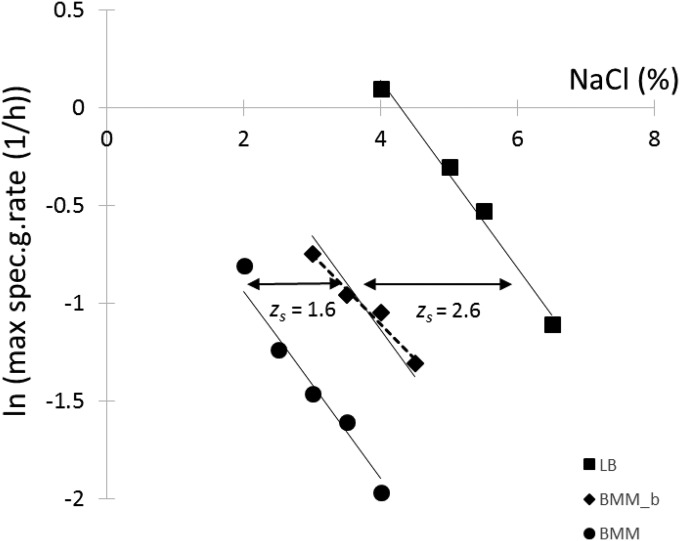
A similar effect of the medium could be observed with the growth rate. Figure 2 shows the logarithm of the specific growth rates measured by Bioscreen as a function of NaCl in the three media. The data were fitted by linear regression. An F test showed that the three slopes could be considered identical (P = 0.12); therefore, only the intercept with the NaCl axis, s1, should depend on the medium. The common slope (b) of −0.478 and the intercept values of 4.3% in LB, 1.6% in BMM with glycine betaine, and 0.04% in BMM characterize the three responses. The shift in percent NaCl caused by the media is denoted by zs in the figures. Between BMM and BMM with glycine betaine, this shift turned out to be the same as with the model for the probability of growth.
FIG 2.
Effect of NaCl concentration on the natural logarithm of the specific growth rate (μ) of Salmonella. Data were obtained by Bioscreen based on equation 5. The measured maximum specific growth rates were fitted by linear regression. An F test showed that the slopes could be considered identical in the three media; therefore, the intercept with the NaCl axis, s1, characterizes the effect of the medium composition on the growth rate: s1 = 4.3% in LB, 1.6% in BMM with glycine betaine (BMM_b), and 0.04% in BMM. The broken line shows the fitted line if the measured ln(μ) values for BMM with glycine betaine had been fitted independently of the other data. The solid lines show the fit with the same slope for the three media.
Finally, the h0 = −ln(α0) values (17) were plotted against −ln(p0) as shown in Fig. 3. Only a slight positive correlation could be shown between them (P > 0.1), so h0 was taken as a constant, namely, the average of its estimates (3.85) from the primary models.
FIG 3.
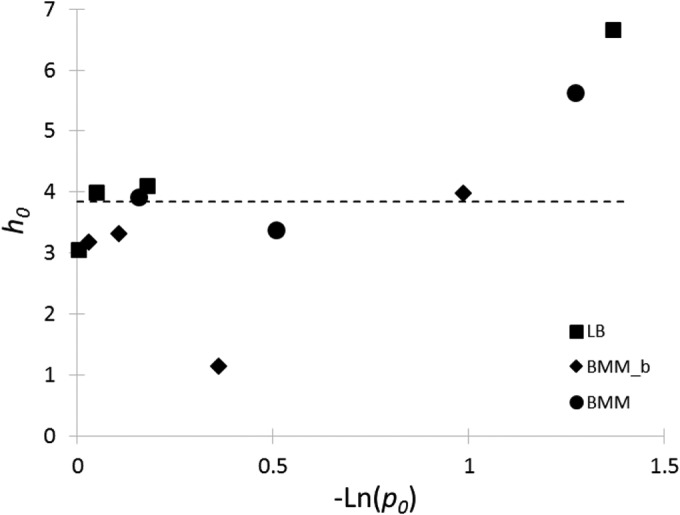
No strong correlation could be shown between the work-to-be-done parameter, h0 = −ln(α0), and the negative logarithm of the modeled probability of growth, −ln(p0), so h0 was taken as a constant, the average of its estimates, independently of the medium. BMM_b, BMM with glycine betaine.
Comparison of the response parameters obtained in the Bioscreen and by plate counts.
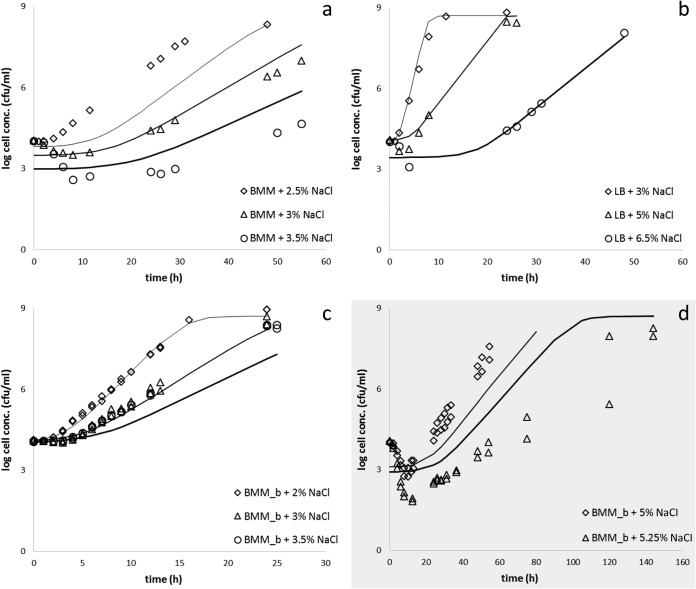
From the secondary models described above, growth curves were generated assuming that the growing subpopulation grows according to the model of Baranyi and Roberts (17) and that the nongrowing one follows linear death kinetics. The maximum population density was considered a constant, 5 × 10⁸ CFU ml−1 in all cases. The predictions, based on Bioscreen data, were compared to growth curves generated by plate counts. The results are shown in Fig. 4. The predictions were mostly in agreement with the plate count measurements except for the 2.5% NaCl concentration in BMM, where the lag time predicted was longer than that measured by plate count. The plate count was almost identical for 3 and 3.5% NaCl, though the Bioscreen results predicted ca. 20% less growth. At high salt concentrations, 5 and 5.25% NaCl in BMM with glycine betaine, we could not generate Bioscreen data, presumably due to the very small probability of growth. Therefore, the prediction at 5.25% NaCl is an extrapolation and, not surprisingly, differs from the data measured by plate counts (Fig. 4d).
FIG 4.
Comparison of the growth curves predicted from the Bioscreen data (continuous lines) with growth curves measured by plate counts in BMM (a), LB (b), and BMM with glycine betaine (BMM_b) (c) and extrapolation of the Bioscreen results in BMM with glycine betaine (d). The continuous lines represent the respective predicted curves of the growing subpopulation.
DISCUSSION
Growth rate determined in the Bioscreen and by plate count.
The measurement of bacterial kinetics by optical density has been widely studied. To estimate the specific growth rate by our method using Bioscreen data, an important condition is that the detection level be reached in the exponential phase and that the OD curves from different inocula be parallel. In this case, the method is robust, as shown by references 14, 18, and 19. Our validation data corroborate these findings; as shown in Fig. 5, there is no significant difference in the specific growth rate determined by viable counts and that determined by the Bioscreen, when the cells grow in BMM and in LB. However, with glycine betaine added to BMM, there is a systematic bias of more than 20%.
FIG 5.
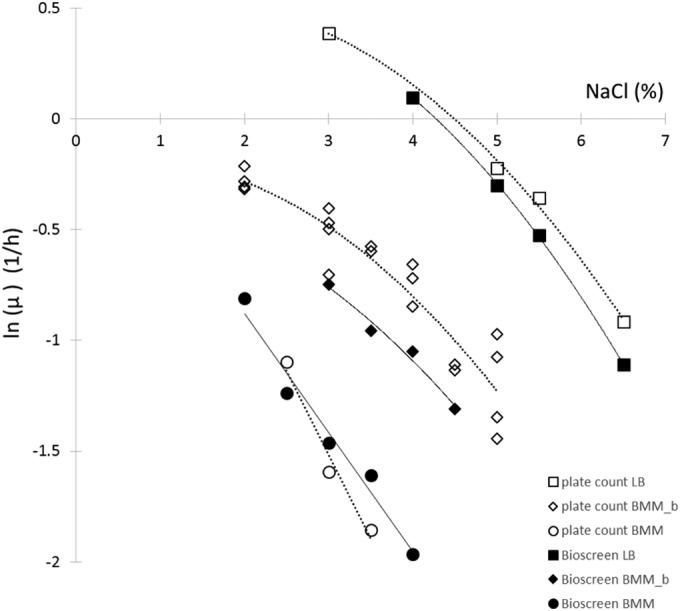
Comparison between the natural logarithm of the specific growth rates obtained from viable-count experiments and those from Bioscreen using different media. Glycine betaine is a less efficient osmoprotectant in the wells of the microtiter plate than in broth.
We observed the same difference (20) between the specific growth rate estimations, when Escherichia coli was grown under osmotic stress with and without glycine betaine or choline in the minimal medium. In a previous publication (20), we showed that the metabolic response of E. coli to osmotic stress in the presence of these osmoprotectants switched at a threshold NaCl concentration where the growth yield was optimum. With Salmonella, in the presence of glycine betaine, we found an optimum growth yield at the NaCl concentration where the probability of growth decreases (between 3.9 and 4.5% NaCl; data not shown).
The mechanism by which osmoprotectants work is not clear. Glycine betaine, for example, is believed to be metabolically inactive, but our results suggest that its interaction with metabolism may go beyond just restoring some of the turgor of the cell by replacing water (21, 22). Figure 5 suggests that the presence of glycine betaine in minimal medium had a protective effect compensating for a zs value of 1.6%, compared to minimal medium on its own in the Bioscreen, while it was about 2% under the same conditions when Salmonella was cultured in 100-ml vessels. Since the switch we observed with E. coli was from aerobic to fermentative pathways and the only parameter that may differ in the viable count and in the Bioscreen experiments is oxygen availability, it is reasonable to hypothesize that glycine betaine is also linked to respiration.
The work-to-be-done parameter and osmotic stress.
As proven by (12), the observed overall lag time of the whole population (i.e., the delay to the onset of exponential growth) is
| (7) |
where p0 is the fraction of the initial cells whose lineages produce exponential growth, λg is the lag time of the growing subpopulation, and λa denotes the overall lag time (see also equations 1 and 2). S. J. Pirt (23) called λa “apparent lag.” Instead of replicate experiments, as described by Dupont and Augustin (15), the error of the statistic was estimated by equation 4, whose accuracy is shown in Fig. A1. It is an open question whether the overall variability shown in Fig. 1 can be largely explained by the measurement method or whether biological heterogeneity also significantly contributes to it.
The procedure elaborated in reference 14 was valid for an environment where all cells grew (p0 = 1), based on the mathematically proved theorem that, under certain homogeneity conditions, the average, α0, is independent of the inoculum. This parameter is convenient to quantify the physiological state, a kind of quantification of how suitable the growing cells are to the environment.
The expression β0 = α0 · p0 is a parameter quantifying the growth potential of the population. The natural logarithm of its first component, h0 = −ln(α0), has been used by several authors to quantify the “work to be done” by the growing cells. The second part takes into account that in fact only a fraction of the initial cell population is producing the exponential growth.
The h0 work-to-be-done parameter has been shown to be independent of the growth conditions if the cells are pretreated in a systematic way for stresses like temperature (24) but to increase with osmotic stress (10, 25). Figure 3 suggests that both h0 and −ln(p0) increase, so both α0 and p0 decrease with stress, but the correlation was weak (P > 0.1), and for the sake of simplicity, h0 was taken as a constant in the predictions. More data would be necessary for a decisive analysis.
Effect of growth medium on the growth response parameters.
A quantification of bias is often used to compare the effect of the growth medium on the growth rate (8, 26). Here, we observed a systematic bias between the different media, although it depended on the measurement method; it was not the same when measured in the Bioscreen as when measured by plate count. A similar systematic shift could be observed for the probability of growth between the different media. In fact, this may be reformulated, based on a generalized z value concept, proposed by Pin et al. (27), as follows: in terms of probability of growth, the addition of glycine betaine to minimal medium is equivalent, at least in the studied region of NaCl, to a zs value of −1.6% NaCl, or a change from minimal medium to LB corresponds to a zs value of −3.5% NaCl. In terms of growth rate, the zs values as measured in the Bioscreen would be −1.6% and −4.2% NaCl, respectively. These concepts could help to develop useful interpretations for the food industry, where NaCl, a widely used preservative, needs to be reduced because of health issues.
Conclusions.
In this study, we have shown that the introduced quantification of the growth potential of a bacterial culture, consisting of the proportion of the growing subpopulation (identified by the probability of growth for a single cell) and the suitability of these growing cells, is measurable by optical density experiments, in parallel with the specific growth rate of the population. These experiments lead to a robust description of the effect of rich and minimal media, with and without osmoprotectant, on the probability of growth of Salmonella under osmotic stress. A simple shift parameter of the added NaCl concentration answered the question of what amount of NaCl can be accounted for by adding an osmoprotectant. We also highlighted a gap in our biological understanding of the mechanism by which the osmoprotectant glycine betaine works, a typical area where systems biology approaches should be integrated in predictive modeling in food (28, 29).
It is important to see that, unlike the time to division for a single cell, the growth potential of an inoculated cell can be inferred retrospectively only, from the time when its isogenic descendants are growing exponentially. It can be envisaged as an environment- and history-dependent parameter encoded in the biochemical network of that initial single cell. The situation is similar to the specific growth rate that can be observed at the population level only; it is in fact a parameter derivable from the probability distribution of single-cell generation times.
The quantification, measurement, and modeling of growth potential of food-borne pathogens have special importance in quantitative microbial risk assessment, to which we hope to contribute with the present study.
ACKNOWLEDGMENT
We gratefully acknowledge the support of the Biotechnology and Biological Sciences Research Council (BBSRC), via the Institute Strategic Programme BB/J004529/1: The Gut Health and Food Safety ISP.
APPENDIX
It can be readily seen that the number of growing cells follow the Poisson distribution with the ρp0 mean value, where ρ is the average number of initial cells in a well and p0 is the probability of growth for a cell.
The number of negative wells on a plate, w0, can be conceived as the number of failures in a Bernoulli experiment of n trials, with individual probabilities of e−ρp0. For the variance of their ratio,
| (A1) |
From the first-order approximation of the natural log function around e−ρp0:
| (A2) |
| (A3) |
Using ρ · p0 ≈ ln n − ln w0, a practical approximation can be derived:
| (A4) |
Table A1 shows that the accuracy of our plate count measurements is generally around or less than 10%; therefore, for our statistic
| (A5) |
an accuracy estimation can be obtained as
| (A6) |
This estimation was validated by a simulation study (Fig. A1).
TABLE A1.
Three replicate plate counts to estimate cell concentrationa
| Medium | s (%) | Plate count (colonies/100 μl) in replicate |
SD | RSD (%) | ||
|---|---|---|---|---|---|---|
| 1 | 2 | 3 | ||||
| BMM | 2 | 133 | 141 | 132 | 4.93 | 3.64 |
| 2.5 | 119 | 135 | 138 | 10.21 | 7.82 | |
| 3 | 102 | 126 | 123 | 13.08 | 11.18 | |
| 3.5 | 129 | 116 | 147 | 15.57 | 11.91 | |
| BMM + betaine | 3 | 131 | 137 | 143 | 6.00 | 4.38 |
| 3.5 | 116 | 118 | 134 | 9.87 | 8.04 | |
| 4 | 135 | 122 | 139 | 8.89 | 6.73 | |
The relative error (RSD) is around or less than 10%. The RSD remains the same when the culture is diluted, so the estimated number of cells on a plate of 100 wells has the same relative error.
FIG A1.
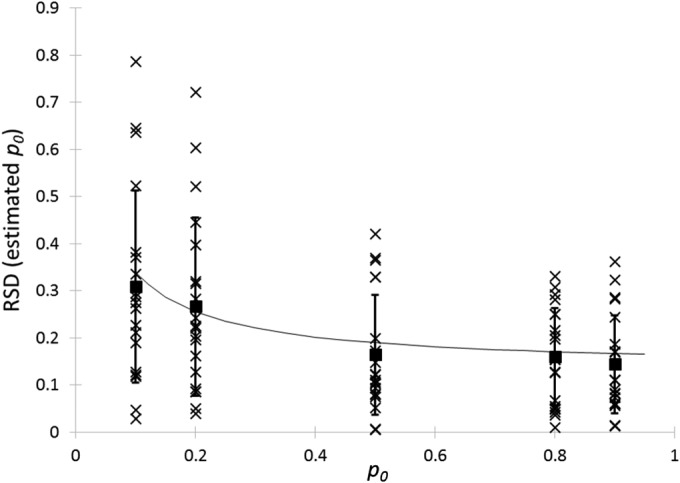
Simulation study where ρa (the number of cells on a plate of 100 wells) has an average value of 100 and its relative error is 10% (due to dilutions when the cells were inoculated into wells). The number of cells per well follows the Poisson distribution with the mean ρ value of ρa/100. Each cell grows with p0 probability (p0 = 0.1, 0.2, 0.5, 0.8, and 0.9 on this plot). For each p0, ten independent estimates are shown (crosses) with their averages (squares with error bars). The theoretical estimate (line) is based on equation A6.
REFERENCES
- 1.Baranyi J, Tamplin ML. 2004. ComBase: a common database on microbial responses to food environments. J Food Prot 67:1967–1971. [DOI] [PubMed] [Google Scholar]
- 2.Baranyi J, Csernus O, Beczner J. 2014. Error analysis in predictive modelling demonstrated on mould data. Int J Food Microbiol 170:78–82. doi: 10.1016/j.ijfoodmicro.2013.10.018. [DOI] [PubMed] [Google Scholar]
- 3.Fridman O, Goldberg A, Ronin I, Shoresh N, Balaban NQ. 2014. Optimization of lag time underlies antibiotic tolerance in evolved bacterial populations. Nature 513:418–421. doi: 10.1038/nature13469. [DOI] [PubMed] [Google Scholar]
- 4.McMeekin T, Olley J, Ratkowsky D, Corkrey R, Ross T. 2013. Predictive microbiology theory and application: is it all about rates? Food Control 29:290–299. doi: 10.1016/j.foodcont.2012.06.001. [DOI] [Google Scholar]
- 5.Koutsoumanis KP, Kendall PA, Sofos JN. 2004. Modeling the boundaries of growth of Salmonella typhimurium in broth as a function of temperature, water activity, and pH. J Food Prot 67:53–59. [DOI] [PubMed] [Google Scholar]
- 6.Ratkowsky DA, Ross T. 1995. Modeling the bacterial-growth no growth interface. Lett Appl Microbiol 20:29–33. doi: 10.1111/j.1472-765X.1995.tb00400.x. [DOI] [Google Scholar]
- 7.Mejlholm O, Dalgaard P. 2009. Development and validation of an extensive growth and growth boundary model for Listeria monocytogenes in lightly preserved and ready-to-eat shrimp. J Food Prot 72:2132–2143. [DOI] [PubMed] [Google Scholar]
- 8.Augustin JC, Zuliani V, Cornu M, Guillier L. 2005. Growth rate and growth probability of Listeria monocytogenes in dairy, meat and seafood products in suboptimal conditions. J Appl Microbiol 99:1019–1042. doi: 10.1111/j.1365-2672.2005.02710.x. [DOI] [PubMed] [Google Scholar]
- 9.Le Marc Y, Huchet V, Bourgeois CM, Guyonnet JP, Mafart P, Thuault D. 2002. Modelling the growth kinetics of Listeria as a function of temperature, pH and organic acid concentration. Int J Food Microbiol 73:219–237. doi: 10.1016/S0168-1605(01)00640-7. [DOI] [PubMed] [Google Scholar]
- 10.Zhou K, George SM, Metris A, Li PL, Baranyi J. 2011. Lag phase of Salmonella enterica under osmotic stress conditions. Appl Environ Microbiol 77:1758–1762. doi: 10.1128/AEM.02629-10. [DOI] [PMC free article] [PubMed] [Google Scholar]
- 11.Kelly AF, Martinez-Rodriguez A, Bovill RA, Mackey BM. 2003. Description of a “phoenix” phenomenon in the growth of Campylobacter jejuni at temperatures close to the minimum for growth. Appl Environ Microbiol 69:4975–4978. doi: 10.1128/AEM.69.8.4975-4978.2003. [DOI] [PMC free article] [PubMed] [Google Scholar]
- 12.Baranyi J, Metris A, George SM. 2015. Bacterial economics: adaptation to stress conditions needs stage-wise changes in the response mechanism. Food Microbiol 45B:162–166. doi: 10.1016/j.fm.2014.05.023. [DOI] [PubMed] [Google Scholar]
- 13.Koutsoumanis K. 2008. A study on the variability in the growth limits of individual cells and its effect on the behavior of microbial populations. Int J Food Microbiol 128:116–121. doi: 10.1016/j.ijfoodmicro.2008.07.013. [DOI] [PubMed] [Google Scholar]
- 14.Baranyi J, Pin C. 1999. Estimating bacterial growth parameters by means of detection times. Appl Environ Microbiol 65:732–736. [DOI] [PMC free article] [PubMed] [Google Scholar]
- 15.Dupont C, Augustin JC. 2009. Influence of stress on single-cell lag time and growth probability for Listeria monocytogenes in half Fraser broth. Appl Environ Microbiol 75:3069–3076. doi: 10.1128/AEM.02864-08. [DOI] [PMC free article] [PubMed] [Google Scholar]
- 16.Bevington PR. 1969. Data reduction and error analysis for the physical sciences. p 58–64. McGraw-Hill, New York, NY. [Google Scholar]
- 17.Baranyi J, Roberts TA. 1994. A dynamic approach to predicting bacterial growth in food. Int J Food Microbiol 23:277–294. doi: 10.1016/0168-1605(94)90157-0. [DOI] [PubMed] [Google Scholar]
- 18.Cuppers HGAM, Smelt JPPM. 1993. Time to turbidity measurement as a tool for modeling spoilage by Lactobacillus. J Ind Microbiol 12:168–171. doi: 10.1007/BF01584186. [DOI] [Google Scholar]
- 19.Dalgaard P, Koutsoumanis K. 2001. Comparison of maximum specific growth rates and lag times estimated from absorbance and viable count data by different mathematical models. J Microbiol Methods 43:183–196. doi: 10.1016/S0167-7012(00)00219-0. [DOI] [PubMed] [Google Scholar]
- 20.Metris A, George SM, Mulholland F, Carter AT, Baranyi J. 2014. Metabolic shift of Escherichia coli under salt stress in the presence of glycine betaine. Appl Environ Microbiol 80:4745–4756. doi: 10.1128/AEM.00599-14. [DOI] [PMC free article] [PubMed] [Google Scholar]
- 21.Record MT Jr, Courtenay ES, Cayley S, Guttman HJ. 1998. Biophysical compensation mechanisms buffering E. coli protein-nucleic acid interactions against changing environments. Trends Biochem Sci 23:190–194. doi: 10.1016/S0968-0004(98)01207-9. [DOI] [PubMed] [Google Scholar]
- 22.Sleator RD, Hill C. 2002. Bacterial osmoadaptation: the role of osmolytes in bacterial stress and virulence. FEMS Microbiol Rev 26:49–71. doi: 10.1111/j.1574-6976.2002.tb00598.x. [DOI] [PubMed] [Google Scholar]
- 23.Pirt SJ. 1975. Principles of microbe and cell cultivation. Blackwell Scientific, Oxford, United Kingdom. [Google Scholar]
- 24.Mellefont LA, Ross T. 2003. The effect of abrupt shifts in temperature on the lag phase duration of Escherichia coli and Klebsiella oxytoca. Int J Food Microbiol 83:295–305. doi: 10.1016/S0168-1605(02)00378-1. [DOI] [PubMed] [Google Scholar]
- 25.Mellefont LA, McMeekin TA, Ross T. 2003. The effect of abrupt osmotic shifts on the lag phase duration of foodborne bacteria. Int J Food Microbiol 83:281–293. doi: 10.1016/S0168-1605(02)00377-X. [DOI] [PubMed] [Google Scholar]
- 26.Baranyi J, Pin C, Ross T. 1999. Validating and comparing predictive models. Int J Food Microbiol 48:159–166. doi: 10.1016/S0168-1605(99)00035-5. [DOI] [PubMed] [Google Scholar]
- 27.Pin C, de Fernando GDG, Ordonez JA, Baranyi J. 2001. Applying a generalized z-value concept to quantify and compare the effect of environmental factors on the growth of Listeria monocytogenes. Food Microbiol 18:539–545. doi: 10.1006/fmic.2001.0439. [DOI] [Google Scholar]
- 28.Metris A, George S, Baranyi J. 2012. Modelling osmotic stress by flux balance analysis at the genomic scale. Int J Food Microbiol 152:123–128. doi: 10.1016/j.ijfoodmicro.2011.06.016. [DOI] [PubMed] [Google Scholar]
- 29.Pin C, Metris A, Baranyi J. 2013. Next generation of predictive models, p 498 In Sofos J. (ed), Advances in microbial food safety, vol 1 Woodhead Publishing Ltd., Cambridge, United Kingdom. [Google Scholar]


