Abstract
Study Design
The effectiveness and efficacy of Iyengar yoga for chronic low back pain (CLBP) were assessed with intention-to-treat and per-protocol analysis. Ninety subjects were randomized to a yoga (n=43) or control group (n=47) receiving standard medical care (SMC). Participants were followed 6 months after completion of the intervention.
Objective
This study aimed to evaluate Iyengar yoga therapy on chronic low back pain. Yoga subjects were hypothesized to report greater reductions in functional disability, pain intensity, depression, and pain medication usage than controls.
Summary of Background Data
CLBP is a musculoskeletal disorder with public health and economic impact. Pilot studies of yoga and back pain have reported significant changes in clinically important outcomes.
Methods
Subjects were recruited through self-referral and health professional referrals according to explicit inclusion/exclusion criteria. Yoga subjects participated in 24 weeks of biweekly yoga classes designed for CLBP. Outcomes were assessed at 12 (midway), 24 (immediately after) and 48 weeks (6 month follow-up) after the start of the intervention using the Oswestry Disability Questionnaire, a Visual Analog Scale, the Beck Depression Inventory, and a pain medication-usage questionnaire.
Results
Using intention-to-treat analysis with repeated measures ANOVA (group × time), significantly greater reductions in functional disability and pain intensity were observed in the yoga group when compared to the control group at 24 weeks. A significantly greater proportion of yoga subjects also reported clinical improvements at both 12 and 24 weeks. In addition, depression was significantly lower in yoga subjects. Furthermore, while a reduction in pain medication occurred, this was comparable in both groups. When results were analyzed using per-protocol analysis, improvements were observed for all outcomes in the yoga group, including a greater trend for reduced pain medication usage. Although slightly less than at 24 weeks, the yoga group had statistically significant reductions in functional disability, pain intensity and depression compared to SMC 6-months post-intervention.
Conclusions
Yoga improves functional disability, pain intensity, and depression in adults with CLBP. There was also a clinically important trend for the yoga group to reduce their pain medication usage compared to the control group.
Introduction
Widely prevalent and expensive to treat, low back pain (LBP) is a major public health issue. In the United States, where 70–85% of the population experience at least one episode of back pain in their lifestime,1 2 low back pain treatment represents the largest category of medical claims (20–25%)3 and exceeds $34 billion in annual direct medical costs.4
Complementary Alternative Medicine (CAM) utilization has increased nearly 10% in recent years,5 with back pain as the most commonly reported reason for its use.6 7 One of the most common CAM activities is yoga, with participation reported at approximately 14.9 million in the U.S.8
Despite limitations, research addressing the effects of yoga on chronic low back pain (CLBP) has shown promise. Two studies evaluating Hatha yoga showed decreases in pain as well as improvements in balance, hip flexibility, disability, and depression. However, one9 lacked a control group and the other10 was not adequately powered. In addition, Sherman, et al.,11 found that when compared to a self-care book, 12 weekly 75-minute Viniyoga classes resulted in both statistically and clinically significant improvements in functional status but when compared to conventional therapeutic exercises, were statistically significant but not clinically important.
Iyengar yoga, currently the most prevalent style of yoga practiced by yoga journal subscribers (44%),12 is based on the teachings of the yoga master B.K.S. Iyengar.13 14 In his 70 years of teaching, he has applied therapeutic variations of classical poses to many health problems including CLBP.13 While a number of anecdotal reports have supported the effectiveness of Iyengar yoga therapy for CLBP, we are aware of only one published scientific evaluation of such an intervention.15 This 16-week, randomized controlled trial, in subjects with minimal disability due to nonspecific CLBP, resulted in significant reductions in pain intensity, functional disability, and self-reported pain medication usage in the yoga group compared to an educational control group.15
The purpose of this study was to assess the effectiveness and efficacy of a 24-week Iyengar yoga intervention in comparison with standard medical care (SMC). It was hypothesized that when compared to a control group of subjects receiving SMC and monthly follow-up calls, subjects receiving Iyengar yoga therapy for CLBP would have greater improvements in pain-related outcomes including functional disability, pain intensity, depression, and pain medication usage.
Materials and Methods
Participants
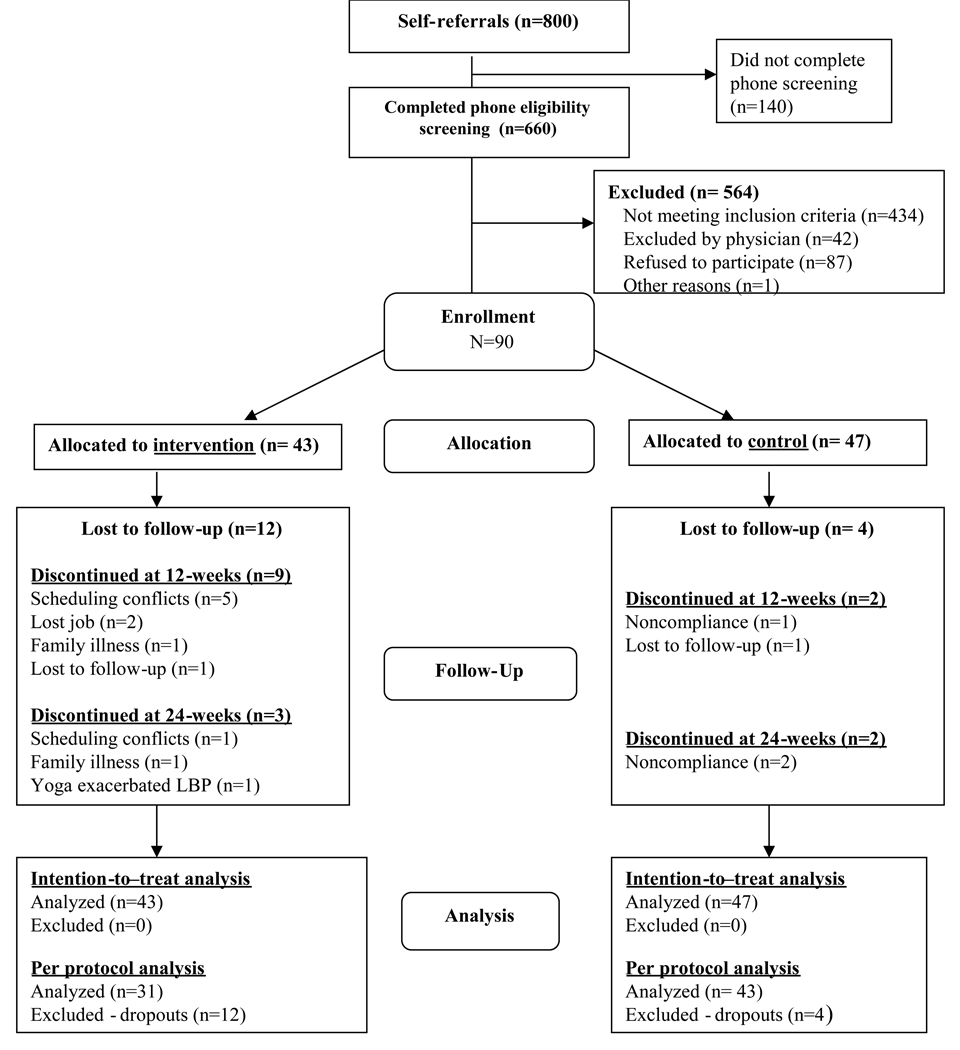
Approval was obtained from the West Virginia University Institutional Review Board and the study proceeded as outlined in Figure 1. Initial eligibility was determined during a telephone interview. Study inclusion and exclusion criteria are listed in Table 1.
Figure 1. Participant flow through the randomized trial.
Table 1.
Study Inclusion and Exclusion Criteria
| Inclusion | Exclusion |
|---|---|
| age 18 – 70 live within one hour drive of Morgantown insured by a participating provider English speaking BMI <37 LBP with symptoms persisting for > 3 months ODI score 10–60 VAS score of 3–8 cm |
LBP due to: - spinal stenosis with pseudoclaudication - abdominal or spine tumors - spinal infection - osteoporosis with vertebral fractures - ankylosing spondylitis - spondylolisthesis w/ radiculopathy - structural kyphosis or scoliosis - radicular pain with weakness or loss of reflexes - failed back syndrome |
| Ability to get up and down from the floor and rise to a standing position without assistance |
other conditions: - pregnancy - pre-surgical spine candidates - actively undergoing cancer treatment - confirmed fibromyalgia - abdominal hernia - compromised cardiopulmonary system - major depression (BDI-II score ≥ 20) - substance abuse issues - widespread neurological disorder - currently involved in litigation or have open workers’ compensation case concerning LBP practiced yoga 1x/week for ≥ 3 months within last year |
| Agree to not get chiropractic treatment, massage therapy, Pilates, or acupuncture or to participate in any other yoga program | |
| If randomized to yoga therapy group, agree to : - attend at least 20 of 24 weeks - attend at least 40 of 48 classes - agree to practice at home for 30 minutes on non-class days | |
If initially eligible, individuals were scheduled for screening. This included the processing of informed consent, completion of a battery of questionnaires and assessments, and a study-physician assessment including a medical history review, medical usage interview, and physical examination. Using a study-developed evaluation protocol, the physician screening evaluation primarily focused on establishing a definite musculoskeletal condition as the basis for LBP.
Eligible participants were given envelopes with randomly generated group assignment and enrolled in one of four cohorts of 20–28 participants each. Participants signed study informed consent and Protected Health Information (PHI) release forms. Study staff conducted baseline assessments and gave participants 14 consecutively-numbered VAS scales to complete daily and return via stamped, self-addressed envelopes. Participants were asked to return at 12 (midway), 24 (immediately after) and 48 weeks (6 month follow-up) after the start of the intervention to complete similar assessment instruments with a research assistant blinded to the participant’s group assignment.
Yoga group
The yoga group participated in 24 weeks of yoga consisting of twice weekly, 90-minute classes in a fully equipped yoga studio led by a Certified Iyengar yoga instructor and two assistants with experience delivering yoga therapy to persons with CLBP. Four cohorts of 9 to 16 subjects began every three to six months. The yoga therapy was developed in collaboration with two senior Iyengar teachers and approved by B.K.S. Iyengar (Table 6 and 7). Participants were also directed to practice 30 minutes of yoga at home on non-class days and were supplied with props, a DVD, and an Iyengar yoga instruction manual with photographs and instructions. Compliance was measured by taking attendance at class and by subjects’ weekly reports on duration and frequency of their home practice.
Table 6.
List of Yoga Intervention Postures
| Savasana II supine | Tadasana |
| - with lower legs on chair seat | - brick |
| - Knees supported by bolster | - no brick |
| - blanket channel under trunk, legs straight | Urdhva Hastasana -feet hip wide apart then feet |
| Savasana prone | together |
| Supta Padangusthasana II prone | Utthita Padmasaana -with support of upper wall |
| Supta Tadasana | rope & chair for raised leg |
| Supta Urdhva Hastasana | Utthita Hasta Pandasana* |
| Supta Padaugusthasana I & II | Parsva Hasta Padasana * |
| - bent knee | Utthita Parsvakonasana * |
| - straight leg | Utthita Trikonasana * |
| Supta Pavanmuktasana | Vurabdrasaba II * |
| Urdhva Prasarita Padasana at the wall | Ardha Chandrasana * |
| - weight on feet | Prasarita Padottanasana |
| - no weight on feet | - over bolster on two chairs |
| Pavanmuktasana -over bolster on 2 chairs | - hands on blocks |
| Parsva Pavanmuktasana -over bolster while | Parsvottanasana -lower wall rope traction hips, |
| on seated on chair | hands on chair back |
| Utthita Hasta Padangusthasana I & II | Parivrtta Trikonasana * |
| - bent knee | Bharadvajasana -seated on chair |
| - straight leg | Utthita Maricyasana |
| Ardha Uttanasana | Dandasana |
| - over support with double traction | - seated on chair, hold upper wall ropes |
| - hands to wall | - seated on bolster, strap around the feet |
| Uttanasana | Maricyasana III |
| - hands to blocks, concave | - seated on bolster |
| - head down, hold elbows | - arm doesn’t cross over the bent leg |
| Adho Mukha Svanasana | - arm crosses over bent leg |
| - upper rope | Adho Mukha Virasana - with bolster under |
| - lower rope | abdomen |
| - hands to wall |
with support of upper wall rope
Control group
Participants in the control group continued self-directed standard medical care. No attempt was made to regulate treatment received, but information about the individual’s medical care and pain medication use was collected during monthly phone calls. Control participants adherent to study requirements were “wait-listed” and offered the yoga classes six months after the conclusion of the study.
Outcome Measures
The primary outcomes of the study were functional disability measured by the Oswestry Disability Index (ODI),16 present pain intensity measured using a Visual Analogue Scale (VAS),17 depression measured using the Beck Depression Inventory-Second Edition (BDI-II),18 and self-reported medication usage.
For the assessment of pain medication usage, monthly call reports of controls were reviewed and all subjects were interviewed at baseline, 12 and 24 weeks by a research assistant blinded to group assignment. Questions were asked to determine the use of prescription and non-prescription medications for back pain and also for other medical conditions so the research team could check for potential influences on pain expression. Changes in a subject’s pain medication usage were coded by a co-investigator blinded to group assignment as: (1) failure, i.e., no change or increase in dosage, frequency, and/or amount or (2) success, i.e., decrease in dose, frequency, and/or amount or cessation of medication. If a subject changed to a drug regimen that was equivalent to the pre-intervention drug regimen with respect to medication class and/or dosing period, and which was expected to yield a similar analgesic response, the drug usage was considered unchanged. Changing the dose or stopping of one or more components of a multiple-drug regimen was considered an alteration in drug usage. For example, if two analgesics were being used, and one was stopped, it was recorded as a reduction in usage.
Determination of Sample size
Accounting for an overall attrition rate of 30% and using a Bonferonni corrected alpha level of 0.0125, an initial sample size of 90 was determined from the ODI using a pre-post mean difference of six points and a standard deviation of 5.3, averaged from the standard deviation of the pre to post changes in the control and yoga groups in our previous study of persons with nonspecific CLBP.15 This resulted in a power of 89%, with 45 subjects assigned to each group.
Statistical methods
Treatment effectiveness with regard to the study’s three continuous dependent variables (i.e., ODI, VAS, BDI-II) was assessed using 2 × 3 (treatment group × time) repeated measures analysis of variance (ANOVA) tests. Follow-up linear contrasts were used to make specific comparisons between groups at 12 and 24 weeks. Self-reported pain medication use was evaluated as a binary variable (success/failure). Chi-square analyses were used to determine whether there was a relationship between treatment group and change in pain medication use at 12 and 24 weeks. Significant differences for the four primary outcomes were reported at a Bonferroni corrected alpha level of 0.0125. Data are presented as mean ± standard error of the mean (SEM).
For intention-to-treat analyses, missing baseline data were replaced by group means while missing data at 12 and 24 weeks were replaced using the last observation carried forward. For per-protocol analyses, data for subjects completing the 24 weeks of yoga were weighted as needed to adjust for missing items. For example, the total value of a 20-item instrument with one missing item would be multiplied by 1.053 (20/19) to adjust for missing data.
Secondary analyses
The proportion of participants who experienced clinically significant changes in the ODI (six points)19 and VAS (18.5 mm)20 in each group was compared using chi-square analyses. A 6 month follow-up analysis was conducted using 2 × 4 (treatment group × time) repeated measures ANOVA. Follow-up linear contrasts were used to make specific comparisons between groups at 12, 24 and 48 weeks. Significant differences for the four primary outcomes were reported at an alpha level of .05. The association of age with changes in four primary outcomes was determined by a linearcorrelation analysis. An association was determined to be statistically significant if the p value <0.05.
Results
Recruitment yielded approximately 800 telephone calls from interested individuals. Of these, 660 completed the telephone screening and 90 (13.6%) were enrolled (Figure 1). Of the 90 participants, 43 were randomized to the yoga group (three of whom subsequently declined participation and were replaced) and 47 to the control group. This left a sample of 90 subjects for the intention-to-treat analysis.
Participant ages ranged from 23 to 66 years; the majority were college-educated females with family incomes ≥$50,000 per year (Table 2). More African-Americans were enrolled in the yoga versus control groups, while the number of months since experiencing the first episode of LBP was greater in the control versus yoga groups. No other statistically significant differences were found. The most common primary diagnoses of participants were sacroiliac sprain, lumbar degenerative disc disease, and lumbar or lumbosacral sprain (Table 3).
Table 2.
Baseline Sociodemographics and LBP Measures
| Measures | All (N=90) |
Yoga (n=43) |
Control (n=47) |
P | ||
|---|---|---|---|---|---|---|
| Age, years (M±SEM) | 48.0±1.17 | 48.4±1.86 | 47.6±1.47 | .750 | ||
| BMI, kg/m2 (M±SEM) | 26.7±0.42 | 25.8±0.57 | 27.4±0.60 | .050* | ||
| Gender (%) | ||||||
| Female | 76.7 | 74.4 | 78.7 | .748 | ||
| Male | 23.3 | 25.6 | 21.3 | |||
| Ethnicity (%) | ||||||
| African-American | 2.2 | 4.7 | 0 | .030* | ||
| Asian-American | 4.4 | 9.3 | 0 | |||
| Caucasian | 93.3 | 86.1 | 100 | |||
| Education (%) | ||||||
| Some college or less | 27.0 | 26.2 | 27.7 | .876 | ||
| College graduate | 73.0 | 73.8 | 72.3 | |||
| Annual household income (%) | ||||||
| <$35,000 | 18.1 | 18.6 | 17.8 | .529 | ||
| $35–<50,000 | 22.7 | 27.9 | 17.8 | |||
| $50–<100,000 | 39.8 | 32.6 | 46.7 | |||
| ≥$100,000 | 19.3 | 20.9 | 17.8 | |||
| Taking meds for LBP (%) | 92.2 | 90.7 | 93.6 | .606 | ||
| Prior CAM usage (% yes) | 63.3 | 55.8 | 70.2 | .157 | ||
| LBP Diagnosis (% sacroiliac-related) | 43.3 | 39.5 | 46.8 | .487 | ||
| History of LBP | M±SEM | M±SEM | M±SEM | |||
| Months of current LBP | 63.1±12.97 | 46.6±11.94 | 78.4±22.37 | .214 | ||
| Months since first LBP | 181.4±15.27 | 146.1±20.22 | 212.8±21.77 | .027* | ||
| Outcome Measures | ||||||
| ODI (0–100) | 24.1±0.97 | 25.2±1.08 | 23.1±1.58 | .260 | ||
| VAS (0–100 mm) | 41.5±1.81 | 41.9±2.44 | 41.2±2.67 | .856 | ||
| BDI-II (0–63) | 8.7±0.64 | 9.2±0.92 | 8.3±0.89 | .452 | ||
| Treatment Expectancy – yoga (0–10) | ||||||
| Pre-randomization | 8.0±0.15 | 7.8±0.23 | 8.1±0.21 | .391 | ||
| Post-randomization | 7.4±0.16 | 7.4±0.21 | 7.5±0.23 | .590 | ||
| Pre-post randomization change | −0.5±0.16 | −0.5±0.17 | −0.6±0.26 | .757 | ||
| Treatment Expectancy – SMC (0–10) | ||||||
| Pre-randomization | 4.7±0.19 | 4.8±0.32 | 4.7±0.24 | .786 | ||
| Post-randomization | 4.4±0.21 | 4.3±0.32 | 4.5±0.28 | .660 | ||
| Pre-post randomization change | −0.4±0.22 | −0.5±0.28 | −0.2±0.34 | .497 |
statistically significant at p < 0.05.
BMI, body mass index
M±SEM, mean ± standard error of the mean
LBP, low back pain; ODI, Oswestry Disability Index
VAS, visual analogue scale
BDI-II, Beck Depression Inventory – Second Edition
SMC, standard medical care
Table 3.
Baseline Characteristics of Completers and Dropouts
| Completers (n=74) |
Dropouts (n=16) |
P | |
|---|---|---|---|
| Age, years (M±SEM) | 48.2±1.27 | 46.9±3.02 | .680 |
| BMI, kg/m2(M±SEM) | 26.8±0.47 | 25.8±0.96 | .333 |
| Gender (%) | |||
| Female | 74.3 | 87.5 | .259 |
| Male | 25.7 | 12.5 | |
| Ethnicity (%) | |||
| African-American | 2.7 | 0 | .499 |
| Asian-American | 5.4 | 0 | |
| Caucasian | 91.9 | 100 | |
| Education (%) | |||
| Some college or less | 24.7 | 37.5 | .295 |
| College graduate | 75.3 | 62.5 | |
| Annual household income (%) | |||
| <$35,000 | 17.8 | 20.0 | .430 |
| $35–50,000 | 24.7 | 13.3 | |
| $50–100,000 | 41.1 | 33.3 | |
| >$100,000 | 16.4 | 33.3 | |
| Taking meds for LBP (%) | 90.5 | 100 | .200 |
| Prior CAM usage (% yes) | 64.9 | 56.3 | .517 |
| LBP Diagnosis (% sacroiliac-related) | 40.5 | 56.3 | .250 |
| History of LBP | M±SEM | M±SEM | |
| Months of current LBP | 69.6±15.10 | 34.3±21.32 | .186 |
| Months since first LBP | 189.2±16.75 | 142.9±36.85 | .266 |
| Outcome Measures | |||
| ODI (0–100) | 23.6±1.03 | 26.6±2.71 | .307 |
| VAS (0–100 mm) | 41.0±2.00 | 44.1±4.30 | .521 |
| BDI-II (0–63) | 8.8±0.69 | 8.6±1.73 | .910 |
| Treatment Expectancy – yoga (0–10) | |||
| Pre-randomization | 7.9±0.17 | 8.2±0.35 | .397 |
| Post-randomization | 7.4±0.17 | 7.6±0.39 | .675 |
| Pre-post randomization change | −0.5±0.19 | −0.6±0.25 | .622 |
| Treatment Expectancy – SMC (0–10) | |||
| Pre-randomization | 4.9±0.21 | 3.9±0.46 | .065 |
| Post-randomization | 4.6±0.22 | 3.1±0.55 | .016* |
| Pre-post randomization change | −0.3±0.25 | −0.8±0.48 | .298 |
statistically significant at p < 0.05.
BMI, body mass index
M±SEM, mean ± standard error of the mean
LBP, low back pain; ODI, Oswestry Disability Index
VAS, visual analogue scale
BDI-II, Beck Depression Inventory – Second Edition
SMC, standard medical care
Sixteen participants (12 from the yoga group) did not complete the 24 week protocol. Study completers and dropouts were similar with regard to sociodemographic and LBP parameters (Table 3); however, dropouts had lower post-randomization expectation for SMC treatment (p=0.016) than completers (Table 3). On average, yoga completers (n=31) attended 42.5 ± 0.4 of 48 classes (88.5%) and completed home practice on 104.5 ± 3.8 of 120 days (87.1%) for 33.6 ± 2.5 minutes per day. One adverse event was reported during the 6 month follow-up period in association with physical therapy, not the yoga intervention. No adverse events were reported during the study.
Categories of pain medication that subjects reported using at baseline or later and percentage of participants using them were nonsteroidal anti-inflammatory agents and acetaminophen (90%), muscle relaxants (21%), and opioids or tramadol (13.3%). No statistically significant between-group differences were noted (Table 4). Those agents reported less frequently and usually in combination with other medications included steroids by epidural injection, glucosamine/ chondroitin, lidocaine patch, counter-irritants (e.g., analgesic heat rubs) and heat packs, antidepressants, magnesium sulfate, and herbal remedies marketed for LBP. Approximately 8% of the subjects reported no drug use at baseline.
Table 4.
Pain medication taken for LBP
| All (N=90) |
Yoga (n=43) |
Control (n=47) |
P | ||
|---|---|---|---|---|---|
| Taking meds for LBP (%) | 92.2 | 90.7 | 93.6 | .606 | |
| NSAID/Acetaminophen only | 63.3 | 67.4 | 59.6 | ||
| Muscle relaxant(s) only | 1.1 | 0 | 2.1 | ||
| Opioids/Tramadol only | 1.1 | 2.3 | 0 | ||
| NA + MR | 14.4 | 7.0 | 21.3 | ||
| NA + OT | 6.7 | 4.7 | 8.5 | ||
| NA + MR + OT | 5.6 | 7.0 | 4.3 | ||
| Taking two or more drug types | 28.9 | 21.1 | 35.6 | .147 | |
| Taken alone or in combination: | % (n) | % (n) | % (n) | ||
| NSAID/Acetaminophen | 90.0 (81) | 86.0 (37) | 93.6 (44) | .232 | |
| Muscle relaxant(s) | 21.1 (19) | 14.0 (6) | 27.7 (13) | .112 | |
| Opioids/Tramadol | 13.3 (12) | 14.0 (6) | 12.8 (6) | .869 |
NOTES: LBP, low back pain
NA, NSAID/Acetaminophen
MR, Muscle relaxant
OT, Opioids/Tramadol
A. Intervention effectiveness: intention-to-treat analyses
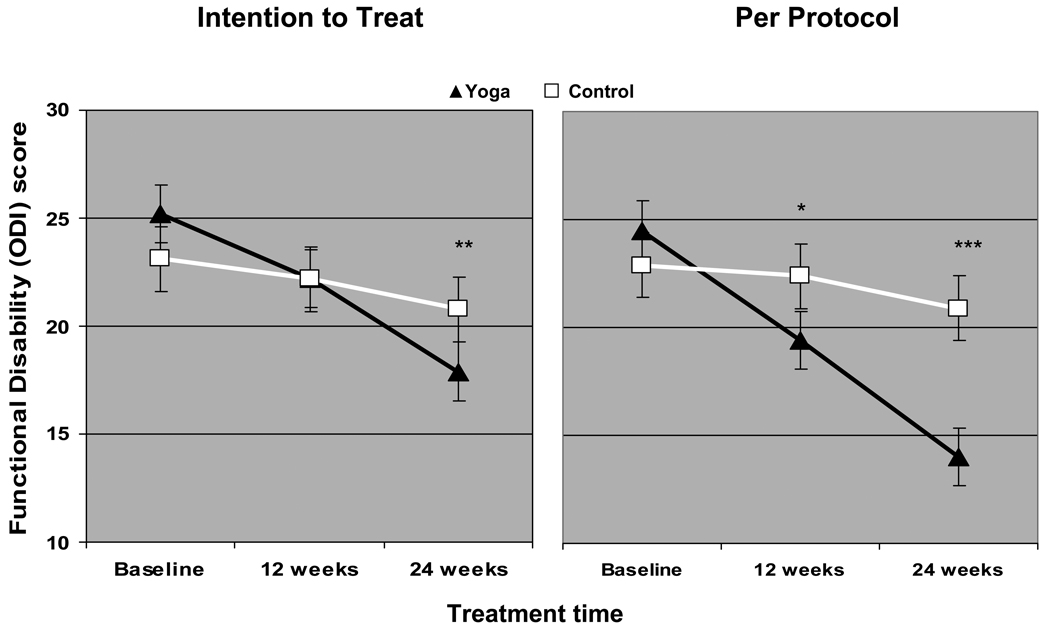
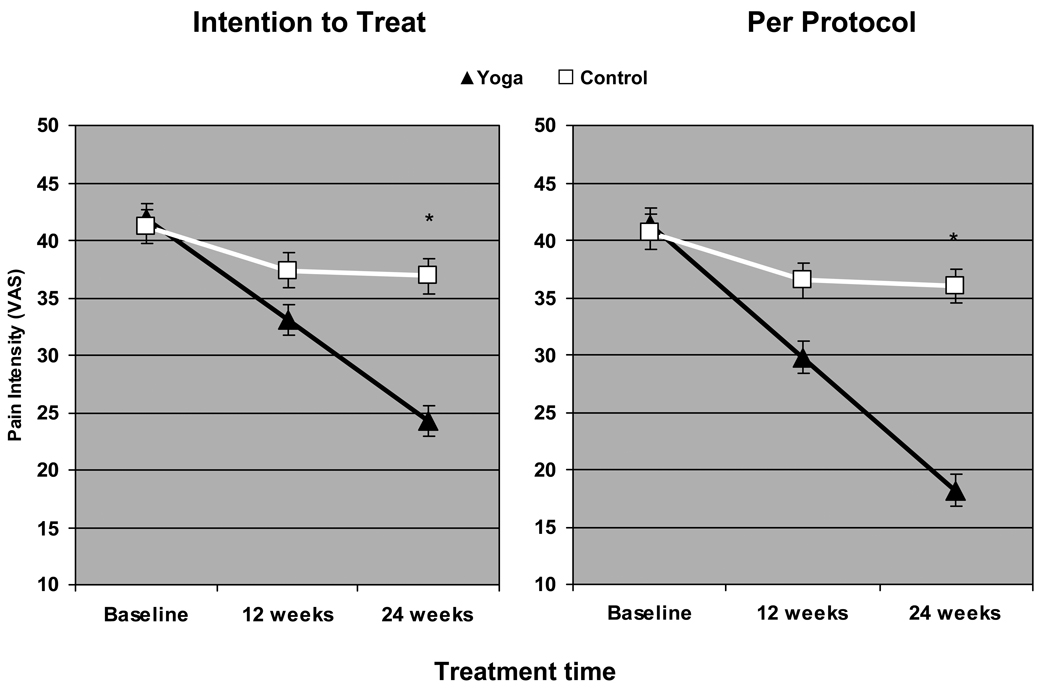
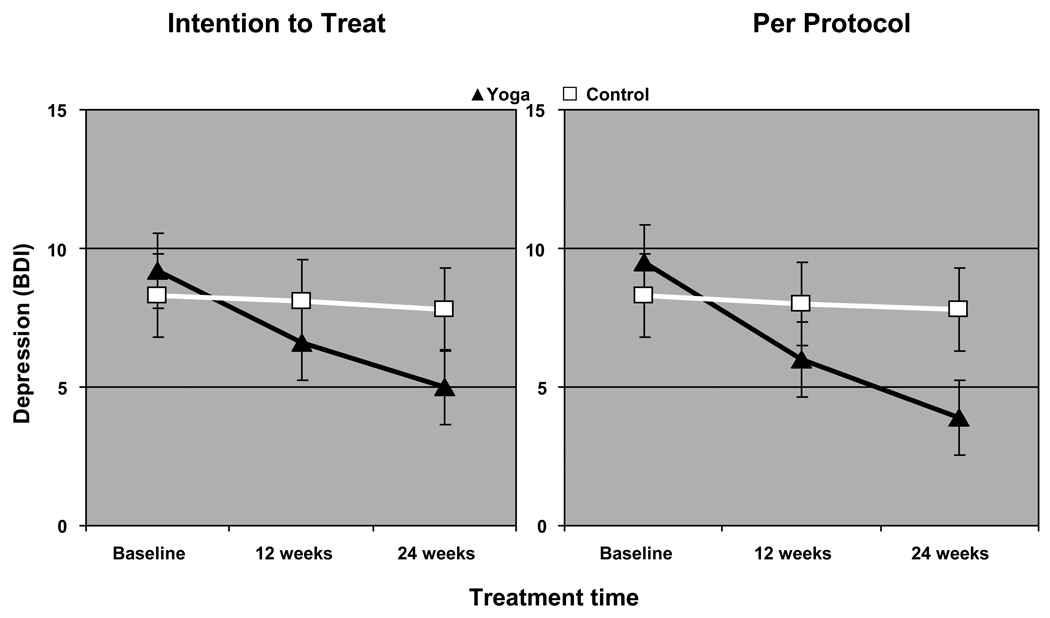
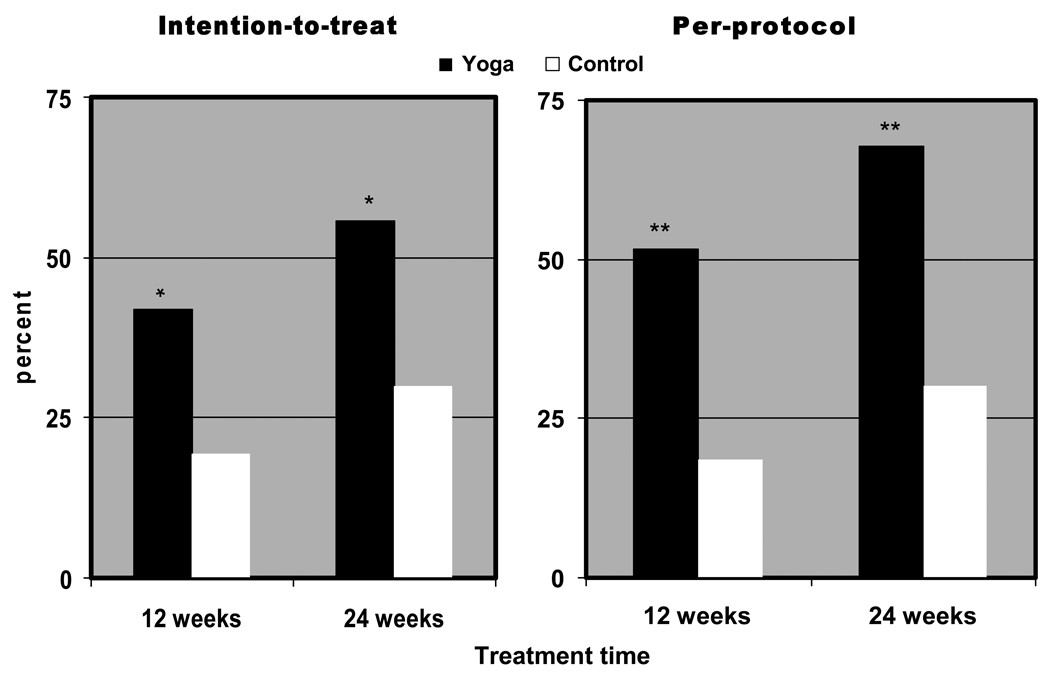
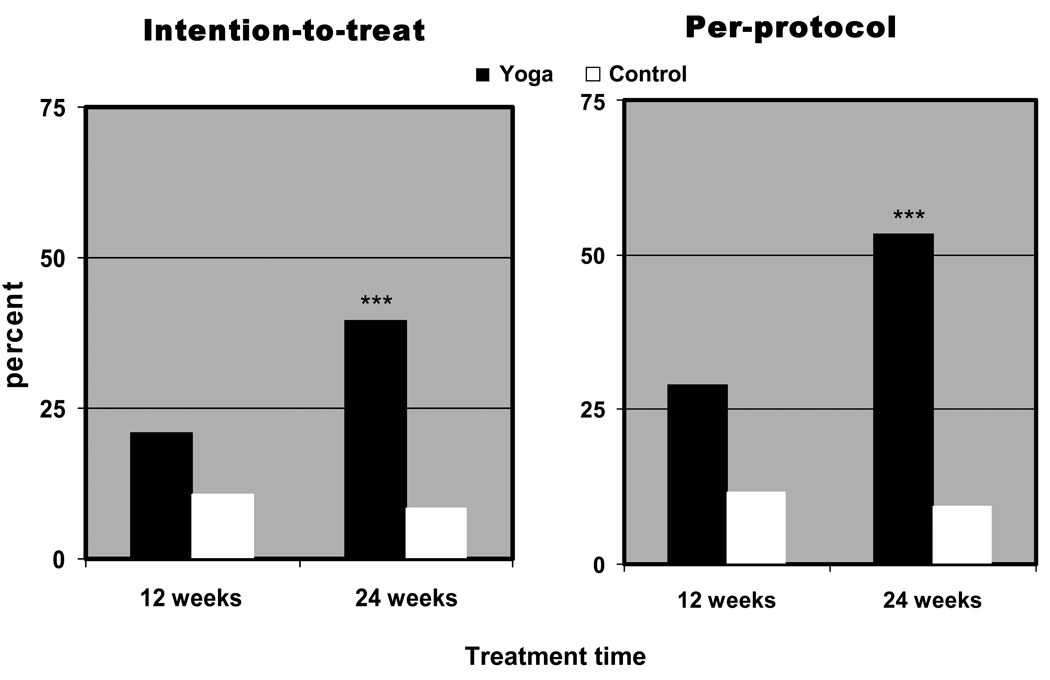
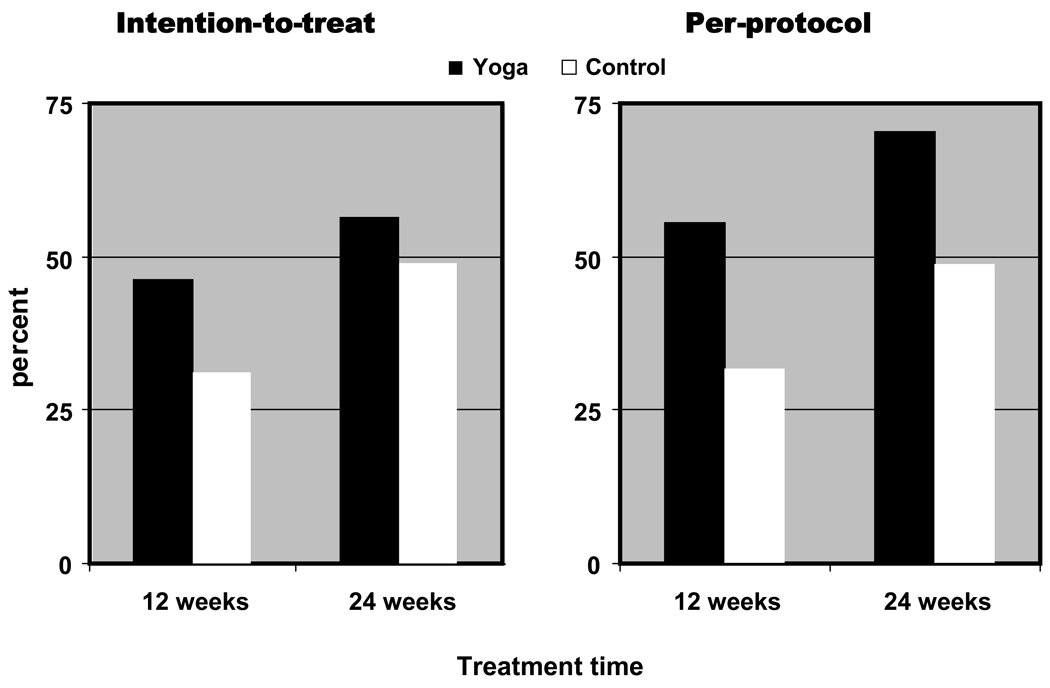
Repeated measures ANOVA revealed an interaction that approached significance on the ODI (p=0.016) and statistically significant treatment group × time interaction for the VAS and BDI-II (p<0.001). Follow-up linear contrasts revealed that the yoga group experienced significantly greater reductions in the ODI (29%, Figure 2) and VAS (42%, Figure 3) at 24 weeks, and in BDI-II scores (Figure 4) at both 12 (28.3%) and 24 (46.7%) weeks. When compared to controls, chi-square analyses revealed that a greater proportion of yoga participants experienced clinically important improvements on the ODI at 12 weeks and on both the ODI and the VAS at 24 weeks (Figure 5 & Figure 6). Chi-square analyses revealed a nonsignificant reduction in pain medication at 12 and 24 weeks that was comparable in both groups (Figure 7). However, there was a trend for the yoga group to have a higher success rate in decreasing pain medication than the control group at both time points.
Figure 2. Changes in functional disability among yoga and control group participants.
The mean functional disability score (% total on ODI) and standard error of the mean is depicted. The Oswestry Disability Index (ODI) is scored from 0–10 with higher scores indicating greater functional disability. The score is expressed as a percentage of the total possible score. Statistically significant p values from follow-up linear contrasts at 12 and 24 weeks to the repeated measures ANOVA test are indicated as follows: * p<.0125, ** p <.01, *** p < .001.
Figure 3. Changes in pain intensity among yoga and control group participants.
The mean pain intensity score (mm on VAS) and standard error of the mean is depicted. The Visual Analog Scale (VAS) is scored from 0–100 with higher scores indicating more severe pain. Statistically significant p values (p < .001) from follow-up linear contrasts at 12 and 24 weeks to the repeated measures ANOVA are indicated by the asterisk (*).
Figure 4. Changes in depression among yoga and control group participants.
The mean depression score (BDI-II) and standard error of the mean is depicted. The Beck Depression Inventory (BDI-II) is scored from 0–63 with higher scores indicating greater depression. Statistically significant p values from follow-up linear contrasts at 12 and 24 weeks to the repeated measures ANOVA test are indicated as follows: * p <.01, ** p < .001.
Figure 5. Clinically relevant changes in functional disability among yoga and control group participants.
Mean percent of the total participants who reported a clinically important improvement (6 point change) in functional disability is depicted. Fritz and Irrgang {Fritz, 2001} used an external criterion of patient’s perception of global rating of change to determine that a 6-point difference between groups on the ODI was a minimum clinically important difference. Statistically significant p values from follow-up linear contrasts at 12 and 24 weeks to the repeated measures ANOVA test are indicated as follows: * p<.05, ** p <.01, *** p <.001.
Figure 6. Clinically relevant changes in pain intensity among yoga and control group participants.
Mean percent of the total participants who reported a clinically important improvement (18.5 mm change) in pain intensity is depicted. Hägg et al. {Hägg, 2003} using the external criterion of patient global assessment of treatment effect, determined that 18–19 units on a 100 millimeter VAS was a minimally clinically important difference. Statistically significant p values from follow-up linear contrasts at 12 and 24 weeks to the repeated measures ANOVA test are indicated as follows: * p<.05, ** p <.01, *** p <.001.
Figure 7. Successful change in pain medication usage among yoga and control group participants.
Mean successful changes from baseline in low back pain (LBP) medication usage are depicted. Only those who reported taking medications at baseline for LBP are included. Changes in a subject’s pain medication usage were coded as: (1) failure, i.e., no change or increase in dosage, frequency, and/or amount or (2) success, i.e., decrease in dose, frequency, and/or amount or cessation of medication. Decreasing the dose or stopping of one or more components of a multiple-drug regimen was considered a successful alteration in drug usage. While not statistically significant, a trend toward higher success rates in decreasing pain medication was apparent for the yoga as opposed to the control group at both time points.
B. Intervention efficacy: Per-protocol
Repeated measures ANOVA of completers revealed a significant full-model interaction along with follow-up contrasts for the ODI at both 12 and 24 weeks (Figure 2). Statistically significant treatment group × time interactions were also observed for the VAS (Figure 3) and BDI-II (Figure 4). At 24 weeks, the yoga group showed a 42.9% reduction in ODI, a 56.0% reduction in VAS, and a 58.9% reduction in BDI-II. The proportion of yoga subjects with clinically important improvements increased by 10–12% in the ODI (Figure 5) and 8–14% in the VAS (Figure 6) from the intention-to-treat analysis. Chi-square analyses revealed no significant differences but a strong trend for the yoga group to have a higher success rate than the control group in decreasing pain medication at both time points (Figure 7). Subgroup analysis of subjects that had no outside LBP treatment during the study period showed a trend for yoga participants to have greater reductions in pain medication usage at 12 (p=0.09) but not 24 weeks. Pain medication usage was also analyzed in subgroups of yoga and control subjects who had moderate disability at baseline (ODI ≥20). In this analysis, yoga subjects showed a significantly greater reduction in pain medication at 12 weeks (63.2% vs. 28 %, p = 0.020) with the trend still apparent at 24 weeks (68.4% vs. 45.8 %, p = 0.139)
C. Six Month Follow-up
Six months after completion of the yoga intervention, 67.9% of participants in the yoga group reported practicing yoga. On average, they practiced 3.3 ± 0.5 days per week for 32.6 ± 4.5 minutes per session. In both intention-to treat and per protocol analysis, repeated measures ANOVA demonstrated statistically significant treatment group × time interactions for ODI, VAS and BDI with the yoga group exhibiting greater reductions than the SMC group (Table 5). Follow-up linear contrasts indicated that the yoga group had significantly greater reductions in ODI and VAS at 24 and 48 weeks while BDI was lower at 12, 24 and 48 weeks (Table 5). Although the reductions in the yoga group were slightly lower at 48 weeks compared to 24 weeks , there were no statistically significant differences between the scores reported at the two time points in ODI, VAS, BDI and pain medication usage (p >0.05). As in the previous assessments, chi squared analysis indicated that there was no statistically significant differences between groups in pain medication usage (p >0.05).
Table 5.
Six-Month Follow-up Analysis on the Effect of Iyengar Yoga on Functional Disability, Pain Intensity and Depression
| Yoga (n=43) | Control (n=47) | |||||
|---|---|---|---|---|---|---|
| Time | M±SEM | Change, M±SEM |
M±SEM | Change, M±SEM |
P | P * |
| Intention to Treat | N=43 | N=47 | ||||
| ODI | ||||||
| Baseline | 25.2±1.08 | - | 23.1±1.58 | |||
| 12-weeks | 21.7±1.59 | −3.5±1.49 | 22.2±1.59 | −0.8±0.89 | .001** | .176 |
| 24-weeks | 16.9±1.57 | −8.3±1.82 | 20.8±1.50 | −2.3±1.09 | .003** | |
| 6-month | 18.2±1.93 | −7.0±2.17 | 23.5±1.80 | 0.4±1.44 | .0003*** | |
| post | ||||||
| VAS | ||||||
| Baseline | 41.9±2.44 | - | 41.2±2.67 | |||
| 12-weeks | 32.5±2.87 | −9.3±2.45 | 37.4±2.78 | −3.9±2.30 | <.0001*** | .107 |
| 24-weeks | 22.9±2.66 | −18.9±2.52 | 36.9±2.89 | −4.4±2.08 | <.0001*** | |
| 6-month | 26.1±3.34 | −15.7±3.25 | 38.5±2.67 | −2.7±2.25 | .0001*** | |
| post | ||||||
| BDI-II | ||||||
| Baseline | 9.2±0.92 | 8.3±0.89 | ||||
| 12-weeks | 6.5±0.81 | −2.7±0.65 | 8.1±0.96 | −0.2±0.63 | .0001*** | .012* |
| 24-weeks | 4.4±0.65 | −4.8±0.86 | 7.8±0.94 | −0.5±0.60 | <.0001*** | |
| 6-month | 4.9±0.66 | −4.4±0.92 | 7.5±0.85 | −0.8±0.86 | .0005*** | |
| post | ||||||
| Per Protocol | N=29 | N=36 | ||||
| ODI | ||||||
| Baseline | 24.1±1.22 | 23.4±1.78 | ||||
| 12-weeks | 19.2±1.63 | −4.9±1.41 | 22.6±1.99 | −0.8±1.02 | .001* | .051 |
| 24-weeks | 14.4±1.12 | −9.6±1.57 | 21.5±1.83 | −1.9±1.30 | .0003*** | |
| 6-month | 15.8±2.00 | −8.3±2.28 | 22.0±1.83 | −1.4±1.22 | .001** | |
| post | ||||||
| VAS | ||||||
| Baseline | 40.6±2.75 | 43.1±3.17 | ||||
| 12-weeks | 29.9±3.25 | −10.7±3.17 | 38.4±3.31 | −4.7±2.95 | .0008*** | .169 |
| 24-weeks | 17.5±2.25 | −23.1±3.17 | 36.1±3.40 | −7.0±2.34 | .0002*** | |
| 6-month | 22.2±3.96 | −18.4±4.54 | 38.3±3.09 | −4.8±2.64 | .002** | |
| post | ||||||
| BDI-II | ||||||
| Baseline | 9.1±1.05 | 8.8±1.03 | ||||
| 12-weeks | 5.8±0.88 | −3.3±0.88 | 8.4±1.15 | −0.4±0.77 | .003* | .020* |
| 24-weeks | 4.0±0.8 | −5.1±0.86 | 8.4±1.12 | −0.7±0.77 | .0003*** | |
| 6-month | 4.6±0.84 | −4.5±0.99 | 7.8±1.00 | −1.1±1.1 | .007** | |
| post | ||||||
P ANOVA follow-up linear contrast: Change scores are changes since baseline, negative values indicate improvements
p<.05
p<.01
p<.001
D. Effect of Age on Primary Outcomes
There was no association between age and changes in functional disability, pain intensity, depression or pain medication (p >0.05 for all outcomes and time periods).
Discussion
The majority of participants (82%) completed the 24-week therapeutic Iyengar yoga intervention, and, as hypothesized, the intervention was effective and efficacious in treating CLBP when compared with SMC. Individuals randomized to the yoga group showed significantly greater improvements in functional disability, pain intensity, and depression. Using Cohen’s d ,21 the magnitude of the intervention effect tended to be small to moderate at 12 weeks and moderate to large at 24 weeks. The yoga therapy was regarded as safe for this population with no adverse events due to yoga reported, and the majority of dropouts were due to factors unrelated to the yoga therapy.
According to the criteria set by Fritz and Irrgang19 and Hagg,20 a larger proportion of our yoga subjects reported clinically significant improvements in functional disability and present pain intensity than controls. This was the case despite the fact that the controls also reported improvements in all outcomes, perhaps due, in part, to the prompting of the monthly follow-up calls by research staff.
The relative changes we reported in functional disability from intention-to-treat analyses (11.9% and 29.0% improvements at 12- and 24 weeks, respectively) compared favorably with a six week Hatha yoga intervention using similar instruments and analyses (15.3% improvement).10 In addition, our results are similar to those randomized to exercise-only intervention arms in six week (13.5% improvement)22 and eight week (23.1% improvement)23 randomized controlled trials.
Our per-protocol functional disability results of study completers (20.8% and 42.9% improvements at 12 and 24 weeks, respectively) show even more promise in comparison with other studies using similar analyses and instruments. For example, a six-week Pilates intervention showed only a 8.1% improvement,24 whereas those in a 10-week exercise intervention showed a 48.3% improvement in functional disability.25 Our results also compare favorably with a 10-week lumbar stabilization intervention (28.4% improvement).26 To the best of our knowledge, this is the only yoga study that has reported significant changes in functional disability using the ODI.
Potential limitations to our study and perhaps dilutions to the intention-to-treat analyses findings in particular, may be inherent to our heavy reliance on self-report instrumentation, the fact that one-third of our subjects had minimal disability (i.e., ODI between 10 and 20), and/or the differential demand on our two groups with regard to attention and group support.
A number of the above limitations may be reflected in the pain medication analyses. For example, the inability to discriminate a significant difference in pain medication usage between groups in the intention-to-treat analysis may have been due to the small sample size (N=90), the unanticipated positive changes occurring in the control group (48.9% improvement), and/or the artificial increase in the number of failures in the treatment group. In the yoga group, there were 44% failures in pain medication usage, 12 of which were listed because subjects were dropouts rather than true “failures.” Therefore, while the intention-to-treat model evaluates the effectiveness of yoga as an intervention, it may negatively impact discriminating the efficacy of the intervention on drug utilization. On the other hand, even with the difficulty discriminating a significant difference in drug use, there was a strong trend for a greater reduction with yoga which appears to be clinically significant. These results were in agreement with our earlier study using a per-protocol analysis with a population with less disability in which the yoga group decreased pain medication usage to a significantly greater amount than controls.15
Differences between this Iyengar yoga intervention and other yoga studies10 11 27 include adding resting poses at the beginning of the class, the use of the full range of props for external support and traction, and the exclusion of back bending poses. Despite the fact that significant improvements at 12 weeks were found in participants adherent to the study, we believe that a 24-week period of yoga practice for CLBP is superior since this time period can better prepare participants to sustain the benefits by improving posture, helping to retain the musculoskeletal system, and building the skills needed to decrease the rate of relapse. This hypothesis is supported by the larger reductions in functional disability, pain intensity and depression in the yoga group compared to SMC 6-months post-intervention.
Future studies should include an attention control group in order to avoid the consequences of a differential demand placed on subjects, strictly follow an ODI minimum of 20 for inclusion to limit the floor effect, evaluate objective medical outcomes to reduce potential self-report error, and provide detailed characteristics of responders and non-responders to the yoga intervention.
In conclusion, our results suggest that yoga improves functional disability, pain intensity, and depression in adults with CLBP. There was also a clinically important trend for the yoga group to reduce their pain medication usage compared to the control group.
Key Points.
Yoga decreases functional disability, pain intensity, and depression.
Trend toward lower pain medication after yoga.
Clinically important improvements were observed in functional disability and pain intensity after yoga.
Yoga-related reductions in functional disability, pain intensity and depression were maintained at the 6 month follow-up.
Acknowledgments
The authors gratefully acknowledge the assistance of Siegfried Bleher, Ph.D., Certified Iyengar Yoga Teacher, Lillian Waugh, Martha Brand, Jean Riley, and Sharon Smith for delivery of the intervention; Wen Zheng, Chang Chang Xiao, Jeanne Goodman, Nathan Hixson and Auvid Momen for research and administrative assistance; and Chris Saudek, Senior Iyengar Teacher, for assistance with teacher instruction and special needs of yoga participants.
Footnotes
Funding for this research was provided by the National Institutes of Health’s National Center for Complementary & Alternative Medicine (NIH-NCCAM), Grant No.1 R21 AT001679-01A2. IRB approval was obtained from the West Virginia University Institutional Review Board.
Reference List
- 1.Andersson GBJ. Epidemiological features of chronic low-back pain. The Lancet. 1999;354(9178):581–585. doi: 10.1016/S0140-6736(99)01312-4. [DOI] [PubMed] [Google Scholar]
- 2.Andersson GBJ, Frymoyer JW. The epidemiology of spinal disorders. In: Frymoyer JW, editor. The adult spine: Principles and practice. 2nd ed. Philadelphia, PA: Lippincott-Raven; 1997. pp. 93–141. [Google Scholar]
- 3.Shelerud R. Epidemiology of occupational low back pain. Occup Med. 1998;13(1):1–22. [PubMed] [Google Scholar]
- 4.Frymoyer JW, Durett CL. The economics of spinal disorders. In: Frymoyer JW, editor. The adult spine: Principles and practice. 2nd ed. Philadelphia: Lippincott-Raven; 1997. pp. 143–150. [Google Scholar]
- 5.Eisenberg DM, Davis RB, Ettner SL, et al. Trends in alternative medicine use in the United States, 1990–1997: Results of a follow-up national survey. JAMA. 1998;280:1569–1575. doi: 10.1001/jama.280.18.1569. [DOI] [PubMed] [Google Scholar]
- 6.Barnes PM, Powell-Griner E, McFann K, Nahin RL. Complementary and alternative medicine use among adults: United States, 2002. Adv Data. 2004;343:1–19. [PubMed] [Google Scholar]
- 7.Wolsko PM, Eisenberg DM, Davis RB, Kessler R, Phillips RS. Patterns and Perceptions of Care for Treatment of Back and Neck Pain: Results of a National Survey. Spine. 2003;28(3):292. doi: 10.1097/01.BRS.0000042225.88095.7C. [DOI] [PubMed] [Google Scholar]
- 8.Saper RB, Eisenberg DM, Davis RB, Culpepper L, Phillips RS. Prevalence and Patterns of Hatha Yoga Use in the United States: Results of a National Survey. Altern Ther Health Med. 2004;10(2):20–21. [PubMed] [Google Scholar]
- 9.Vidyasagar JVS, Prasad BN, Reddy MV, Raju PS, Jayshankar M, Sampath K. Effects of yoga practices in non-specific low back pain. Clinical Proceedings of NIMS. 1989;4:160–164. [Google Scholar]
- 10.Galantino ML, Bzdewka TM, Eissler-Russo JL, et al. The impact of modified Hatha yoga on chronic low back pain: A pilot study. Altern Ther Health Med. 2004;10(2):56–59. [PubMed] [Google Scholar]
- 11.Sherman KJ, Cherkin DC, Erro J, Miglioretti DL, Deyo RA. Comparing yoga, exercise, and a self-care book for chronic low back pain: A randomized, controlled trial. Ann Intern Med. 2005;143(12):849. doi: 10.7326/0003-4819-143-12-200512200-00003. [DOI] [PubMed] [Google Scholar]
- 12.Signet Market Research. Yoga survey 2000. Yoga Journal. 2000 [Google Scholar]
- 13.Iyengar BKS. Light on Yoga. New York, NY: Schocken Books; 1976. [Google Scholar]
- 14.Iyengar BKS. Light on Pranayama: The Yogic Art of Breathing. New York, NY: The Crossroad Publishing Co; 1989. [Google Scholar]
- 15.Williams K, Petronis J, Smith D, et al. Effect of Iyengar yoga therapy for chronic low back pain. Pain. 2005;115(1):107–117. doi: 10.1016/j.pain.2005.02.016. [DOI] [PubMed] [Google Scholar]
- 16.Fairbank JC, Couper J, Davies JB, O'Brien JP. The Oswestry low back pain disability questionnaire. Physiotherapy. 1980;66(8):271–273. [PubMed] [Google Scholar]
- 17.Huskisson EC. Visual analogue scales. In: Melzack R, editor. Pain Measurement and Assessment. New York, NY: Raven Press; 1983. pp. 33–37. [Google Scholar]
- 18.Beck AT, Steer RA, Brown GK. BDI-II manual. San Antonio, TX: The Psychological Corporation; 1996. [Google Scholar]
- 19.Fritz JM, Irrgang JJ. A comparison of a modified Oswestry Low Back Pain Disability Questionnaire and the Quebec Back Pain Disability Scale. Phys Ther. 2001;81(2):776. doi: 10.1093/ptj/81.2.776. [DOI] [PubMed] [Google Scholar]
- 20.Hägg O, Fritzell P, Ordwall A. The clinical importance of changes in outcome scores after treatment for chronic low back pain. Eur Spine J. 2003;12(1):12–20. doi: 10.1007/s00586-002-0464-0. [DOI] [PubMed] [Google Scholar]
- 21.Cohen J. Statistical power analysis for the behavioral sciences. 2nd ed. Hillsdale, NJ: Lawrence Earlbaum Assocaites; 1988. [Google Scholar]
- 22.Djavid GE, Mehrdad R, Ghasemi M, Hasan-Zadeh H, Sotoodeh-Manesh A. In chronic low bck pain, low level laser therapy combined with exercise is more beneficial than exercise alone in the long term: a randomized trial. Aust J Physiother. 2007;52:155–160. doi: 10.1016/s0004-9514(07)70022-3. [DOI] [PubMed] [Google Scholar]
- 23.Aure OF, Nilsen JH, Vasseljen O. Manual therapy and exercise therapy in patients with chronic low back pain. Spine. 2003;28:525–532. doi: 10.1097/01.BRS.0000049921.04200.A6. [DOI] [PubMed] [Google Scholar]
- 24.Gadwell V, Head S, Haggar M, Beneke R. Does a programof pilates improve chronic non-specific low back pain? J Sports Rehabil. 2006;15:338–350. [Google Scholar]
- 25.O'Sullivan PB, Phyty DMG, Twomey LT, Allison G. Evaluation of specific stabilizing exercise in the treatment of chronic low pack pain with radiologic diagnosis of spondylolysis or spondylolisthesis. Spine. 2008;22(24):2959–2967. doi: 10.1097/00007632-199712150-00020. [DOI] [PubMed] [Google Scholar]
- 26.Shaughnessy M, Caulfield B. A pilot study to investigate the effect of lumbar stabilisation exercise training on functional ability and quality of life in patients with chronic low back pain. Int J Rebabil Res. 2004;27(4):297–301. doi: 10.1097/00004356-200412000-00007. [DOI] [PubMed] [Google Scholar]
- 27.Jacobs BP, Mehling W, Goldberg H. Feasibility of conducting a clinical trial on Hatha yoga for chronic low back pain: Methodological lessons. Altern Ther Health Med. 2004;10(2):80–83. [PubMed] [Google Scholar]


