Abstract
It has long been recognized that spinal cord injury (SCI) leads to a loss of bone mineral. However, the mechanisms of bone loss after SCI remain poorly understood. The aim of this study was to investigate whether SCI causes a shift in skeletal balance between osteoblastogenesis and adipogenesis. Eighty male Sprague-Dawley rats at 6 weeks of age were randomly divided into two groups: sham-operated (SHAM) group and SCI group. The rats were killed after 3 weeks, 3 months and 6 months, and their femora, tibiae and humeri were collected for mesenchymal stem cells (MSCs) culture, bone mineral density (BMD) measurement, RNA analysis and Western Blot analysis. Osteogenic and adipogenic differentiation potential of MSCs from SCI rats and SHAM rats was evaluated. We found increased marrow adiposity in sublesional tibiae of SCI rats. SCI caused increased peroxisome proliferator-activated receptor-γ (PPARγ) expression and diminished Wnt signalling in sublesional tibiae. Interestingly, in MSCs from SCI rats treated with the PPARγ inhibitor GW9662, the ratios of RANKL to OPG expression were significantly decreased. On the contrary, in MSCs from SCI rats treated with the PPARγ ligand troglitazone, the ratios of RANKL to OPG expression in SCI rats were significantly increased. High expression of PPARγ may lead to increased bone resorption through the RANKL/OPG axis after SCI. In addition, high expression also results in the suppression of osteogenesis and enhancement of adipogenesis in SCI rats. SCI causes a shift in skeletal balance between osteoblastogenesis and adipogenesis, thus leading to bone loss after SCI.
Keywords: spinal cord injury, adipogenesis, osteoblastogenesis
Introduction
It has long been recognized that spinal cord injury (SCI) leads to a loss of bone mineral 1–3. Many authors claim that SCI-induced bone loss is attributable to disuse 4–6. However, this may not necessarily be the case: other factors such as denervation and hormonal changes may also be involved in the pathogenesis of bone loss after SCI 7. It was demonstrated that SCI rats have increased osteoclastogenesis and bone resorption 8. The cellular and molecular mechanisms of bone loss after spinal cord injury need to be further elucidated.
Mesenchymal stem cells (MSCs) can give rise to osteoblasts, adipocytes as well as a variety of other cell types 9–11. During the process of osteogenesis, the canonical wingless (Wnt) pathway is essential for differentiation into osteoblasts 12–14. In the canonical Wnt signalling pathway, secreted Wnt ligands bind to the receptor frizzled (Frz) and the coreceptor lipoprotein-related protein5 and 6 (LRP-5/6) on the target cells. On the other hand, overexpression of peroxisome proliferator-activated receptor-γ (PPARγ), a member of the nuclear receptor transcription factor family 15, induces adipogenesis over osteoblastogenesis in pluripotent cells 16. Interestingly, if PPARγ is expressed in osteoblasts, it can suppress the mature osteoblast phenotype and induce genes associated with an adipocyte-like phenotype, such as fatty acid binding protein 4 (FABP4/aP2), fatty acid synthase (FAS) and LPL 16. Selection of adipogenesis over osteoblastogenesis is thought to contribute to bone loss associated with a variety of conditions including age-related diseases, such as osteoporosis 17–20. The objective of this study was to investigate whether SCI causes a shift in skeletal balance between osteoblastogenesis and adipogenesis, and thus resulting in bone loss after SCI.
Materials and methods
Animals
Animal studies were conducted in accordance with Shanghai Jiaotong University Committee on Animal Use and Care. Eighty male Sprague-Dawley rats at 6 weeks of age were randomly divided into two groups: sham-operated (SHAM) group (n = 40) and SCI group (n = 40). All animals were anaesthetized by intraperitoneal injection of xylazine (10 mg/kg) and ketamine (75 mg/kg). The back was shaved and sterilized, and an incision was made on the back posterior to the lower thoracic region. After the back muscles were infiltrated, the dorsal surface of the spinal cord was exposed by laminectomy at the T10-12 level, and the lower thoracic cord was subsequently transected with fine scissors. Finally, the surgical wound was closed in two layers. All SHAM rats underwent a similar operation to those in the SCI group, except that the lower thoracic cord was exposed but not transected. SCI rats received daily assistance in bladder emptying until spontaneous miction recovered. All rats were fed with commercial rat chow available ad libitum with 0.95% calcium and 0.67% phosphate, and housed in a controlled environment at 22°C with a 12-hr light/dark cycle.
Experimental design
Three weeks after surgery, 20 SCI and 20 SHAM rats were fasted for 6 hrs and then killed. Left tibiae were immediately removed, freed from soft tissue, 10 for bone mineral density (BMD) measurement, and 10 for the measurement of bone marrow adiposity. Right tibiae and humeri of 10 rats per group were collected for real-time PCR analysis, and the others were for used for Western blot analysis. Also, the liver and subcutaneous femoral fat pads were dissected from the surrounding tissues, and then were weighed and fixed in PBS-buffered formalin.
To quantify whole bone mRNA and protein and to harvest marrow for cultures of the MSCs, bones, 10 per group, were prepared as described below. Briefly, after death, right tibiae, humeri and femora were quickly excised and soft tissues were removed. For whole bone mRNA, the epiphyses of right tibiae and humeri were removed with a razor blade, discarded, and the marrow was flushed out with a calcium- and magnesium-free PBS (PBS-CMF) solution. The metaphyses of right tibiae and humeri were then flash-frozen in liquid nitrogen and stored at −70°C before pulverization with a liquid nitrogen-cooled steel mortar and pestle and RNA isolation and protein extraction. To harvest the MSCs, bone marrow of femora was obtained for primary cultures of MSCs. The MSCs were isolated from bone marrow as described below. Three months and 6 months after surgery, 10 SCI and 10 SHAM rats were killed as described above respectively. The right tibiae and humeri were obtained for Western blot analysis.
BMD measurement
The BMD of all bones was determined using DXA (QDR Discovery A; Hologic, Inc., Bedford, MA, USA). The tibiae were scanned using a small-animal regional high-resolution protocol. After entire sections were scanned, a region of interest was drawn and the BMD of this region was computed.
Tissue histology
Subcutaneous femoral fat depots were isolated from surrounding tissue and fixed in 10% neutral-buffered formalin. Fixed samples were processed on an automated tissue processor for dehydration, clearing and infiltration using a routine overnight processing schedule. Samples were then embedded in paraffin, and paraffin blocks were sectioned at 5 μm on a Reichert Jung 2030 rotary microtome. Slides were stained with haematoxylin & eosin.
Livers were dissected out, sectioned and placed in freezing media on a sectioned cork; corks were snap frozen in liquid nitrogen. Frozen tissue-corks were stored at −80°C. Tissues were then sectioned on a −20°C Sakura Tissue Tek Cryostat at 10 μm. Sections were placed on adhesive slides, air dried for 30 min., fixed in 37–40% formaldehyde for 1 min., rinsed in running tap water for 5 min., and stained with haematoxylin & eosin.
Oil red O staining of bone marrow
Bone marrow smears made from the tibiae were stained with 0.5% oil red O in isopropanol (w/v) for 10 min., and lipid droplets were then evaluated using a light microscope digitalized with a charge-coupled device camera and an image analysis system (Imaging & Computers, Toyota, Japan). Percentage of oil red O staining was calculated from six different fields.
Primary culture of MSCs
The MSCs were isolated from bone marrow obtained from femora of SCI rats and SHAM rats. Bone marrow was collected in a syringe containing 10,000 IU heparin to prevent coagulation. The mononuclear cell fraction was isolated using 0.77 g/ml Ficoll density gradient centrifugation. Mononuclear cells were plated into tissue culture flasks in an expansion medium at a density of 105 cells/cm2. The expansion medium consisted of low glucose defined minimal essential medium (LG-DMEM; Invitrogen, New York, NY, USA) and 10% foetal bovine serum (FBS; BioWhittaker, Lonza, Walkersville, MD, USA). Upon reaching 80% confluency, the cells were trypsinized with 0.25% trypsin-1 mM EDTA (Sigma-Aldrich, St. Louis, MO, USA) and replated at a density of 104 cells/cm2.
MSC proliferation
The cells were seeded at 2 × 10³/well in 96-well plates in LG-DMEM supplemented with 10% FBS. Proliferation was determined using Cell Counting Kit-8 (Dojindo Molecular Technologies, Rockville, MD, USA) according to manufacturer's instruction at 1, 2, 3, 5, 7, 10 and 14 days.
Flow cytometry
Mesenchymal stem cells were retrieved as described above, and resuspended at 5 × 10⁶ cells/ml in the buffer containing biotinylated antibody diluted at 1 Ag/ml. Anti-CD34, anti-CD44, anti-CD45 and anti-CD90 were purchased from BD Pharmingen. An isotype control tube also was run in tandem. Labelling reaction was shaked for 10 min. at room temperature. Cells were washed twice and then labelled with ExtrAvidin-FITC diluted to 1:400 (Sigma-Aldrich). After two more washes, FACS analysis was performed on a FACS calibur (BD) flow cytometer using CellQuestk software with 20,000 events recorded for each sample.
Adipogenic differentiation
After reaching confluence, MSCs from SCI rats and SHAM rats were cultured in adipogenic medium (high glucose DMEM containing 10 μg/ml insulin, 0.1 mmol/l dexamethasone, 0.2 mmol/l indomethacin, 10% FBS and 1% antibiotic-antimycotic solution). At day 14, adipogenesis was measured using the oil red O staining. Briefly, cells were fixed by ice-cold 10% formalin in PBS for 10 min., rinsed with distilled water and stained with oil red O solution as described above. Mean number of lipid droplets was calculated from six different fields.
Osteogenic differentiation
After reaching confluence, MSCs from SCI and SHAM rats were cultured in osteogenic medium (high glucose DMEM containing 10% FBS, supplemented with 50 μg/ml ascorbic acid, 10 mmol/l sodium β-glycerophosphate and 10 nmol/l dexamethasone). At day 28, osteogenesis was measured using Alizarin Red staining and Von Kossa staining. Mean number of mineralized nodules was calculated from six different fields.
Treatment of MSCs from SCI rats with GW9662 or TGZ or BIO or DKK1
Mesenchymal stem cells from SCI rats and SHAM rats were replated at 2 × 10⁵ cells/well in six-well plate, treated with vehicle or 2-Chloro-5-nitro-N-phenylbenzamide (GW9662; 0.5 μM) or troglitazone (TGZ; 100 μM) or (2Z,3E)-6-bromoindirubin-3-oxime (BIO; 200 nM) or Dickkopf 1 (DKK1; 500 ng/ml) in high glucose DMEM containing 10% FBS. Culture medium was changed every 2 days. After 3 weeks of culture, conditioned media of cultures were collected and stored frozen at −70°C until assayed using ELISA, and the cells layers were also harvested for real-time PCR analysis and Western blot analysis.
Protein secretion
Medium leptin, adiponectin and OPG concentrations were determined using ELISA kits for rat leptin, adiponectin and OPG assay (Sigma-Aldrich). In brief, 5–10 ml of medium was collected from the cell culture plates, lyophilized and dissolved in 0.4–1.0 ml of distilled water. An aliquot of 100 μl was analysed according to the protocol. Medium ALP concentrations were measured spectrophotometrically (BM/Hitachi 747; Boehringer Mannheim, Sydney, Australia). All results were expressed as secretion per 48 hr.
RNA analysis
Tibiae were crushed under liquid nitrogen conditions using a Bessman Tissue Pulverizer and RNA extracted using the method of Chomczynski and Sacchi as previously described 21. RNA integrity was verified by formaldehyde-agarose gel electrophoresis. Synthesis of cDNA was performed by reverse transcription with 2 μg of total RNA using the Superscript II kit with oligo dT(12–18) primers as described by the manufacturer (Sheng-Gong Technologies, Shanghai, China). cDNA (1 μl) was amplified by PCR in a final volume of 25 μl using the iQ SYBR Green Supermix (Bio-Rad, Hercules, CA, USA) with 10 pmol of each primer (Sheng-Gong). The primers of PPARγ, αP2, LPL, OPG, RANKL, Wnt1, Wnt5a, ctnnb1, Lef1, Lrp5 and β-actin were listed in Table1. Real-time PCR was carried out for 40 cycles using the iCycler (Bio-Rad, Hercules, CA, USA) and data were evaluated using the iCycler software. Each cycle consisted of 95°C for 15 sec., 60°C for 30 sec. and 72°C for 30 sec. RNA-free samples, a negative control, did not produce amplicons. Melting curve and gel analyses were used to verify single products of the appropriate base pair size.
Table 1.
Oligonucleotide primer for cDNA amplication
| Gene | Primer sequence (5′-3′) sense/antisense | Product size (bp) | Gene ID |
|---|---|---|---|
| PPARγ | CTTTACCACGGTTGATTTCTCCA | 122 | NM_013124 |
| GCAGGCTCTACTTTGATCGCACT | |||
| aP2 | AGGAAAGTGGCCGGTATGGC | 139 | NM_053365 |
| CCACGCCCAGTTTGAAGGAA | |||
| LPL | TGGCAGGAAGTCTGACCAACAAG | 147 | NM_012598 |
| AATCCGCATCATCAGGAGAAAGG | |||
| OPG | ACAATGAACAAGTGGCTGTGCTG | 109 | U94330 |
| CGGTTTCTGGGTCATAATGCAAG | |||
| RANKL | GCAGCATCGCTCTGTTCCTGTA | 164 | NM_057149 |
| GCATGAGTCAGGTAGTGCTTCTGTG | |||
| Wnt1 | GCCAACAGTAGTGGCCGATG | 98 | NM_001105714 |
| CTGGGCTCTAGCACCAGCTGTA | |||
| Wnt5a | ACTTGCACAACAATGAAGCAGGTC | 107 | NM_022631 |
| CAGCCAGCATGTCTTGAGGCTA | |||
| Ctnnb1 | AACGGCTTTCGGTTGAGCTG | 118 | NM_053357 |
| TGGCGATATCCAAGGGCTTC | |||
| Lef1 | TCAGGCAAGCCTACCCATCTTC | 145 | NM_130429 |
| GGGTGCTCCTGTTTGACCTGA | |||
| Lrp5 | AGTGCGTGGACCTGCGTTTAC | 99 | NM_001106321 |
| AATCGCACTGCTGCTTGATGAG | |||
| β-actin | CCTGTACGCCAACACAGTGC | 308 | NM_017008 |
| ATACTCCTGCTTGCTGATCC |
Western blot analysis
Primary and secondary antibodies for PPARγ, ß catenin, OPG and RANKL were obtained from Santa Cruz Biotechnology (Santa Cruz, CA, USA). The cell lysate was prepared in radioimmune precipitation assay buffer containing a protease inhibitor mixture and a phosphatase mixture. The protein content was measured using the Bradford method, and equal amounts of protein were loaded for electrophoresis on a 4–20% gradient gel. The standard Western blot analysis protocol was used thereafter. The protein expression was detected by chemiluminescence, quantified by densitometry and normalized to β-actin or GAPDH.
Statistical analysis
Data are presented as averages ± SE. Comparisons of results between the SCI and SHAM groups were performed with Student's t-test, a one- or two-factor analysis of variance with Fisher's least significant difference (LSD) test, using SPSS 13 software (SPSS Inc., Chicago, IL, USA). A P value of less than 0.05 was considered statistically significant.
Results
SCI caused sublesional bone loss
Spinal cord injury and SHAM rats had similar weights before the surgery. SCI caused sublesional bone loss. BMD was significantly lower (−33.1%) in the proximal tibiae of SCI rats (0.164 ± 0.016 g/cm2) than the SHAM rats (0.245 ± 0.026 g/cm2) 3 weeks after the surgery.
Sublesional marrow adiposity was increased after SCI
Sublesional marrow adiposity was increased, whereas peripheral adiposity was reduced after SCI. Adipose tissue obtained from femoral fat pads of SHAM rats exhibited lipid dense adipocytes in contrast with adipose tissue of SCI rats, which exhibited lipid sparse adipocytes (Fig.1A). The reduction in peripheral adiposity after SCI was further demonstrated by isolating and weighing the fat pads, which were reduced by 42.1% in weight (Fig.1B and C). The liver of SCI rats exhibited lipid sparse adipocytes compared with that of SHAM rats, and the weight of liver in SCI rats was significantly lower than that of SHAM rats (0.45 ± 0.04 g versus 0.33 ± 0.02 g) (Fig.1A and D). Femoral bone marrow from SCI rats stained for oil red O, displayed a significant increase in adipocytes compared with that of SHAM rats (38.23 ± 4.37% versus 5.28 ± 0.86%) (Fig.1A and E). CD44 and CD90 were highly expressed in undifferentiated primary MSCs. The FACS analysis is used to demonstrate the purified MSCs. Surface molecules including CD44 and CD90 were highly expressed in undifferentiated primary MSCs, but not CD34 and CD45 (Fig.2A–D).
Fig 1.
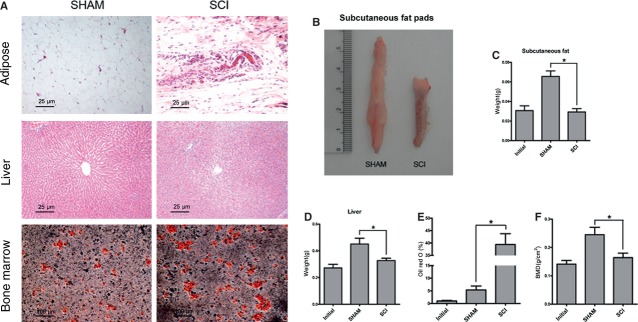
Adiposity is increased in tibial bone marrow, in contrast with peripheral adipose tissue lipolysis. (A) Representative fat pad sections, liver sections stained with haematoxylin and eosin, and bone marrow sections stained with Oil red O from spinal cord injury (SCI) and SHAM rats. Adipose tissue obtained from femoral fat pads and the liver of SCI rats exhibited lipid sparse adipocytes compared with that of SHAM rats. Bone marrow from SCI rats stained for oil red O displayed a significant increase in adipocytes compared with that of SHAM rats. (B) Representative subcutaneous fat pads from SCI and SHAM rats. (C) The values of weights of subcutaneous fat pads were pooled from 10 rats per group and expressed as averages ± SE. *P < 0.01. (D) The values of weights of livers were pooled from 10 rats per group and expressed as averages ± SE. *P < 0.01. (E) The values of percentage of Oil red O staining were pooled from 10 rats per group and expressed as averages ± SE. *P < 0.01.
Fig 2.
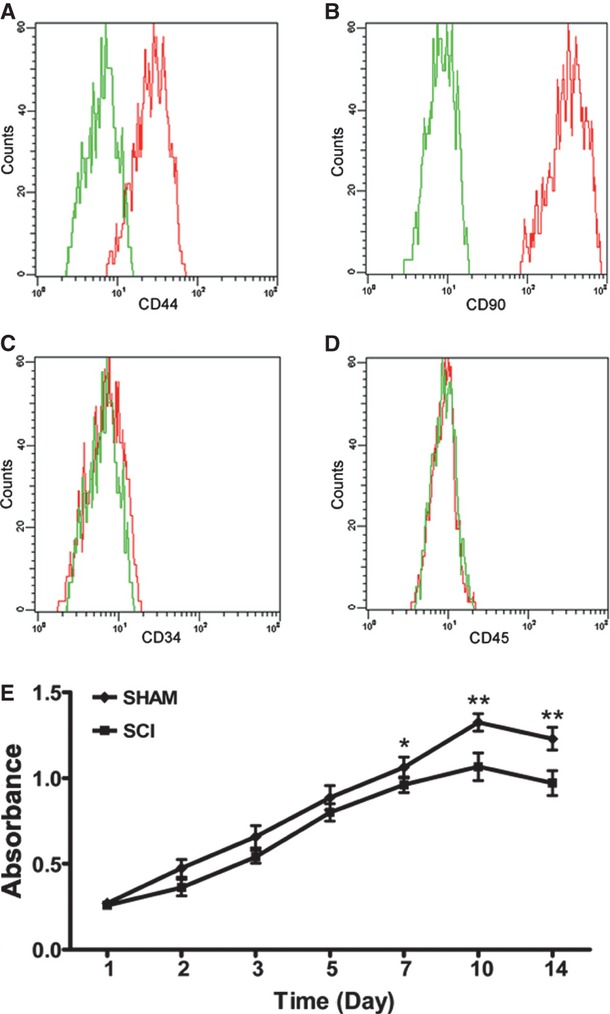
CD44 and CD90 were highly expressed in mesenchymal stem cells (MSC) from spinal cord injury (SCI) rats. The MSC cultures were analysed by FACS for the expression of CD44 (A), CD90 (B), CD34 (C) and CD45 (D). MSCs were shown to be devoid of CD34- and CD45-positive haematopoietic cells. MSCs: mesenchymal stem cells; green line: control cells labelled without primary antibodies; red line: cells labelled with primary antibodies and ExtrAvidin-FITC. (E) The proliferation of MSCs from SCI rats was decreased compared with that of SHAM rats at 7, 10 and 14 days. This experiment was repeated three times.
MSC proliferation was decreased after SCI
The proliferation of MCS from SCI rats was decreased compared with those from SHAM rats at 7, 10 and 14 days, but not at 1, 2, 3 and 5 days (Fig.2E).
Osteogenesis was decreased whereas adipogenesis was increased in MSCs
Osteogenesis and adipogenesis of sublesional femoral MSCs were investigated to demonstrate whether there was a shift between osteogenesis and adipogenesis after SCI. MSCs from SCI rats and SHAM rats were cultured in adipogenic medium (high glucose DMEM containing 10 μg/ml insulin, 0.1 mmol/l dexamethasone, 0.2 mmol/l indomethacin, 10% FBS and 1% antibiotic-antimycotic solution). At day 14, adipogenesis was measured using the oil red O staining. The number of fat droplets that developed from MSCs in SCI rats were significantly more than SHAM rats (7.86 ± 2.97% versus 1.43 ± 0.98%) (Fig.3A and B).
Fig 3.
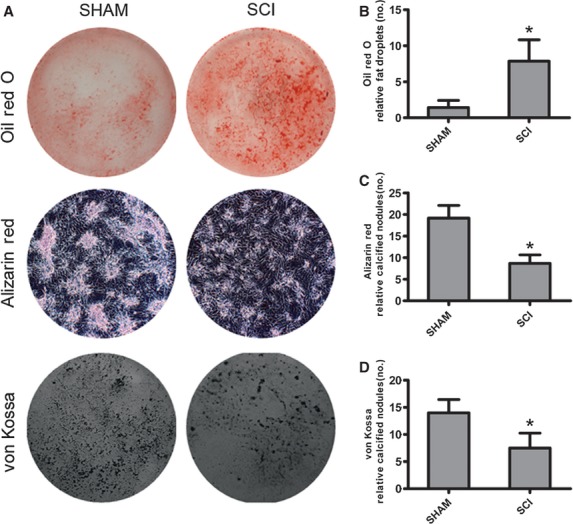
Adipogenesis is increased in mesenchymal stem cells (MSC) from spinal cord injury (SCI) rats, whereas osteogenesis is decreased as compared with those from SHAM rats. (A) Representative lipid droplets and mineralized nodules developed from MSCs of SCI and SHAM rats. (B) Adipocytes containing lipid droplets were stained by Oil red O staining. The number of lipid droplets were pooled from 10 rats per group and expressed as averages ± SE. *P < 0.01. (C, D) Mineralized nodules were stained by Alizarin red staining and von Kossa staining. The number of mineralized nodules were pooled from 10 rats per group and expressed as averages ± SE. *P < 0.01.
Mesenchymal stem cells from SCI and SHAM rats were cultured in osteogenic medium (high glucose DMEM containing 10% FBS, supplemented with 50 μg/ml ascorbic acid, 10 mmol/l sodium β-glycerophosphate and 10 nmol/l dexamethasone). At day 28, osteogenesis was measured using Alizarin Red staining and Von Kossa staining. The number of mineralized nodules that developed from MSCs in SCI rats was significantly less than SHAM rats (Alizarin red: 7.52 ± 2.74 versus 14.18 ± 2.45; von Kossa: 8.67 ± 1.97 versus 19.17 ± 2.93) (Fig.3A, C and D).
Adipocyte marker was increased and canonical Wnt was decreased in sublesional bones after SCI
To investigate whether there was a shift between adipogenesis and osteogenesis after SCI, adipocyte marker and canonical Wnt were analysed in sublesional tibiae. The mRNA expression of Wnt1, Lrp5 and Ctnnb1 in tibiae from SCI rats was significantly lower than SHAM rats (Fig.4A). However, the expression of gene coding for PPARγ, αP2 and LPL in tibiae from SCI rats was significantly higher than SHAM rats (Fig.4B). In addition, a significant decrease of RANKL mRNA was observed, coupled with a more significant decrease of OPG mRNA in tibiae from SCI rats compared with that of SHAM rats. Thus, the ratio of RANKL to OPG expression in tibiae from SCI rats was significantly higher than that of SHAM rats (Fig.4B).
Fig 4.
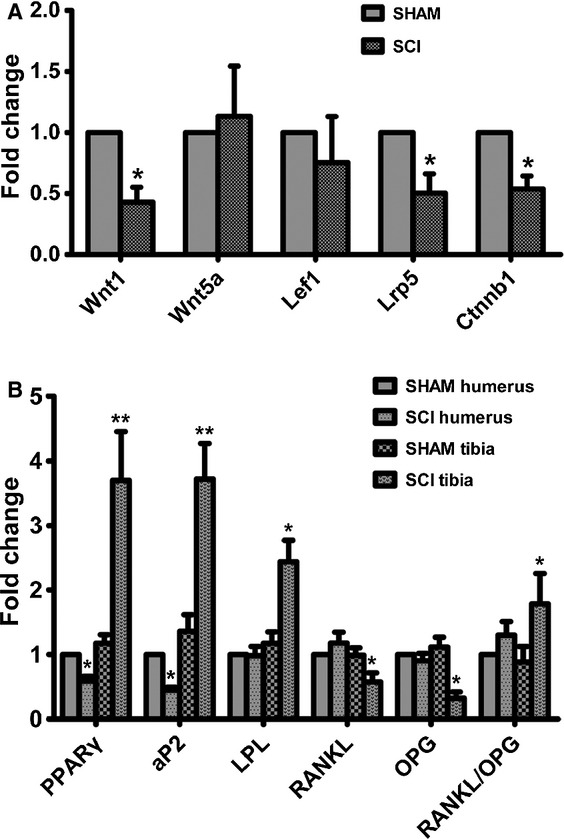
peroxisome proliferator-activated receptor-γ (PPARγ) expression is increased and Wnt signalling is diminished in the skeleton of spinal cord injury (SCI) rats compared with that of SHAM rats. (A) Expression levels of Wnt1, Wnt5a, Lef1, Lrp5 and ctnnb1 mRNA in tibiae of SCI and SHAM rats. (B) Expression levels of PPARγ, αP2, LPL, OPG and RANKL mRNA in humeri and tibiae of SCI and SHAM rats. cDNA synthesis was performed from RNA which was extracted from the respective tibiae. The cDNAs were amplified using real-time PCR. The values of expression levels were pooled from 10 rats per group and expressed as averages ± SE. *P < 0.01.
Tibial bone expression of PPARγ protein levels of MSCs from SCI rats was significantly higher than SHAM rats 3 weeks after surgery, but not at 3 months and 6 months after surgery (Fig.5A and B). However, humeral bone expression of PPARγ protein levels of MSCs from SCI rats was significantly lower than that of SHAM rats 6 months after surgery, but not at 3 weeks and 3 months after surgery (Fig.5A and B). Tibial bone expression of ß catenin protein levels of MSCs from SCI rats was significantly higher than that of SHAM rats 3 weeks after surgery (Fig.6A and B).
Fig 5.
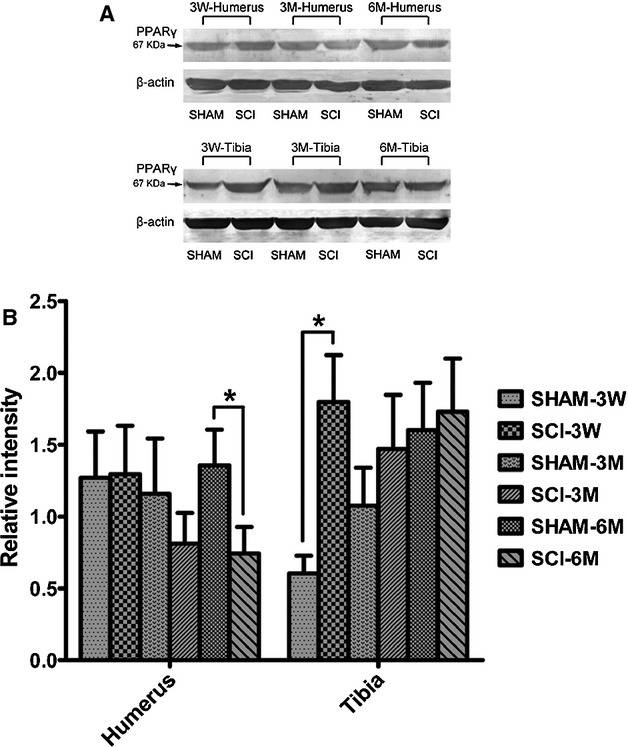
peroxisome proliferator-activated receptor-γ (PPARγ) protein expression is increased in tibiae, whereas decreased in humeri in spinal cord injury (SCI) rats compared with that of SHAM rats. Protein expression levels of PPARγ in humeri and tibiae of SCI and SHAM rats 3 weeks, 3 months and 6 months after SCI. Western Blot bands were evaluated by densitometric analysis. The values of expression levels were pooled from 10 rats per group and expressed as averages ± SE. *P < 0.01.
Fig 6.
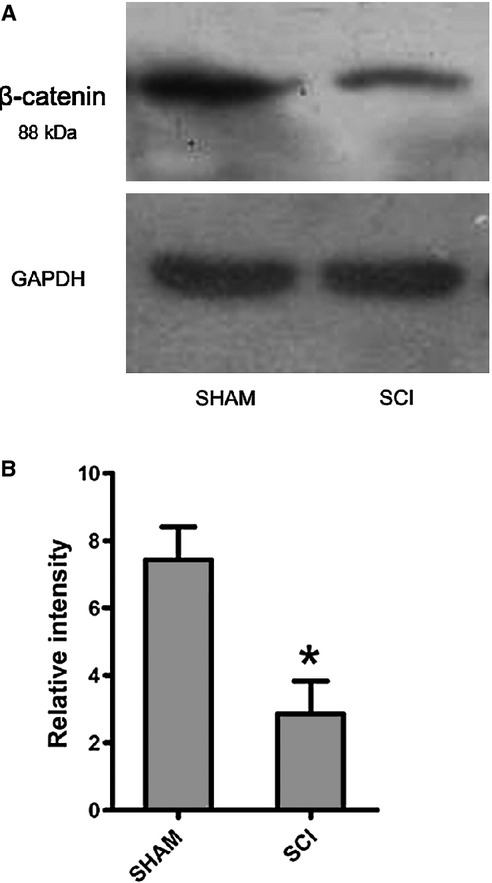
β-catenin expression is decreased in tibiae in spinal cord injury (SCI) rats compared with that of SHAM rats. Protein expression levels of ß-catenin in tibiae of SCI and SHAM rats 3 weeks after SCI. Western Blot bands were evaluated by densitometric analysis. The values of expression levels were pooled from 10 rats per group and expressed as averages ± SE. *P < 0.01.
PPARγ promoted osteoclastogenesis whereas inhibited osteoblastogenesis in MSCs
Mesenchymal stem cells were treated with GW9662 and TGZ to demonstrate the effects of PPARγ on osteoblastogenesis and osteoclastogenesis. In MSCs from SCI rats treated with the PPARγ inhibitor GW9662, the levels of OPG mRNA and protein were increased, whereas the RANKL mRNA and protein levels were decreased. As a result, the ratio of RANKL to OPG expression in SCI rats was significantly decreased (Figs7A and 8A–C). On the contrary, in MSCs from SCI rats treated with the PPARγ ligand TGZ, the levels of OPG mRNA and protein were significantly decreased, whereas the RANKL mRNA and protein levels were significantly increased. As a result, the ratio of RANKL to OPG expression in SCI rats was significantly increased (Figs7A and 8A–C).
Fig 7.
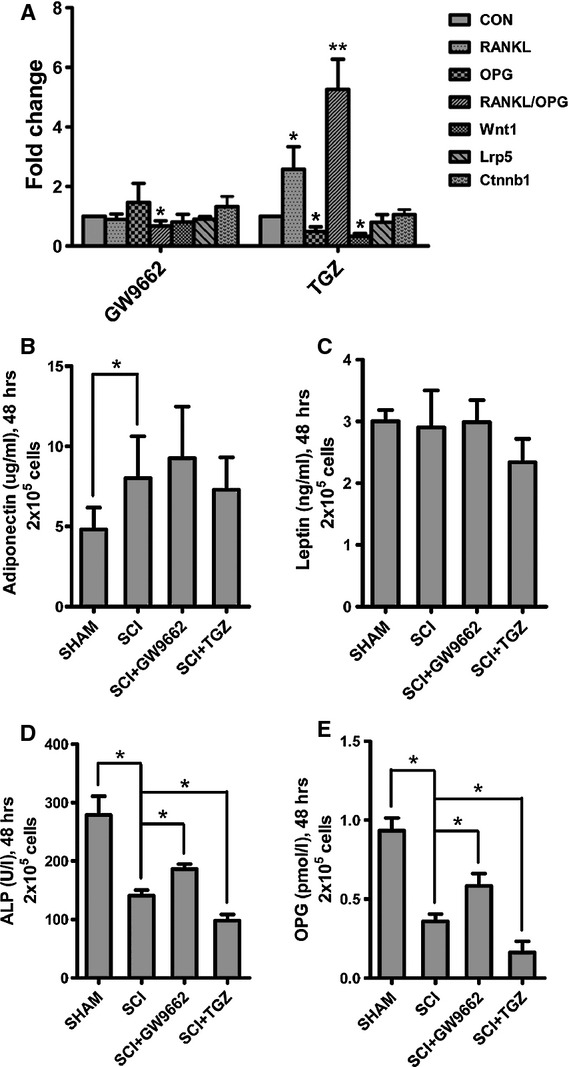
In vitro effects of GW9662 and troglitazone (TGZ) on RANKL mRNA, OPG mRNA, Wnt signalling and protein secretion in mesenchymal stem cells (MSC) from spinal cord injury (SCI) and SHAM rats. (A) TGZ up-regulated RANKL/OPG ratio, whereas GW9662 down-regulated RANKL/OPG ratio in MSCs from SCI rats as compared with that of SHAM rats. And, TGZ down-regulated Wnt1 in MSCs from SCI rats as compared with that of SHAM rats. (B–E) The adiponectin levels in the medium were significantly higher in MSCs from SCI rats than SHAM rats, whereas the ALP and OPG levels were significantly lower in MSCs from SCI rats than SHAM rats. There was no significant difference of leptin levels in the medium between MSCs from SCI rats and SHAM rats. The ALP abd OPG levels in the medium were decreased in MSCs treated with TGZ, and increased in MSCs treated with GW9662. The values of medium levels were pooled from 10 samples per group and expressed as averages ± SE. *P < 0.01.
Fig 8.
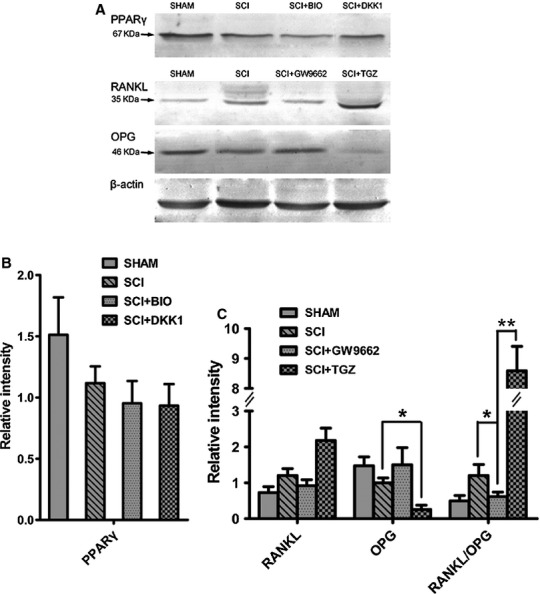
In vitro effects of GW9662 and troglitazone (TGZ) on RANKL and OPG protein expression and in vitro effects of BIO and Dickkopf 1 (DKK1) on peroxisome proliferator-activated receptor-γ (PPARγ) protein expression in mesenchymal stem cells (MSC) from spinal cord injury (SCI) and SHAM rats. (A) Representative PPARγ protein expression in MSCs from SCI and SHAM rats treated with BIO and DKK1; representative OPG and RANKL protein expression in MSCs from SCI and SHAM rats treated with GW9662 and TGZ. (B) There were no significant effects of BIO and DKK1 on PPARγ protein expression in MSCs from SCI and SHAM rats. (C) TGZ up-regulated RANKL/OPG ratio, whereas GW9662 down-regulated RANKL/OPG ratio in MSCs from SCI rats as compared with SHAM rats.
Medium adiponectin levels in MSCs from SCI rats were significantly higher than those from SHAM rats (Fig.7B), whereas medium ALP and OPG levels in MSCs from SCI rats were significantly lower than those from SHAM rats (Fig.7D and E). In MSCs from SCI rats treated with GW9662, medium ALP and OPG levels was significantly increased. On the contrary, in MSCs from SCI rats treated with TGZ, medium ALP and OPG levels was significantly decreased (Fig.7B–E).
There was no crosstalk between the canonical Wnt and PPARγ axis
Mesenchymal stem cells were treated with GW9662, TGZ, BIO and DKK1 to demonstrate whether there was crosstalk between the canonical Wnt and PPARγ axis. GW9662 acts as the irreversible antagonist of PPARγ, whereas TGZ acts as the activator of PPARγ. Therefore, we did not investigate how GW9662 and TGZ regulated PPARG expression. BIO acts as Wnt activator whereas DKK acts as Wnt inhibitor. Similarly, we did not investigate how BIO and DKK regulated β-catenin expression. In MSCs from SCI rats treated with GW9662, there was no significant change of Wnt1, Lrp5 and Ctnnb1 mRNA expression (Fig.7A). Also, in MSCs from SCI rats treated with TGZ, there was no significant change of Lrp5 and Ctnnb1 mRNA expression, whereas Wnt1 mRNA expression was significantly decreased (Fig.7A). Similarly, in MSCs from SCI rats treated with BIO that mimics Wnt signalling through direct stabilization of β-catenin and the Wnt inhibitor DKK1, there was no significant change of PPARγ protein expression (Fig.8A and B).
Discussion
Our study demonstrated increased sublesional marrow adiposity and decreased peripheral adiposity after SCI. The increased number of droplets in tibial bone marrow from SCI rats suggested increased sublesional marrow adiposity. On the one hand, lipid sparse adipocytes that are always present in the marrow were accumulating lipid and becoming visible. On the other hand, mesenchymal pluripotent cells were becoming adipocytes. In contrast with bone marrow, adipose stores at other sites are depleted in SCI rats as indicated by decreased liver and peripheral adipose tissue weights. On the contrary, our study demonstrated decreased osteogenesis, which was supported that the number of mineralized nodules that developed from MSCs in SCI rats was significantly less than that of SHAM rats. Increased adipogenesis could occur at the expense of osteoblast lineage selection, eventually leading to decreased osteoblast number. Selection of adipogenesis over osteoblastogenesis is a common theme that has been reported in other conditions of bone loss, including age-related osteoporosis 20,22. Taken together, SCI may disturb the balance between adipogenesis and osteoblastogenesis, resulting in bone loss after SCI.
Our study demonstrated increased PPARγ expression and decreased Wnt signalling in tibiae from SCI. PPARγ represents a marker of increased adipocyte number and/or adipogenesis, and functions as an inducer of adipogenesis. In addition, PPARγ insufficiency results in the enhancement of osteogenesis and suppression of adipogenesis in mice 23, and elevation of PPARγ levels can promote adipogenesis in pluripotent mesenchymal cells in vitro 16,24. Also, PPARγ levels have a dominant suppressive influence on osteogenesis. On the contrary, canonical Wnt signalling enhances osteoblast differentiation. It was demonstrated that the mechanical unloading caused decrease of Wnt/beta-catenin signalling activity 25. Sclerostin, a Wnt signalling pathway antagonist produced by osteocytes, is a potent inhibitor of bone formation, and circulating sclerostin was found to be elevated in short-term SCI patients (≤5 years after injury) 26. Furthermore, we found that ALP levels in the medium were decreased in TGZ-treated MSCs from SCI rats, whereas increased in GW-treated MSCs from SCI rats. Taken together, to some extent, these findings can explain the imbalance between adipogenesis and osteoblastogenesis after SCI.
No crosstalk was found between the canonical Wnt and PPARγ axis in MSCs from SCI rats. It was reported that negative crosstalk occurs between the canonical Wnt and PPARγ axis in multipotent stromal cells 27. However, Wnt signalling was not increased in MSCs from SCI rats by inhibiting the master regulator of adipogenesis, PPARγ. Also, PPARγ could not be increased by direct inhibition of GSK3β.
Our previous study showed increased osteoclastogenesis and bone resorption in SCI rats 8. PPARγ and its ligand may play a pivot role in promoting osteoclast differentiation and bone resorption 28. It was demonstrated that loss of function by targeted PPARγ deletion impairs osteoclast differentiation and bone resorption, resulting in osteopetrosis and extramedullary haematopoiesis. In contrast, gain of function by ligand activation of PPARγ accelerates osteoclast differentiation and bone resorption in a receptor-dependent manner. We found that the ratio of RANKL/OPG was significantly increased in sublesional tibiae from SCI rats. Also, RANKL/OPG ratio was significantly decreased in MSCs from SCI rats treated with GW9662. In contrast, in MSCs from SCI rats treated with TGZ, the ratio of RANKL/OPG was significantly increased. High expression of PPARγ may lead to increased bone resorption through the RANKL/OPG axis after SCI.
Adiposity was increased in sublesional bone marrow, whereas the number of mineralized nodules that developed from MSCs in SCI rats was significantly less than SHAM rats. This suggests that SCI may contribute to bone loss through the change of MSCs differentiation resulting in decreased mature osteoblasts and increased adipose accumulation. Furthermore, SCI caused increased PPARγ expression and diminished Wnt signalling in sublesional bones, and thus leading to a shift in skeletal balance between osteoblastogenesis and adipogenesis. In addition, high expression of PPARγ may lead to increased bone resorption through the RANKL/OPG axis after SCI.
Acknowledgments
This study was supported by the National Natural Science Foundation of China (no. 81000793, no. U1032001), Shanghai Rising-Star Program (no. 08QA1405000) and Shanghai Educational Development Foundation (no. 2008CG21).
Conflicts of interest
None.
References
- Jiang SD, Jiang LS, Dai LY. Changes in bone mass, bone structure, bone biomechanical properties, and bone metabolism after spinal cord injury: a 6-month longitudinal study in growing rats. Calcif Tissue Int. 2007;80:167–75. doi: 10.1007/s00223-006-0085-4. [DOI] [PubMed] [Google Scholar]
- Garland DE, Adkins RH, Stewart CA, et al. Regional osteoporosis in women who have a complete spinal cord injury. J Bone Joint Surg Am. 2001;83-A:1195–200. doi: 10.2106/00004623-200108000-00009. [DOI] [PubMed] [Google Scholar]
- Roberts D, Lee W, Cuneo RC, et al. Longitudinal study of bone turnover after acute spinal cord injury. J Clin Endocrinol Metab. 1998;83:415–22. doi: 10.1210/jcem.83.2.4581. [DOI] [PubMed] [Google Scholar]
- Kiratli BJ, Smith AE, Nauenberg T, et al. Bone mineral and geometric changes through the femur with immobilization due to spinal cord injury. J Rehabil Res Dev. 2000;37:225–33. [PubMed] [Google Scholar]
- Takata S, Yasui N. Disuse osteoporosis. J Med Invest. 2001;48:147–56. [PubMed] [Google Scholar]
- Uebelhart D, Demiaux-Domenech B, Roth M, et al. Bone metabolism in spinal cord injured individuals and in others who have prolonged immobilisation. A review. Paraplegia. 1995;33:669–73. doi: 10.1038/sc.1995.140. [DOI] [PubMed] [Google Scholar]
- Jiang SD, Jiang LS, Dai LY. Mechanisms of osteoporosis in spinal cord injury. Clin Endocrinol (Oxf) 2006;65:555–65. doi: 10.1111/j.1365-2265.2006.02683.x. [DOI] [PubMed] [Google Scholar]
- Jiang SD, Jiang LS, Dai LY. Effects of spinal cord injury on osteoblastogenesis, osteoclastogenesis and gene expression profiling in osteoblasts in young rats. Osteoporos Int. 2007;18:339–49. doi: 10.1007/s00198-006-0229-4. [DOI] [PubMed] [Google Scholar]
- Krause DS, Theise ND, Collector MI, et al. Multi-organ, multi-lineage engraftment by a single bone marrow-derived stem cell. Cell. 2001;105:369–77. doi: 10.1016/s0092-8674(01)00328-2. [DOI] [PubMed] [Google Scholar]
- Sanchez-Ramos J, Song S, Cardozo-Pelaez F, et al. Adult bone marrow stromal cells differentiate into neural cells in vitro. Exp Neurol. 2000;164:247–56. doi: 10.1006/exnr.2000.7389. [DOI] [PubMed] [Google Scholar]
- Ferrari G, Cusella-De Angelis G, Coletta M, et al. Muscle regeneration by bone marrow-derived myogenic progenitors. Science. 1998;279:1528–30. doi: 10.1126/science.279.5356.1528. [DOI] [PubMed] [Google Scholar]
- Gregory CA, Green A, Lee N, et al. The promise of canonical Wnt signaling modulators in enhancing bone repair. Drug News Perspect. 2006;19:445–52. doi: 10.1358/dnp.19.8.1043960. [DOI] [PubMed] [Google Scholar]
- Rawadi G, Vayssiere B, Dunn F, et al. BMP-2 controls alkaline phosphatase expression and osteoblast mineralization by a Wnt autocrine loop. J Bone Miner Res. 2003;18:1842–53. doi: 10.1359/jbmr.2003.18.10.1842. [DOI] [PubMed] [Google Scholar]
- Bain G, Muller T, Wang X, et al. Activated beta-catenin induces osteoblast differentiation of C3H10T1/2 cells and participates in BMP2 mediated signal transduction. Biochem Biophys Res Commun. 2003;301:84–91. doi: 10.1016/s0006-291x(02)02951-0. [DOI] [PubMed] [Google Scholar]
- Rosen ED, Spiegelman BM. PPARgamma: a nuclear regulator of metabolism, differentiation, and cell growth. J Biol Chem. 2001;276:37731–4. doi: 10.1074/jbc.R100034200. [DOI] [PubMed] [Google Scholar]
- Lecka-Czernik B, Gubrij I, Moerman EJ, et al. Inhibition of Osf2/Cbfa1 expression and terminal osteoblast differentiation by PPARgamma2. J Cell Biochem. 1999;74:357–71. [PubMed] [Google Scholar]
- Moerman EJ, Teng K, Lipschitz DA, et al. Aging activates adipogenic and suppresses osteogenic programs in mesenchymal marrow stroma/stem cells: the role of PPAR-gamma2 transcription factor and TGF-beta/BMP signaling pathways. Aging Cell. 2004;3:379–89. doi: 10.1111/j.1474-9728.2004.00127.x. [DOI] [PMC free article] [PubMed] [Google Scholar]
- Verma S, Rajaratnam JH, Denton J, et al. Adipocytic proportion of bone marrow is inversely related to bone formation in osteoporosis. J Clin Pathol. 2002;55:693–8. doi: 10.1136/jcp.55.9.693. [DOI] [PMC free article] [PubMed] [Google Scholar]
- Kajkenova O, Lecka-Czernik B, Gubrij I, et al. Increased adipogenesis and myelopoiesis in the bone marrow of SAMP6, a murine model of defective osteoblastogenesis and low turnover osteopenia. J Bone Miner Res. 1997;12:1772–9. doi: 10.1359/jbmr.1997.12.11.1772. [DOI] [PubMed] [Google Scholar]
- Jilka RL, Weinstein RS, Takahashi K, et al. Linkage of decreased bone mass with impaired osteoblastogenesis in a murine model of accelerated senescence. J Clin Invest. 1996;97:1732–40. doi: 10.1172/JCI118600. [DOI] [PMC free article] [PubMed] [Google Scholar]
- Chomczynski P, Sacchi N. Single-step method of RNA isolation by acid guanidinium thiocyanate-phenol-chloroform extraction. Anal Biochem. 1987;162:156–9. doi: 10.1006/abio.1987.9999. [DOI] [PubMed] [Google Scholar]
- Nuttall ME, Gimble JM. Controlling the balance between osteoblastogenesis and adipogenesis and the consequent therapeutic implications. Curr Opin Pharmacol. 2004;4:290–4. doi: 10.1016/j.coph.2004.03.002. [DOI] [PubMed] [Google Scholar]
- Akune T, Ohba S, Kamekura S, et al. PPARgamma insufficiency enhances osteogenesis through osteoblast formation from bone marrow progenitors. J Clin Invest. 2004;113:846–55. doi: 10.1172/JCI19900. [DOI] [PMC free article] [PubMed] [Google Scholar]
- Rzonca SO, Suva LJ, Gaddy D, et al. Bone is a target for the antidiabetic compound rosiglitazone. Endocrinology. 2004;145:401–6. doi: 10.1210/en.2003-0746. [DOI] [PMC free article] [PubMed] [Google Scholar]
- Lin C, Jiang X, Dai Z, et al. Sclerostin mediates bone response to mechanical unloading through antagonizing Wnt/beta-catenin signaling. J Bone Miner Res. 2009;24:1651–61. doi: 10.1359/jbmr.090411. [DOI] [PubMed] [Google Scholar]
- Battaglino RA, Sudhakar S, Lazzari A, et al. Circulating sclerostin is elevated in short-term and reduced in long-term SCI. Bone. 2012 doi: 10.1016/j.bone.2012.04.019. May 7. [Epub ahead of print] [DOI] [PMC free article] [PubMed] [Google Scholar]
- Krause U, Harris S, Green A, et al. Pharmaceutical modulation of canonical Wnt signaling in multipotent stromal cells for improved osteoinductive therapy. Proc Natl Acad Sci USA. 2010;107:4147–52. doi: 10.1073/pnas.0914360107. [DOI] [PMC free article] [PubMed] [Google Scholar]
- Wan Y, Chong LW, Evans RM. PPAR-gamma regulates osteoclastogenesis in mice. Nat Med. 2007;13:1496–503. doi: 10.1038/nm1672. [DOI] [PubMed] [Google Scholar]


