

Abstract
Persistent high-risk human papillomavirus (HPV) infection is strongly associated with the development of high-grade cervical intraepithelial neoplasia or cancer (CIN3+). However, HPV infection is common and usually transient. Viral load measured at a single time-point is a poor predictor of the natural history of HPV infection. The profile of viral load evolution over time could distinguish HPV infections with carcinogenic potential from infections that regress. A case-cohort natural history study was set-up using a Belgian laboratory database processing more than 100,000 liquid cytology specimens annually. All cytology leftovers were submitted to real-time PCR testing identifying E6/E7 genes of 17 HPV types, with viral load expressed as HPV copies/cell. Samples from untreated women who developed CIN3+ (n = 138) and women with transient HPV infection (n = 601) who contributed at least three viral load measurements were studied. Only single-type HPV infections were selected. The changes in viral load over time were assessed by the linear regression slope for the productive and/or clearing phase of infection in women developing CIN3+ and women with transient infection respectively. Transient HPV infections generated similar increasing (0.21 copies/cell/day) and decreasing (−0.28 copies/cell/day) viral load slopes. In HPV infections leading to CIN3+, the viral load increased almost linearly with a slope of 0.0028 copies/cell/day. Difference in slopes between transient infections and infections leading to CIN3+ was highly significant (P < .0001). Serial type-specific viral load measurements predict the natural history of HPV infections and could be used to triage women in HPV-based cervical cancer screening.
Keywords: Viral doubling time, virologic model, cervical intraepithelial neoplasia, liquid-based cytology leftover, real-time quantitative PCR
Introduction
Momentum builds towards the understanding and awareness that persistent infection with high-risk human papillomavirus (HPV) is the primary risk factor for the development of high-grade cervical intraepithelial neoplasia (CIN) and cancer (CIN3+) 1–3. Although many questions remain unanswered regarding the natural history of HPV infection and CIN3+ 4, it is now generally accepted that loss of the episomal form of the viral DNA and its integration with the host cell genome is probably a key event in carcinogenesis 5.
Cervical cancer screening programmes have been based on cytologic Papanicolaou (Pap) tests, which show moderate cross-sectional sensitivity for detection of CIN3+. High-risk HPV-based screening considerably increases sensitivity [ratio: 1.28 (95% CI 1.12–1.47)], but its specificity is significantly lower compared with cytology-based screening [0.93 (95% CI 0.91–0.95)] 6. The lower specificity is due to the high number of transient HPV infections and associated low-grade cytological abnormalities. At the current turning point in screening procedure, cytology is making way for primary HPV screening 7,8. In this setting, adequate triage of HPV-positive women remains a key problem.
Until now, most viral load studies focused on HPV 16 or HPV 18 9–18, and few on additional high-risk HPV types 9,10. Also, single-point studies on HPV viral load measurement added little or no information about the probability of developing cervical cancer 11,16,19 and some studies suggested that serial viral load measurements are indicated 11,16.
Repeated non-quantitative HPV testing was shown to be associated with a significantly higher probability of developing CIN3+, particularly with high-risk HPV types 16, 18, 31 and 33 20,21. In the majority of cases, studies using sequential quantitative viral load measurements showed a significant decrease in HPV or clearance; viral load increase occurred only in a minority of individuals and was associated with a modest increased risk of acquiring a cytologic abnormality 11,16,19,22,23.
This large case-cohort natural history study analyses the variations in type-specific HPV loads over time for single HPV types in a control group with transient infections (no CIN3+; HPV clearance) and a patient group developing CIN3+ lesions. Considering the change in viral load over time, expressed as HPV copies per cell in single-type infections, a model is proposed distinguishing transient from persistent progressive infections leading to CIN3+.
Materials and methods
Samples for HPV analyses
This laboratory-based, case-cohort natural history study was set-up using the RIATOL cervical cancer screening and diagnostic follow-up database. The laboratory for clinical pathology (RIATOL), Antwerp, Belgium, is processing more than 100,000 liquid-based cytology samples annually, representing approximately one quarter of women participating in cervical cancer screening in Belgium. Since June 2006, all liquid-based cytology leftovers (n = 582,781 samples from 291,883 women) were subjected to HPV measurements to enable HPV-guided cytology 24. Therefore, cytology is not considered an independent parameter and was not used in the building of the virologic model. Cervical samples were collected in the framework of cervical cancer screening. In Belgium, costs for collection and interpretation of Pap smears are partially reimbursed. This was done without interval constraint until mid-2009 and, since then, on biennial basis for screening unless previous samples were abnormal. Local follow-up guidelines for management of cervical abnormalities are in agreement with EU guidelines 25,26. The RIATOL cervical cancer screening and diagnostic follow-up database contains all the cytologic, histologic, treatment and virologic data, which are linked using a unique case identification (ID) number. Patients were selected by the following inclusion criteria: women with a single-type HPV infection and who have not received any treatment of the cervix during the measurement period. For transient infections all consecutive patients presenting in a 3-month period (June to August 2011) with at least three consecutive measurements that start with a negative HPV result on time t0–1, followed by one or more positive results, with tmax being the time with the highest viral load, and ending with a negative result on time t0+1 were included (Figs1and 2).
Fig 1.

Study Profile. (A) Selection of women with transient single-type HPV infections. (B) Selection of women with single-type HPV infections leading to CIN3+. * = Since June 2006 HPV genotyping was always performed before cytology reading.
Fig 2.
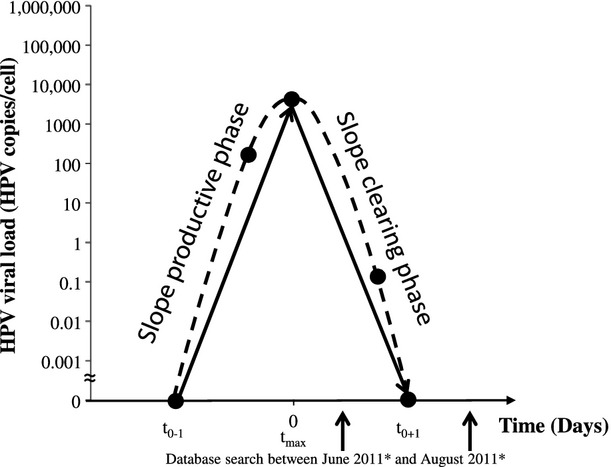
Transient Infections. t0–1 = time of the last negative measurement before the transient infection. t0+1 = time of the first negative measurement after the transient infection. tmax = time of highest measured viral load. Circles represent viral load measurement on liquid-based cytology leftover. The slopes were calculated between the lowest and highest viral load measurement on tmax. To calculate logarithms at t0-1 and t0+1, a value of 1E-99 was used as viral load. * = database search identified consecutive transient infections between June and August 2011.
For persistent infections leading to CIN3+ the whole database was searched. Only patients with at least three consecutive viral load measurements followed by histologically proven CIN3+ were included (Fig.1). This study was approved by the local ethical committee (University Hospital Antwerp, Antwerp, Belgium).
Isolation of DNA from cervical cells for HPV DNA testing
Cervical cells were collected using the Cervex-Brush® Combi (Rovers, Oss, The Netherlands) as recommended in EU guidelines 27. After collection, the head of the brush was left in the vial containing the ethanol-based BD SurePath™ Preservative Fluid (BD SurePath™; BD Diagnostics – TriPath, Burlington, NC, USA). The vials were then transported to RIATOL, Department of Molecular Diagnostics, Sonic Healthcare Benelux, Antwerp, Belgium, where all samples were prepared. A density sedimentation method (BD PrepMate™; BD Diagnostics – Tripath) was used to enrich the cell samples by removing obscuring elements such as blood, inflammatory cells, necrotic debris and mucus. DNA was isolated from the cellular pellet remaining after cytologic processing as previously described in earlier work 28.
Real-time type-specific PCR analysis of HPV DNA
Each DNA extract was subjected to real-time quantitative PCR for the detection of 17 different HPV types: HPV6 E6, HPV11 E6, HPV16 E7, HPV18 E7, HPV31 E6, HPV33 E6, HPV35 E6, HPV39 E7, HPV45 E7, HPV51 E7, HPV52 E7, HPV53 E6, HPV56 E7, HPV58 E7, HPV59 E7, HPV66 E6 and HPV68 E7, as previously described by Micalessi et al. 29. A β-globin real-time quantitative PCR was used to assess the DNA quality and to estimate the number of cells 29. The number of HPV copies was divided by the number of cells to calculate the viral load (HPV copies/cell).
Statistical analysis
For each case, the successive viral loads (HPV copies/cell) were plotted on a logarithmic scale against time (expressed in days). For transient infections, the change in type-specific viral load per unit of time was projected by estimating two slopes, considering (i) the calendar time (t0-1) corresponding with the negative HPV result preceding a transient infection, and the highest subsequent observed load measurement (tmax) for the productive phase and (ii) the load at tmax and the time (t0+1) at the first subsequent time-point with a negative HPV result for the clearing phase. The slopes were defined as log10 (type-specific HPV load on date 1) – log10 (type-specific HPV load on date 2) divided by the number of days occurring between date 1 and date 2. To calculate logarithms at t0-1 and t0+1, a value of 1E-99 was used as viral load.
For infections leading to CIN3+, the slope was calculated between the consecutive viral load measurements using a simple linear regression model [y = a + bx, where y is the predicted log10 (viral load), a is the intercept, x is the time interval, b is the slope (change in log10 viral load per unit of time)]. For each regression the coefficient of determination R² was calculated, which is a measure of deviation between the regression line and the observed points. For the productive phase of transient infections and persistent infections leading to CIN3+, the viral doubling time (VDT) in days was calculated for each HPV type by (ln 2)/slope. To calculate the starting point of the linear increase leading to CIN3+ a viral load of 0.00001 HPV copies/cell was used.
The slopes and viral doubling times were compared between the transient cases and infections leading to CIN3+ using the MedCalc® program (MedCalc Software, Mariakerke, Belgium) 30. For abnormally distributed variables, median values and interquartile range (IQR) are given. To compare differences in slopes between transient and progressive infections a two-sided Mann–Whitney U test was used.
Results
Transient HPV infections
The database search identified 601 monotypic transient infections in a 3-month period during 2011 (Fig.1A). The median age of women sampled was 36 years (IQR 27–45 years) with no significant age difference between the groups infected with different HPV types.
The median number of days between the first negative measurement (t0-1), the viral load maximum (tmax) and the last negative measurement (t0+1), irrespective of the HPV type, was 477 days (IQR 353–725 days) and 363 days (IQR 223–511 days) respectively. The median viral load at tmax was 62 HPV copies/cell (IQR 1–1765 HPV copies/cell).
The slopes for the productive and clearing phases were also calculated for each HPV type separately. Table1 records the slopes for the individual and all HPV types. There was no significant heterogeneity in the slopes for the transient infection between different HPV types (P = .434; Fig.3). For all HPV types the median slope for the productive phase of the transient infection was 0.21 HPV copies/cell/day (IQR 0.14–0.28), and −0.28 HPV copies/cell/day (IQR −0.45 to −0.20) for the clearing phase.
Table 1.
Type-specific median HPV slope and viral doubling times in transient infections
| Productive Phase | Clearing Phase | ||||||
|---|---|---|---|---|---|---|---|
| HPV Type | n | Slope | IQR | VDT (days) | IQR | Slope end | IQR |
| 6 | 15 | 0.24 | 0.14–0.32 | 2.9 | 2.2–5.0 | −0.43 | −0.53 to −0.28 |
| 11 | 7 | 0.28 | 0.26–0.36 | 2.5 | 2.0–2.7 | −0.39 | −0.50 to −0.30 |
| 16 | 73 | 0.19 | 0.14–0.28 | 3.6 | 2.5–5.0 | −0.28 | −0.49 to −0.17 |
| 18 | 21 | 0.22 | 0.16–0.27 | 3.2 | 2.5–4.3 | −0.25 | −0.35 to −0.18 |
| 31 | 44 | 0.21 | 0.14–0.27 | 3.4 | 2.6–4.9 | −0.26 | −0.34 to −0.19 |
| 33 | 19 | 0.17 | 0.14–0.34 | 4.1 | 2.0–5.0 | −0.25 | −0.40 to −0.20 |
| 35 | 21 | 0.16 | 0.13–0.51 | 4.3 | 1.4–5.5 | −0.32 | −0.51 to −0.27 |
| 39 | 56 | 0.26 | 0.16–0.32 | 2.7 | 2.2–4.4 | −0.25 | −0.44 to −0.14 |
| 45 | 23 | 0.25 | 0.17–0.38 | 2.8 | 1.8–4.1 | −0.32 | −0.45 to −0.27 |
| 51 | 67 | 0.19 | 0.13–0.27 | 3.7 | 2.6–5.2 | −0.26 | −0.46 to −0.18 |
| 52 | 46 | 0.21 | 0.14–0.29 | 3.3 | 2.4–5.1 | −0.25 | −0.34 to −0.18 |
| 53 | 41 | 0.24 | 0.15–0.27 | 2.9 | 2.6–4.6 | −0.24 | −0.37 to −0.16 |
| 56 | 46 | 0.20 | 0.14–0.28 | 3.4 | 2.5–5.0 | −0.28 | −0.33 to −0.21 |
| 58 | 39 | 0.23 | 0.13–0.32 | 3.0 | 2.2–5.2 | −0.30 | −0.46 to −0.22 |
| 59 | 32 | 0.16 | 0.12–0.24 | 4.4 | 2.9–5.8 | −0.27 | −0.35 to −0.20 |
| 66 | 40 | 0.21 | 0.14–0.26 | 3.3 | 2.7–4.8 | −0.29 | −0.47 to −0.20 |
| 68 | 11 | 0.27 | 0.17–0.36 | 2.5 | 2.0–4.1 | −0.37 | −0.56 to −0.31 |
| All | 601 | 0.21 | 0.14–0.28 | 3.3 | 2.4–5.0 | −0.28 | −0.45 to −0.20 |
Slope: ΔHPV copies/cell/day; VDT: viral doubling time; IQR: interquartile range.
Fig 3.
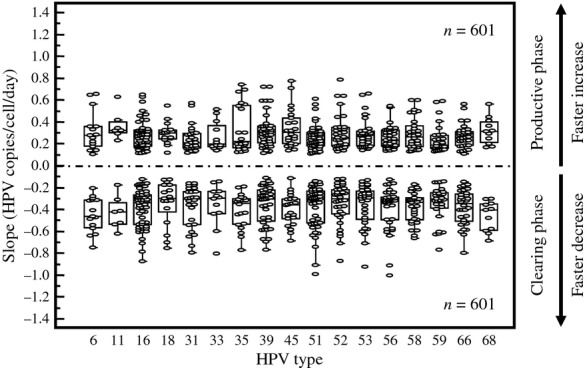
Slope in Productive and Clearing Phase of Transient Infections by HPV type.
For all HPV types, the median viral doubling time was 3.3 days (IQR 2.4–5.0). There was no difference in median viral doubling time for the different HPV types (Table1).
HPV Infections progressing to CIN3+
The database search revealed 1946 cases of CIN3+. Only 244 cases showed three or more virologic measurements before the histologic diagnosis, whereas only 138 (seven with cervical cancer and 131 with CIN3) were infected by a single HPV type and untreated for cervical disease during these measurements (Fig.1B). The median age of women sampled was 33 years (IQR 28–43 years) with no significant age difference between the groups infected with different HPV types.
The median viral load just before detection of CIN3+ was 2094 HPV copies/cell (IQR 548–11 642 HPV copies/cell). The viral load was not significantly higher in cancer cases (71191 HPV copies/cell) compared with CIN3 cases (36913 HPV copies/cell). In 117 of the 138 cases (84.8%), before CIN3+ detection, at least three viral load measurements followed a rising straight line with a median R² of 0.984 (IQR 0.951–0.996) and a median linear slope of 0.0028 HPV copies/cell/day (IQR 0.0020–0.0036) (Table2). The evolution of the viral loads over time for the 24 progressive cases with at least four viral load measurements on a rising straight line is shown in Figure4.
Table 2.
Type-specific Median HPV Slope and VDT in HPV Infections Leading to CIN3+
| HPV type | n | Slope (≥3 points) | R² | VDT CIN3+ (days) | Constant Rate of Cell Division P | n | Slope (2 points) | n | Slope (2 points and ≥3 points) |
|---|---|---|---|---|---|---|---|---|---|
| 6 | 1 | 0.0026 | 0.999 | 263.5 | 0.0061 | 1 | 0.0026 | ||
| 11 | ND | ||||||||
| 16 | 48 | 0.0029 | 0.966 | 289.0 | 0.0069 | 13 | 0.0034 | 61 | 0.0030 |
| 18 | 4 | 0.0019 | 0.938 | 408.5 | 0.0046 | 4 | 0.0019 | ||
| 31 | 14 | 0.0025 | 0.977 | 336.3 | 0.0061 | 5 | 0.0029 | 19 | 0.0026 |
| 33 | 14 | 0.0032 | 0.962 | 276.8 | 0.0069 | 1 | 0.0013 | 15 | 0.0031 |
| 35 | 3 | 0.0025 | 0.938 | 304.6 | 0.0062 | 3 | 0.0025 | ||
| 39 | 4 | 0.0028 | 0.979 | 291.7 | 0.0063 | 4 | 0.0027 | ||
| 45 | 1 | 0.0018 | 1.000 | 397.1 | 0.0040 | 1 | 0.0018 | ||
| 51 | 7 | 0.0032 | 0·983 | 249.4 | 0.0074 | 1 | 0.0037 | 8 | 0.0032 |
| 52 | 9 | 0.0033 | 0.982 | 244.0 | 0.0081 | 1 | 0.0053 | 10 | 0.0035 |
| 53 | ND | ||||||||
| 56 | 2 | 0.0038 | 0.953 | 187.7 | 0.0087 | 2 | 0.0038 | ||
| 58 | 8 | 0.0034 | 0.948 | 246.0 | 0.0078 | 8 | 0.0034 | ||
| 59 | 1 | 0.0029 | 0.961 | 242.3 | 0.0066 | 1 | 0.0029 | ||
| 66 | 1 | 0.0032 | 0.993 | 213.7 | 0.0075 | 1 | 0.0032 | ||
| 68 | ND | ||||||||
| All | 117 | 0.0029 | 0.984 | 286.3 | 0.0069 | 21 | 0.0035 | 138 | 0.0028 |
Slope: ΔHPV copies/cell/day; VDT: viral doubling time; ND: not detected.
Fig 4.

Evolution of the Viral Load (HPV Copies/Cell) Over Time (in Days) in Cases Developing CIN3+. Circles = viral load measurements. Triangle represents the calculated starting point of the linear increase leading to CIN3+ with viral load of 0.00001 HPV copies/cell. The dotted line represents the least-squares line. X = detection of CIN3+. Only cases with more than three viral load measurements are shown.
The individual viral doubling time for CIN3+ was calculated from the individual mean slopes (n = 117). The mean viral doubling time was 286.3 days, and not significantly different for the different HPV types. In the remaining 21 CIN3+ cases (15.2%), R² was <0.9. In 14 cases, the third from last measured viral load was above the regression line, which could be caused by a coinciding transient infection (Fig.5A). The slope of the straight line between the last two measurements was 0.0037 HPV copies/cell/day (IQR 0.0027–0.0047 HPV copies/cell/day). In seven cases, the second last measured point was above the regression line. The slope of the straight line between the third from last point and the last point was 0.0030 HPV copies/cell/day. There was no difference between the slopes of the two groups. The median slope for these 21 cases was 0.0035 HPV copies/cell/day (IQR 0.0019–0.0051 HPV copies/cell/day), which was not statistically different from the other 117 cases reported above. The median slope for linear (≥3 points) and transient-linear (2 points) infections leading to CIN3+ was 0.0028 HPV copies/cell/day (IQR 0.0020–0.0037 HPV copies/cell/day). The equation for predicting exponential growth in CIN3+ was y (type-specific viral load) = 1E-5 e0·0069x (number of days). Using this equation, the mean calculated time to a diagnosis of the CIN3+ lesion was 9.4 years (SD 4.1 years).
Fig 5.
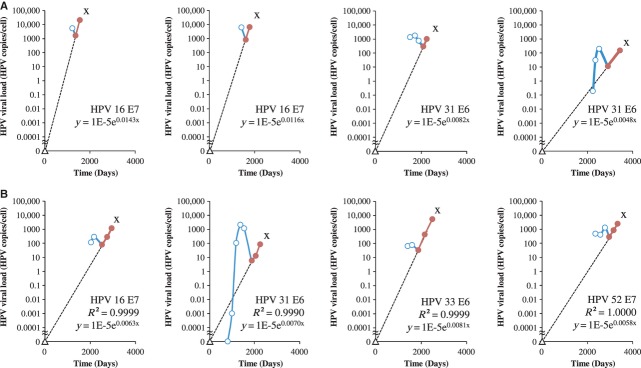
The Hinge Virological Turning Point: Transient Prophase Infections Occurring During a Progressive Linear Phase Increase in Infections Leading to CIN3+. (A) Slope calculated with last two measurements. (B) Slope calculated with last three measurements. Circles represent viral load measurements prior to detection of CIN3+. X = detection of CIN3+. Open circles = measurements during transient phase. Closed circles = measurement in the linear phase with R² > 0.9. Triangle represents the calculated starting point of the linear increase leading to CIN3+ with viral load of 0.00001 HPV copies/cell. Solid line represents the transient course (blue) and the linear course (red) of the infection between the viral load measurements. The dotted line represents the calculated slope before reaching the hinge.
The hinge visualization of a transient prophase during linear persistent infection
In 24 cases from the total group of 138, more than one viral load measurement was available before the linear course preceding CIN3+, showing a transient infection preceding the hinge. The median slope of the clearing phase of transient prophase was −0.0025 HPV copies/cell/day (IQR −0.0040 to −0.0020 HPV copies/cell/day). The differences in slope of the clearing phase between transient infections and infections in a transient prophase but leading to CIN3+ was highly significant (P < .0001). Representative cases that had one or more measurements before the linear phase are shown in Figure5. The differences in slope kinetics between the productive phase of transient infections and infections leading to CIN3+ were highly significant (P < .0001).
Discussion
In this large population-based observational study (291,883 women) on HPV as the primary risk factor for the development of cervical cancer, all cytology leftovers were analysed for the HPV type-specific viral load in an attempt to predict whether an HPV infection is transient or will lead to CIN3+. The number of HPV type-specific E6 or E7 copies adjusted for number of cells was measured. The use of a PCR assay targeting E6 and E7 viral oncogenes avoids the risk of missing a number of L1-negative cases 31. To avoid a possible cytology reading bias, HPV viral load testing was always performed initially 24.
In this study, 601 transient infections and 138 progressing infections with a single HPV type leading to histologically confirmed CIN3+ in untreated women were analysed. For the analysis of the increase and decrease in the viral load, the slope of a straight line between two or more measurement points and the viral doubling time were calculated for each HPV type.
In transient infections, a typical time-dependent course with a steep rise (0.21 HPV copies/cell/day) and decline (−0.28 HPV copies/cell/day), and a very short viral doubling time (3.3 days) was found. This is in accordance with previous studies showing that HPV infection is common in screening but that a large majority of the infections clear rapidly 11,13,16,17,19,23. This quick viral replication is probably the reflection of HPV infecting the basal cell(s) followed by the production of a large number of virions during differentiation and desquamation.
This rapid viral replication in transient infections contrasts with the 100 times slower increase (0.0028 HPV copies/cell/day) found in progressing infections during the linear phase preceding CIN3+ and the much longer viral doubling time (286.3 days). This is consistent with recent studies measuring HPV 16 viral load 13,15,16, and studies showing that high loads may be predictive of the transition of CIN 2-3 to cervical cancer 10,15, or future risk for CIN3+ 9,15. However, others did not find a high viral load to be a clinically useful biomarker 4,11,14. We hypothesize that, during progressing infections leading to CIN3+, the infected basal cell divides with a number of HPV copies inside. This would correspond to an exponential linear growth over time.
The blatant difference in the kinetics of viral replication between transient and persistent infections leading to CIN3+ enables prediction of the clinical outcome of an HPV infection. A steady linear increase with a small slope and long viral doubling time is found in progressive infections and is distinct from the rapid increase followed by a decline in viral load and short viral doubling time in transient infections. In addition, our study showed that this can be applied to the individual slopes of all high-risk HPV types and even low-risk HPV-type HPV 6.
On the basis of the 24 cases with measurements before the linear phase of persistent infections, we hypothesize that these are probably preceded by a transient prophase. The examples in Figure5 illustrate the different phases during HPV infection, i.e. a steeply increasing slope in the productive phase in the case of transient infection(s) and a shallow increasing slope in the case of progressive infection with the hinge moment, at the end of the transient infection. This could, however, be as a result of the relatively short study period, only fully documented in a few cases. This study clearly shows the limitations of a single-point viral load measurement because similar viral loads can be found in the rising and declining parts of transient infections as well as in the progressive infections. A transient prophase might explain why, in 21 cases leading to CIN3+, R² was smaller than 0.9. It seems reasonable to assume that in 14 cases the third from last measurement and in seven cases the second from last measurement were all positively influenced by an underlying transient infection.
In conclusion, the measurement of viral load at different time-points enables assessment of the kinetics of HPV infections over time. In transient infections, slopes (increase/decrease) are 100 times steeper compared with the steadily increasing slopes found in infections leading to CIN3+. This difference might enable the prediction of progression towards CIN3+ and could be applied as a triage tool for HPV-positive women in primary HPV screening. Further studies investigating the dynamic of viral load in patients with regression of CIN could contribute to the understanding of HPV infection.
Acknowledgments
The authors thank Drs Gaelle Boulet and Johan Verheaghe for their invaluable comments on the article. Technical editing of the article was provided by Touch Medical Communications. This work was supported in part by Biokring II vzw (R11-007).
Conflict of interest
The authors confirm that there are no conflicts of interest.
References
- Bosch FX, Lorincz A, Munoz N, et al. The causal relation between human papillomavirus and cervical cancer. J Clin Pathol. 2002;55:244–65. doi: 10.1136/jcp.55.4.244. [DOI] [PMC free article] [PubMed] [Google Scholar]
- Walboomers JM, Jacobs MV, Manos MM, et al. Human papillomavirus is a necessary cause of invasive cervical cancer worldwide. J Pathol. 1999;189:12–9. doi: 10.1002/(SICI)1096-9896(199909)189:1<12::AID-PATH431>3.0.CO;2-F. [DOI] [PubMed] [Google Scholar]
- Nobbenhuis MA, Walboomers JM, Helmerhorst TJ, et al. Relation of human papillomavirus status to cervical lesions and consequences for cervical-cancer screening: a prospective study. Lancet. 1999;354:20–5. doi: 10.1016/S0140-6736(98)12490-X. [DOI] [PubMed] [Google Scholar]
- Woodman CB, Collins SI, Young LS. The natural history of cervical HPV infection: unresolved issues. Nat Rev Cancer. 2007;7:11–22. doi: 10.1038/nrc2050. [DOI] [PubMed] [Google Scholar]
- Pett M, Coleman N. Integration of high-risk human papillomavirus: a key event in cervical carcinogenesis? J Pathol. 2007;212:356–67. doi: 10.1002/path.2192. [DOI] [PubMed] [Google Scholar]
- Arbyn M, Sasieni P, Meijer CJ, et al. Chapter 9: clinical applications of HPV testing: a summary of meta-analyses. Vaccine. 2006;24:S3-78-S3/89. doi: 10.1016/j.vaccine.2006.05.117. [DOI] [PubMed] [Google Scholar]
- Cuzick J, Clavel C, Petry KU, et al. Overview of the European and North American studies on HPV testing in primary cervical cancer screening. Int J Cancer. 2006;119:1095–101. doi: 10.1002/ijc.21955. [DOI] [PubMed] [Google Scholar]
- Ronco G, Giorgi-Rossi P, Carozzi F, et al. Efficacy of human papillomavirus testing for the detection of invasive cervical cancers and cervical intraepithelial neoplasia: a randomised controlled trial. Lancet Oncol. 2010;11:249–57. doi: 10.1016/S1470-2045(09)70360-2. [DOI] [PubMed] [Google Scholar]
- Moberg M, Gustavsson I, Gyllensten U. Type-specific associations of human papillomavirus load with risk of developing cervical carcinoma in situ. Int J Cancer. 2004;112:854–9. doi: 10.1002/ijc.20480. [DOI] [PubMed] [Google Scholar]
- Ho CM, Chien TY, Huang SH, et al. Integrated human papillomavirus types 52 and 58 are infrequently found in cervical cancer, and high viral loads predict risk of cervical cancer. Gynecol Oncol. 2006;102:54–60. doi: 10.1016/j.ygyno.2005.11.035. [DOI] [PubMed] [Google Scholar]
- Constandinou-Williams C, Collins SI, Roberts S, et al. Is human papillomavirus viral load a clinically useful predictive marker? A longitudinal study. Cancer Epidemiol Biomarkers Prev. 2010;19:832–7. doi: 10.1158/1055-9965.EPI-09-0838. [DOI] [PMC free article] [PubMed] [Google Scholar]
- Gravitt PE, Kovacic MB, Herrero R, et al. High load for most high risk human papillomavirus genotypes is associated with prevalent cervical cancer precursors but only HPV16 load predicts the development of incident disease. Int J Cancer. 2007;121:2787–93. doi: 10.1002/ijc.23012. [DOI] [PMC free article] [PubMed] [Google Scholar]
- Xi LF, Hughes JP, Castle PE, et al. Viral load in the natural history of human papillomavirus type 16 infection: a nested case-control study. J Infect Dis. 2011;203:1425–33. doi: 10.1093/infdis/jir049. [DOI] [PMC free article] [PubMed] [Google Scholar]
- Xi LF, Hughes JP, Edelstein ZR, et al. Human Papillomavirus (HPV) type 16 and type 18 DNA Loads at Baseline and Persistence of Type-Specific Infection during a 2-year follow-up. J Infect Dis. 2009;200:1789–97. doi: 10.1086/647993. [DOI] [PMC free article] [PubMed] [Google Scholar]
- Van DM, Snijders PJ, Schrijnemakers HF, et al. Human papillomavirus 16 load in normal and abnormal cervical scrapes: an indicator of CIN II/III and viral clearance. Int J Cancer. 2002;98:590–5. doi: 10.1002/ijc.10232. [DOI] [PubMed] [Google Scholar]
- Monnier-Benoit S, Dalstein V, Riethmuller D, et al. Dynamics of HPV16 DNA load reflect the natural history of cervical HPV-associated lesions. J Clin Virol. 2006;35:270–7. doi: 10.1016/j.jcv.2005.09.001. [DOI] [PubMed] [Google Scholar]
- Marks M, Gravitt PE, Utaipat U, et al. Kinetics of DNA load predict HPV 16 viral clearance. J Clin Virol. 2011;51:44–9. doi: 10.1016/j.jcv.2011.01.011. [DOI] [PMC free article] [PubMed] [Google Scholar]
- Boulet GA, Benoy IH, Depuydt CE, et al. Human papillomavirus 16 load and E2/E6 ratio in HPV16-positive women: biomarkers for cervical intraepithelial neoplasia >or=2 in a liquid-based cytology setting? Cancer Epidemiol Biomarkers Prev. 2009;18:2992–9. doi: 10.1158/1055-9965.EPI-09-0025. [DOI] [PubMed] [Google Scholar]
- Rodriguez AC, Schiffman M, Herrero R, et al. Rapid clearance of human papillomavirus and implications for clinical focus on persistent infections. J Natl Cancer Inst. 2008;100:513–7. doi: 10.1093/jnci/djn044. [DOI] [PMC free article] [PubMed] [Google Scholar]
- Kjaer SK, Frederiksen K, Munk C, et al. Long-term absolute risk of cervical intraepithelial neoplasia grade 3 or worse following human papillomavirus infection: role of persistence. J Natl Cancer Inst. 2010;102:1478–88. doi: 10.1093/jnci/djq356. [DOI] [PMC free article] [PubMed] [Google Scholar]
- Chen HC, Schiffman M, Lin CY, et al. Persistence of Type-Specific Human Papillomavirus Infection and Increased Long-term Risk of Cervical Cancer. J Natl Cancer Inst. 2011;103:1387–96. doi: 10.1093/jnci/djr283. [DOI] [PMC free article] [PubMed] [Google Scholar]
- Kjaer S, Hogdall E, Frederiksen K, et al. The absolute risk of cervical abnormalities in high-risk human papillomavirus-positive, cytologically normal women over a 10-year period. Cancer Res. 2006;66:10630–6. doi: 10.1158/0008-5472.CAN-06-1057. [DOI] [PubMed] [Google Scholar]
- Plummer M, Schiffman M, Castle PE, et al. A 2-year prospective study of human papillomavirus persistence among women with a cytological diagnosis of atypical squamous cells of undetermined significance or low-grade squamous intraepithelial lesion. J Infect Dis. 2007;195:1582–9. doi: 10.1086/516784. [DOI] [PubMed] [Google Scholar]
- Benoy IH. Vanden Broeck D, Ruymbeke MJ et al. Prior knowledge of HPV status improves detection of CIN2+ by cytology screening. Am J Obstet Gynecol. 2011;205(569):e1–7. doi: 10.1016/j.ajog.2011.06.101. [DOI] [PubMed] [Google Scholar]
- Jordan J, Martin-Hirsch P, Arbyn M, et al. European guidelines for clinical management of abnormal cervical cytology, part 2. Cytopathology. 2009;20:5–16. doi: 10.1111/j.1365-2303.2008.00636.x. [DOI] [PubMed] [Google Scholar]
- Jordan J, Arbyn M, Martin-Hirsch P, et al. European guidelines for quality assurance in cervical cancer screening: recommendations for clinical management of abnormal cervical cytology, part 1. Cytopathology. 2008;19:342–54. doi: 10.1111/j.1365-2303.2008.00623.x. [DOI] [PubMed] [Google Scholar]
- Arbyn M, Herbert A, Schenck U, et al. European guidelines for quality assurance in cervical cancer screening: recommendations for collecting samples for conventional and liquid-based cytology. Cytopathology. 2007;18:133–9. doi: 10.1111/j.1365-2303.2007.00464.x. [DOI] [PubMed] [Google Scholar]
- Depuydt CE, Benoy IH, Bailleul EJ, et al. Improved endocervical sampling and HPV viral load detection by Cervex-Brush Combi. Cytopathology. 2006;17:374–81. doi: 10.1111/j.1365-2303.2006.00386.x. [DOI] [PubMed] [Google Scholar]
- Micalessi I, Boulet GA, Bogers JJ, et al. High-throughput detection, genotyping and quantification of the human papillomavirus using real-time PCR. Clin Chem Lab Med. 2011;50:655–61. doi: 10.1515/cclm.2011.835. [DOI] [PubMed] [Google Scholar]
- Schoonjans F, Zalata A, Depuydt CE, et al. MedCalc: a new computer program for medical statistics. Comput Methods Programs Biomed. 1995;48:257–62. doi: 10.1016/0169-2607(95)01703-8. [DOI] [PubMed] [Google Scholar]
- Depuydt CE, Boulet GA, Horvath CA, et al. Comparison of MY09/11 consensus PCR and type-specific PCRs in the detection of oncogenic HPV types. J Cell Mol Med. 2007;11:881–91. doi: 10.1111/j.1582-4934.2007.00073.x. [DOI] [PMC free article] [PubMed] [Google Scholar]