Abstract
Aim/hypothesis
The release of fatty acids from adipocytes, i.e. lipolysis, is maintained under tight control, primarily by the opposing actions of catecholamines and insulin. A widely accepted model is that insulin antagonises catecholamine-dependent lipolysis through phosphorylation and activation of cAMP phosphodiesterase 3B (PDE3B) by the serine-threonine protein kinase Akt (protein kinase B). Recently, this hypothesis has been challenged, as in cultured adipocytes insulin appears, under some conditions, to suppress lipolysis independently of Akt.
Methods
To address the requirement for Akt2, the predominant isoform expressed in classic insulin target tissues, in the suppression of fatty acid release in vivo, we assessed lipolysis in mice lacking Akt2.
Results
In the fed state and following an oral glucose challenge, Akt2 null mice were glucose intolerant and hyperinsulinaemic, but nonetheless exhibited normal serum NEFA and glycerol levels, suggestive of normal suppression of lipolysis. Furthermore, insulin partially inhibited lipolysis in Akt2 null mice during an insulin tolerance test (ITT) and hyperinsulinaemic–euglycaemic clamp, respectively. In support of these in vivo observations, insulin antagonised catecholamine-induced lipolysis in primary brown fat adipocytes from Akt2-deficient nice.
Conclusion
These data suggest that suppression of lipolysis by insulin in hyperinsulinaemic states can take place in the absence of Akt2.
Keywords: Adipose tissue, Akt2, Insulin, Lipolysis
Introduction
One of the strongest evolutionary pressures for fitness has been the drive to store nutrients effectively for use during times of food unavailability. The most efficient storage form for energy is triacylglycerol (TG), which consists of three fatty-acyl-groups linked to a glycerol backbone and accumulates in a specialised cell type—the adipocyte, during times of abundance. White adipose tissue stores TG during periods of energy excess such as feeding, and hydrolyses TG to NEFA and glycerol (lipolysis) for use by other tissues during times of energy need such as fasting and exercise. Multiple hormonal, neural and substrate-driven inputs exert exquisite control over this process. In recent years, with its increasing prevalence, obesity has stressed the system beyond compensatory control, such that unrestrained lipolysis leads to increased circulating NEFA and excessive neutral lipid accumulation in non-adipocyte cells. This has been implicated as causal in muscle and liver insulin resistance, and development of type 2 diabetes and its related diseases [1, 2]. Understanding the mechanisms by which the adipocyte integrates multiple inputs to control lipolysis is of great importance.
Lipolysis is controlled predominantly by insulin and both circulating and locally secreted catecholamines. During fasting, catecholamines bind to beta-adrenergic receptors to activate adenylate cyclase, increase cAMP synthesis and stimulate protein kinase A (PKA), thereby initiating the lipolytic cascade [3]. Over the years, a consensus has emerged as to how insulin suppresses lipolysis. Insulin via its canonical phosphatidyl inositol 3′ kinase (PI3K) pathway activates Akt (also known as protein kinase B), which then phosphorylates and activates various phosphodiesterase (PDE) isoforms, most notably PDE3B. The active PDE degrades cAMP, which reduces PKA activity and antagonises lipolysis [4–8]. Akt is a PI3K-dependent serine/threonine kinase that mediates many metabolic actions of insulin [9]. The Akt kinase family consists of three isoforms, Akt1, Akt2 and Akt3, each encoded by a separate gene. Deletion of Akt2 in all tissues results in mice that are insulin resistant and glucose intolerant [10, 11]. Consistent with these studies, a mutation in the kinase domain of Akt2 has been associated with insulin resistance and diabetes in humans [12].
Though the role of Akt2 in regulation of adipocyte glucose metabolism has been studied in some detail, little is known about whether this isoform mediates the action of insulin on lipolysis. Recently, our laboratory provided in vitro evidence suggesting that under some conditions insulin could regulate lipolysis independently of Akt. [13]. We hypothesised that Akt is not required for insulin’s regulation of lipolysis in vivo. In this study, we considered the regulation of lipolysis in vivo in mice deficient for Akt2.
Methods
Animals
The generation and metabolic phenotyping of Akt2 null mice was carried out by the Trangenic Core at the University of Pennsylvania and have been described previously [10, 14]. Wild-type C57Bl/6J mice (Jackson laboratory, Bar Harbor, Maine, USA) were used as controls. Male mice (10–12-weeks old) were used for experiments. Mice were maintained on standard chow diet (laboratory rodent diet 5001, LabDiet, St Louis, MO, USA) and 12 h light:dark cycle (07:00: 19:00 hours) in a barrier facility. The protocols were approved by the University of Pennsylvania IACUC in accordance with NIH guidelines.
Body composition studies
Nuclear magnetic resonance (NMR) spectroscopy (Echo MRI, Houston, TX, USA) was performed by Penn Diabetes Research Center mouse core. For inguinal and epididymal fat pads weights, organs were removed from randomly fed mice after cervical dislocation.
Fasting-refeeding experiment
Mice were fasted overnight for 16 h and refed, starting at 09:00 hours. Blood for serum insulin, glycerol and NEFA levels was collected at 0 and 120 min by tail bleeding.
OGTT
Mice were fasted overnight for 16 h. D-glucose (2 g/kg) was administered by oral gavage. Blood glucose was monitored at 0, 15, 30, 60 and 120 min after gavage by tail bleeding. Blood for serum insulin, glycerol and NEFA levels was collected at 0 and 15 min.
Insulin tolerance test
Mice were fasted overnight for 16 h. Soluble human insulin (Novolin, Novo-Nordisc, Plainsboro, NJ, USA) at 1 U/kg was administered by i.p. injection. Glucose was monitored by tail bleeding at 0, 15, 30, 45 and 60 min using a glucometer. Blood for serum insulin, glycerol and NEFA levels was collected at 0 and 30 min by tail bleeding.
Hyperginsulinaemic–euglycaemic clamp
Mouse clamp studies were performed in mice fasted overnight for 16 h. Jugular vein catheters were implanted in mice 5 days prior to the clamp study. Mice were infused with soluble human insulin (Novolin, Novo-Nordisc) at constant rate of 5 mU/kg/min for 2 h. A 50% glucose solution was infused as needed to maintain blood glucose levels at 5.6–8.3 mmol/l. Blood glucose levels were monitored by tail bleeding every 10 min. Blood for serum insulin, glycerol and NEFA levels was collected at 0 and 120 min by tail bleeding.
Biochemical measurements
Blood glucose was measured with a glucometer (One Touch Ultra, LifeScan, Johnson and Johnson, NJ, USA). Serum insulin was measured with an ELISA kit (Ultra Sensitive Mouse Insulin ELISA Kit, Crystal Chem., Downers Grove, IL, USA). Glycerol and NEFA levels for in vivo and cell culture experiments, and serum TG and β-hydroxybutyrate were measured using colorimetric assay kits (Free Glycerol Reagent, Sigma, St Louis, MO, USA; NEFA-HR kit, Wako Life Sciences, Richmond, VA, USA; Infinity TG, Thermo Scientific, Rockfors, IL, USA; and β-hydroxybutyrate LiquiColor kit, StanbioLaboratories, Boerne, TX, USA). Adipokine measurements were performed by Biomarkers Core at the University of Pennsylvania (MILLIPLEX MAP Mouse Serum Adipokine Panel, MILLIPLEX MAP Mouse Adiponectin - Single Plex, EMD Millipore, Merck, Darmstadt, Germany).
Antibodies and inhibitors
Antibodies directed towards Akt1, Akt2 and Akt3 were obtained from Cell Signaling Technology (Beverly, MA, USA). The tubulin antibody was obtained from Sigma. The Akt inhibitor AktiVIII was from EMD Chemicals (Gibbstown, NJ, USA) and the PI3K inhibitor PI-103 was from Cayman Chemical Company (Ann Arbor, MI, USA).
Cell isolation and culture
Brown pre-adipocytes were isolated and cultured as described previously [15]. Brown adipose tissue from newborn mice was minced and incubated in Collagenase D 1.5 U/ml and Dispase II 2.4 U/ml (Roche Diagnostics, Indianapolis, IN, USA) in DMEM (Invitrogen Corporation, Grand Island, NY, USA) for 40 min at 37°C. The digested tissue was filtered and centrifuged. Cells were suspended (DMEM/F12 containing 10% FBS, 20 mmol/l HEPES, 1% penicillin/streptomycin and 1:1000 Primocin), seeded and incubated at 37°C and 5% CO2 for 48 h. Cells were passed at the 48 h time point. Forty-eight to 72 h later, upon reaching 90% confluence, induction media supplemented with 20 nmol/l insulin, 1 nmol/l T3, 500 nmol/l dexamethasone, 0.5 mmol/l isobutylmethylxanthine and 1 nmol/l rosiglitazone were added to the cells. Cells were maintained in 20 nmol/l insulin and 1 nmol/l T3 for 4–6 days until exhibiting fully differentiated adipocyte phenotype with accumulation of multilocular fat droplets. All experiments were performed at days 6–8 following induction.
Glycerol and NEFA release assay
These assays were performed as described previously [13]
2-Deoxyglucose-uptake assay
Serum-starved cells were assayed as described previously [13], with the following modifications: 2-deoxyglucose uptake assays were performed in parallel with glycerol and NEFA release assays. Cells were incubated for 15 min at 37°C in 450 μl of KRP/0.2% (Kreb’s Ringer Phosphate [KRP] buffer: 136 mmol/l NaCl, 4.7 mmol/l KCl, 10 mmol/l NaPO4 pH 7.4, 0.9 mmol/l MgSO4 and 0.9 mmol/l CaCl2) alone, supplemented with 100 nmol/l insulin or with 10 μmol/l cytochalasin B (Sigma) to determine background glucose uptake levels. Fifty microlitres of 1 mmol/l 2-deoxyglucose and 37,000 Bq/ml [3H]-2-deoxyglucose were added to cells for a final 15 min incubation. Glucose uptake, measured by radioactivity, was normalised to total protein content. Cytochalasin B values were subtracted from all values.
Immunoblots
Cell culture lysates were prepared and blotted as described previously [13].
Statistics
All data are presented as means ± SEM. Data were analysed using an unpaired Student’s t test with two-tailed analysis or two-way ANOVA followed by Bonferroni post hoc test.
Results
Akt2 null mice have a mild reduction in adiposity but equivalent body weight and circulating levels of adipokines compared with wild-type mice
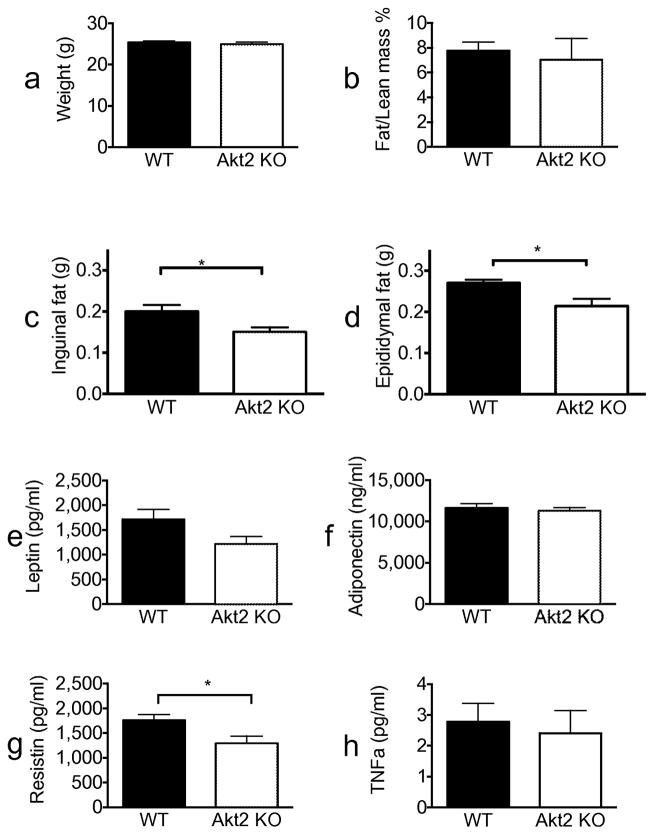
Akt is a critical mediator of the metabolic actions of insulin in liver, adipose tissue and muscle [16]. Of the three isoforms found in mammals, Akt2 is most highly expressed in insulin-responsive tissues. Akt2-deficient mice exhibit glucose intolerance and a diabetes-mellitus-like syndrome [10, 11]. To assess the role of Akt2 in anti-lipolysis in vivo, we studied its regulation in Akt2 null mice. We hypothesised that if Akt2 is critical for insulin’s suppression of lipolysis, deletion of this isoform would resemble other mouse models with impairment in the regulation of lipolysis (e.g. perilipin knockout [KO] mice), which showed more than 50% reduced fat mass [17, 18]. We found that Akt2 null mice had the same weight as wild-type mice and had a normal body composition as measured by NMR (Fig. 1a,b). However, these mice displayed a modest decrease in inguinal and epididymal fat pad weight compared with wild-type mice (Fig. 1c,d), suggesting mild impairment in regulation of fat storage.
Fig. 1.
Akt2 null mice have mildly reduced adiposity and equivalent levels of adipokines to wild-type mice. All experiments were done in randomly fed, 10–12-week old, wild-type (black bars) or Akt2 null (white bars) male mice. (a) Weight in grams, n=19 for both genotypes. (b) Fat/lean mass % as measured by NMR, n=5 for both genotypes. (c) Inguinal fat and (d) epididymal fat pad weights in grams, n=5 for both genotypes. (e) Serum leptin, (f) adiponectin, (g) resistin and (h) TNF-α levels, n=19 for both genotypes. Data are expressed as means ± SEM. *p<0.05, as indicated. WT, wild-type
In addition to its role as the main storage depot for TG, adipose tissue is an active endocrine organ secreting cytokines, known as adipokines. Since we observed a slight decrease in fat mass, we assessed the levels of several important adipokines of Akt2 null mice. There were no differences in leptin, adiponectin or TNF-α levels, but serum resistin levels were slightly decreased in Akt2 null mice (Fig. 1e–h). These data suggest that Akt2 in largely dispensable for fat storage and adipokine secretion in adipose tissue.
Akt2 null mice are glucose intolerant and hyperinsulinaemic but have normal regulation of lipolysis upon feeding and oral administration of glucose
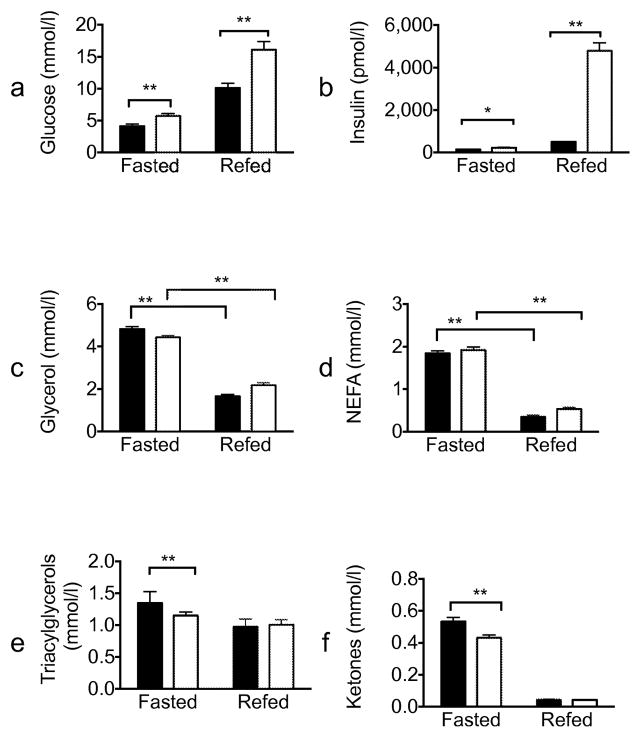
Akt2 null mice have been reported to be glucose intolerant [10, 11]; however, the effect of Akt2 deletion on insulin-mediated regulation of lipolysis in vivo has not been described. To test whether Akt2 is required for insulin inhibition of lipolysis under physiological conditions, we measured serum metabolites in mice refed after an overnight fast (Fig. 2). As expected, Akt2 null mice displayed significantly higher serum glucose and insulin levels both during fasting and refed states (Fig. 2a,b). However, under the same conditions, serum glycerol and NEFA levels were indistinguishable from wild-type mice, suggesting a difference in the dependence on Akt2 for insulin-stimulated glucose uptake in muscle and the suppression of lipolysis in adipocytes. (Fig. 2c,d). Akt2 null mice had slightly reduced levels of serum TG and ketones bodies in the fasting state, but these responded normally to refeeding (Fig. 2e,f).
Fig. 2.
Altered glucose homeostasis with normal suppression of lipolysis in refed Akt2 null mice. Wild-type (black bars) or Akt2 null (white bars) male mice, 10–12 weeks old, were fasted overnight (16 h) and refed for 2 h. Serum levels of (a) glucose (n=20), (b) insulin (n=20), (c) glycerol (n=20), (d) NEFA (n=10), (e) TG (n=9–10) and (f) ketones (n=9–10) were measured and expressed as means ± SEM. *p<0.05, **p<0.01, as indicated. WT, wild-type
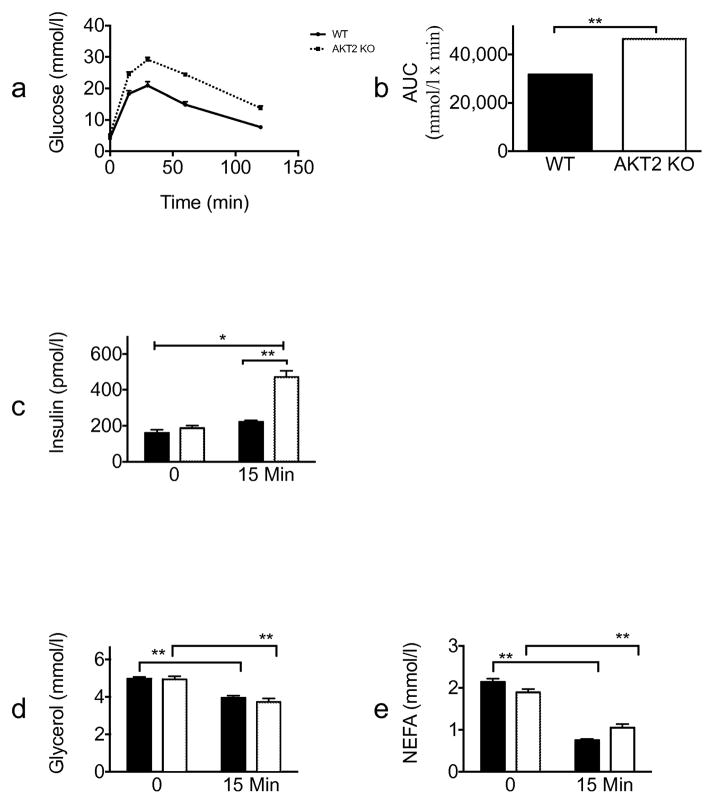
We next performed an OGTT. Consistent with the refeeding experiment and prior published studies [10], 15 min after an oral glucose load, blood glucose and serum insulin levels were significantly higher in Akt2 null compared with wild-type mice; however, glycerol and NEFA levels decreased to the same degree in mice of both genotypes (Fig. 3). Taken together, these data show that Akt2 is more critical to insulin action on glucose metabolism than insulin’s regulation of lipolysis.
Fig. 3.
Akt2 null mice are glucose intolerant but have normal suppression of lipolysis. Wild-type (black lines/black bars [n=20]) or Akt2 null (dotted lines/white bars [n=14]), male mice, 10–12 weeks old, were fasted overnight (16 h). D-glucose (2 g/kg) was administered orally to conscious mice. (a) Blood glucose levels were sampled at the indicated times. (b) AUC of the glucose response. Serum levels of (c) insulin, (d) glycerol and (e) NEFA were sampled at baseline and at 15 min. Data are expressed as means ± SEM. *p<0.05, **p<0.01. WT, wild-type
Inhibition of lipolysis during insulin tolerance test and euglycaemic clamp in Akt2 null mice
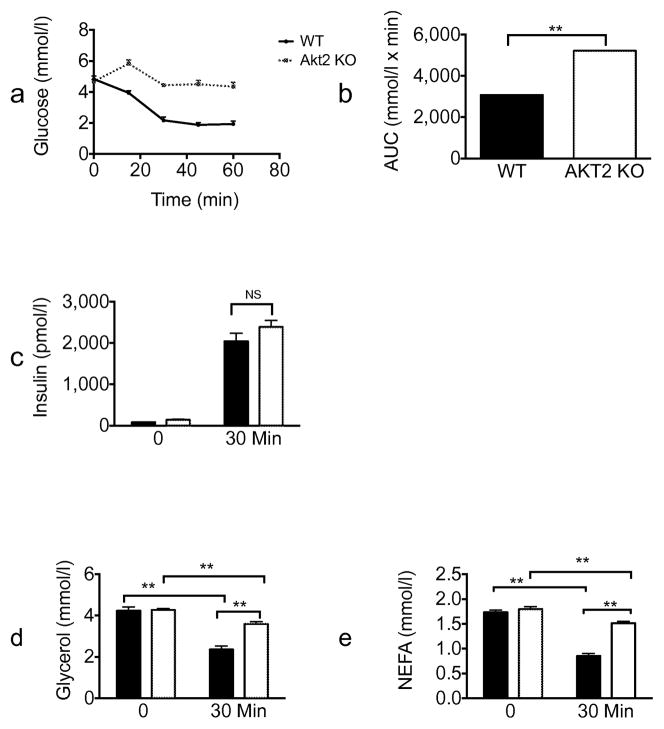
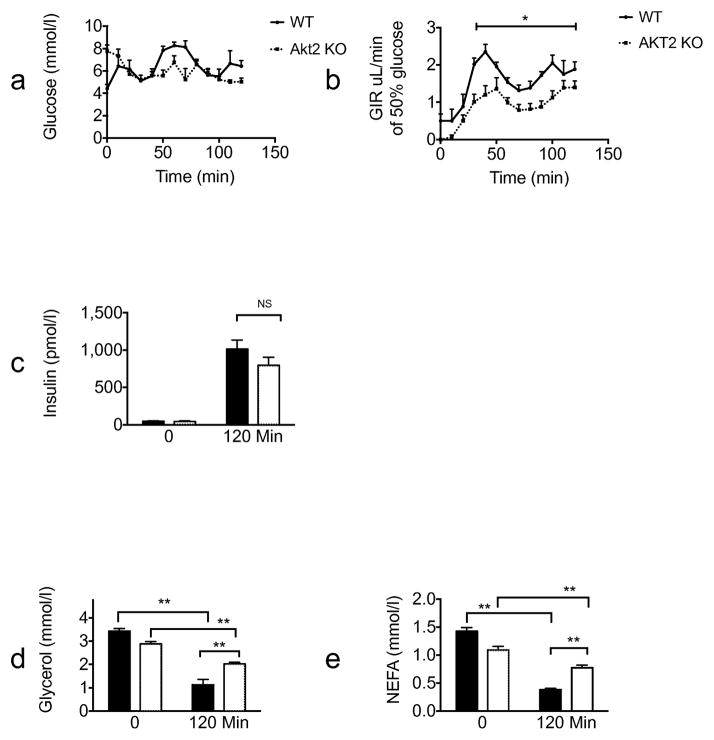
In both the fasting/refeeding and oral glucose tolerance experiments described above, lipolysis was inhibited in Akt2 null mice to the same extent as in wild-type mice; however, higher insulin levels in KO animals complicate interpretation of these results. To address this concern, we performed an insulin tolerance test (ITT). Consistent with previous studies [10], Akt2 deficiency resulted in an impaired hypoglycaemia response to injected insulin (Fig. 4a) Glucose levels at all time points measured and AUC were significantly higher for Akt2 null compared with wild-type mice. (Fig. 4a,b). Equivalent insulin levels were achieved in Akt2 null and wild-type mice (Fig. 4c). Serum glycerol and NEFA levels were reduced substantially 30 min after i.p. insulin injection in both genotypes, though the levels decreased to a lesser extent in Akt2 null mice compared with wild-type mice. (Fig. 4d,e). To address this issue further, we infused Akt2 null and control mice, with insulin and glucose under conditions that maintained blood glucose concentrations at physiological levels (Fig. 5). When glucose was maintained at 5.6–8.3 mmol/l, the glucose infusion rate was significantly lower in Akt2 null mice compared with wild-type mice, indicating insulin resistance (Fig. 5a,b). At the end of the 2 h clamp, when insulin levels of Akt2 null mice were comparable with those of wild-type mice (Fig. 5c), serum glycerol and NEFA levels were reduced substantially in both genotypes, but again to a lesser degree in Akt2 null mice (Fig. 5d,e). These data indicate that signalling through Akt2 contributes to but is not required for the regulation of lipolysis by insulin.
Fig. 4.
Insulin partially inhibits lipolysis in Akt2 null mice after i.p. insulin injection. Wild-type (black line/black bars [n=10]) or Akt2 null (dotted line/white bars [n=10]) male mice, 10–12 weeks old, were fasted overnight (16 h). Insulin (1 U/kg) was administered by i.p. injection to conscious mice. (a) Blood glucose levels were sampled at the indicated times. (b) AUC of the glucose response. Serum levels of (c) insulin (d) glycerol and (e) NEFA were sampled before the injection and at 30 min. Data are expressed as means ± SEM. **p<0.01, as indicated. WT, wild-type
Fig. 5.
Akt2 null mice show selective insulin resistance by euglycaemic clamp. Wild-type (black lines/black bars [n=6]) or Akt2 null (dotted lines/white bars [n=8]), male mice, 10–12 weeks old, were fasted overnight (16 h). A hyperinsulinaemic–euglycaemic clamp procedure was conducted in conscious, unanaesthetised mice with a primed-continuous infusion of insulin (5 mU kg−1 min−1) and a variable infusion of 50% glucose to maintain euglycaemia. (a) Glucose levels during the clamp, (b) glucose infusion rate during the clamp, (c) insulin, (d) glycerol and (e) NEFA levels at baseline and at the end of the clamp were measured. Data are expressed as means ± SEM. *p<0.05, **p<0.01, as indicated. GIR, glucose infusion rate; WT, wild-type
Insulin inhibits isoprenaline-induced lipolysis in Akt2 deficient brown adipocytes
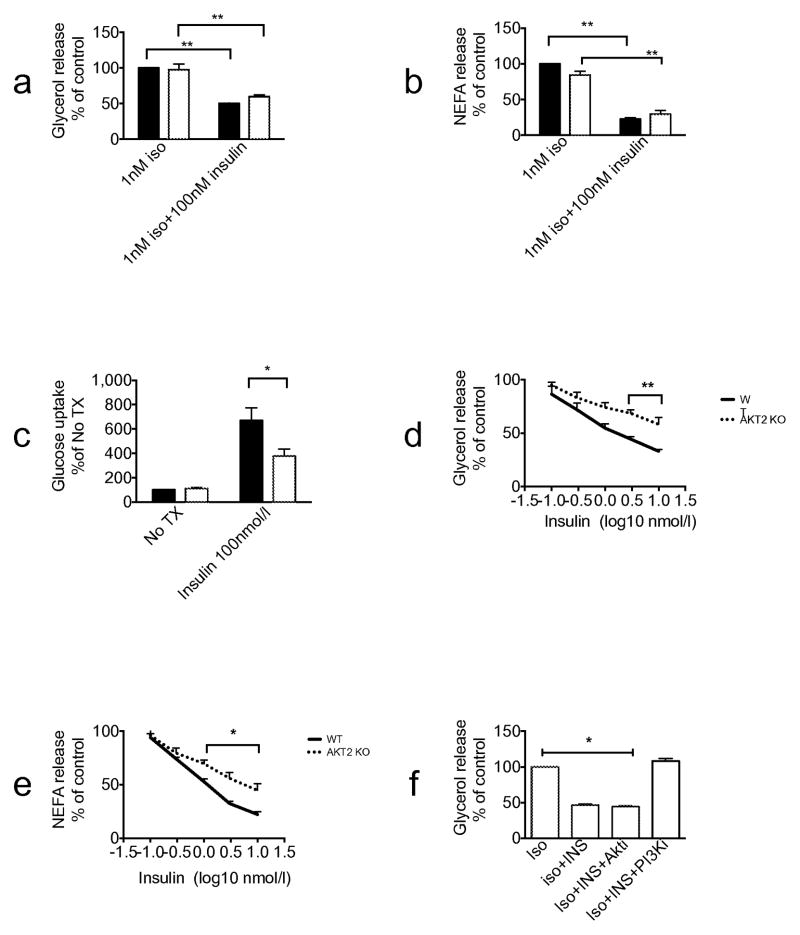
To investigate further the hypothesis that Akt2 is not required for the insulin regulation of lipolysis, we studied it in primary cells. Pre-adipocytes derived from brown adipose tissue were differentiated into brown adipocytes as described in Methods. Both Akt2 null and wild-type pre-adipocytes differentiated into mature adipocytes equally well. A supra-maximal concentration of insulin (100 nmol/l) completely blocked the increase in lipolysis measured by glycerol or NEFA release in response to 1 nmol/l isoprenaline in cells of both genotypes (Fig. 6a,b). Under the same conditions, insulin-stimulated hexose uptake was reduced by about 50% in Akt2 null brown adipocytes (Fig. 6c). At more physiological concentrations of insulin, there was a decrease in the ability of insulin to inhibit isoprenaline-dependent glycerol and NEFA release in Akt2 null brown adipocytes (Fig. 6d,e). Interestingly, the ability of insulin to suppress glycerol release was reversed by treatment of brown adipocytes with PI3K but not with the Akt inhibitor (Fig. 6f). These results further support the notion that Akt2 is not an obligatory intermediate in insulin’s inhibition of lipolysis. In Akt2 null brown adipocytes, Akt1 and Akt3 protein levels are comparable with those of wild-type mice (Fig. 7).
Fig. 6.
Insulin inhibits isoprenaline-induced lipolysis in primary brown adipocytes of Akt2 null mice. Primary brown adipocytes were isolated from either wild-type or Akt2 null pups. The cells were treated with 1 nmol/l isoprenaline (Iso) ± 100 nmol/l insulin (INS). (a) Glycerol release assay and (b) NEFA release assay were performed. Data are presented as % of maximal response of wild-type cells to 1 nmol/l isoprenaline. (c) 2-Deoxyglucose uptake assay was performed with no treatment and with 100 nmol/l insulin. Insulin dose-response curves of (d) glycerol and (e) NEFA release were generated using 1 nmol/l isoprenaline stimulation. (f) Glycerol release assay in the presence of 1 nmol/l isoprenaline ± 100 nmol/l insulin ± 20 μmol/l AktiVIII (Akti) ±10 μmol/l PI-103 (PI3Ki). Data are expressed as means ± SEM from 2–4 experiments. *p<0.05, **p<0.01, as indicated. No Tx, no treatment, WT, wild-type
Fig. 7.
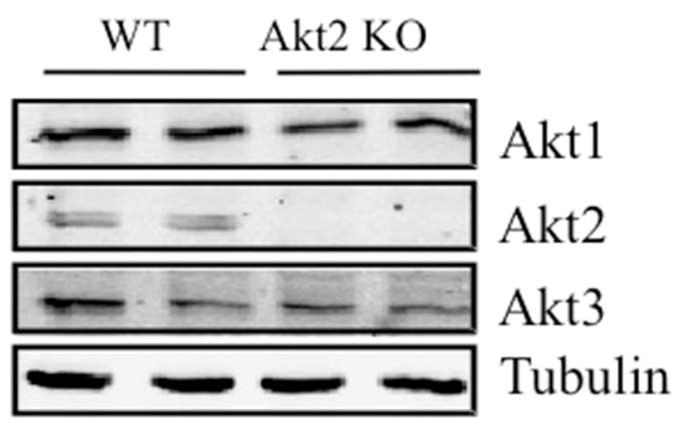
Protein levels of the different Akt isoenzymes. Primary brown adipocytes were lysed and lysates were immunoblotted for Akt1, Akt2, Akt3 and tubulin. The blot was developed using the Licor Odyssey system (Lincoln, NE, USA).
Discussion
One of the most prevalent models to explain development of insulin resistance following obesity is accumulation of neutral lipid in non-adipose insulin target tissues. There is considerable experimental support that sustained, increases in plasma fatty acid concentrations cause insulin resistance [19–23]. A logical step towards understanding the role of deregulated adipocyte lipolysis in the development of metabolic disease is first to understand the molecular mechanisms by which fatty acid release is controlled under normal conditions. Towards this end, we recently reconsidered the generally accepted biochemical pathway for insulin-dependent anti-lipolysis, the Akt-catalysed phosphorylation and activation of PDE3b [4, 5, 7, 24]. Surprisingly, our data suggested that, at least under some conditions, Akt is not an obligate intermediate in insulin’s regulation of lipolysis in vitro [13]. In this study, we have explored the role of Akt2 in mediating insulin’s regulation of lipolysis in vivo. Using a variety of conditions, we found that Akt2 is not required for insulin’s suppression of lipolysis under conditions of hyperinsulinaemia.
Establishing the nature of signalling pathways in vivo is always complicated by potential interactions between organs that lead to cell non-autonomous influences on the phenotype of interest. For this reason, we subjected Akt2 null mice to a number of different assays for insulin-dependent suppression of lipolysis, and conducted experiments in vitro in primary adipocytes. Although in no case did deletion of Akt2 completely block the action of insulin on lipolysis, under some conditions there was a partial inhibition of insulin-dependent anti-lipolysis. The crucial factor in determining this differential responsiveness was the level of circulating insulin. When hyperglycaemia led to elevated serum insulin levels, the suppression of lipolysis appeared comparable in Akt2 KO and control mice. However, when insulin levels were the same in the two groups, as in ITT or clamp, suppression of lipolysis in the Akt2 KO mice was partial. The simplest explanation is that expression of Akt2 is required for maintenance of normal sensitivity to insulin, but is dispensable if the insulin levels can be raised sufficiently. This interpretation was supported by experiments in primary brown adipocytes, in which suppression of lipolysis by maximal concentrations of insulin was comparable in Akt2 null mice brown adipocytes and control, but the dose responsiveness was altered. However, importantly, in all assays, the requirement for Akt2 in insulin-dependent suppression of lipolysis was different from that in the simulation of glucose transport. For example, in primary brown fat cells, there was a 50% reduction in hormone-stimulated glucose uptake in response to a maximal concentration of insulin that completed suppressed lipolysis. Thus, an important conclusion that can be drawn from these studies is that there is a differential requirement for Akt2 in the stimulation of glucose transport compared with the suppression of lipolysis, consistent with the notion that different signalling pathways mediate these physiological responses
One of the complications in interpreting the results of Akt2 deletion in insulin-responsive cells is the presence of other less abundant Akt isoforms. As in cell culture systems, it has not been possible to sustain viability in vivo in the complete absence of all three Akt isoforms [25]. In mammals there are three Akt isoforms; Akt 1–3, each encoded by a separate gene. While Akt1 and Akt3 null mice show impaired fetal growth and brain development, respectively, glucose homeostasis was found unaffected in most models [26–29]. In contrast, mice deficient of Akt2 exhibit glucose intolerance and a diabetes mellitus-like syndrome [10, 11]. We cannot rule out the possibility that the ability of supraphysiological concentrations of insulin to normally antagonise lipolysis in the absence of Akt2 is due to functional rescue byAkt1 and/or Akt3. However, insulin capacity to suppress isoprenaline-induced lipolysis in the presence of the Akt inhibitor in wild-type primary brown adipocytes argues against rescue by Akt1 or Akt3. While at this time we are unable to offer an alternative Akt-independent route by which insulin inhibits lipolysis, it is clear that such pathways are capable of transducing the signal to anti-lipolysis as long as insulin levels are adequate.
Additional evidence for the at least partial dispensability of Akt in the suppression of lipolysis is the relatively normal adiposity in the Akt2 null mice. In other models of unrestricted lipolysis, the fat mass is reduced by 50–70% along with decreased leptin levels [17, 18]. In contrast, experiments presented herein and previous studies, including those from our laboratory, have found only mildly reduced fat mass in Akt2 null mice [11, 30]. Moreover, the mild decrease in adiposity might also be caused by the decreased glucose uptake in adipocytes and substantially reduced de novo hepatic lipogenesis in Akt2 null mice [13, 14, 31, 32].
Considerable attention has been directed recently towards understanding the aetiological factors underlying selective insulin resistance. This term has been applied to the ‘uncoupling’ of hepatic glucose and lipid metabolism in insulin-resistant states, during which insulin is no longer able to shut off glucose production but continues to promote lipogenesis [33–37]. To date, the molecular mechanisms mediating divergent insulin action remain unknown, although several mechanisms have been proposed [35, 38]. Most recently, selective insulin resistance has been extended to cultured adipocytes, suggesting the phenomenon might be more widespread than initially appreciated [13, 39]. Here, we demonstrate a novel form of selective insulin resistance in adipose tissue in vivo. During physiological manipulations such as fasting-refeeding, Akt2-deficient mice displayed significantly higher insulin and glucose—the latter being previously associated with impaired insulin-dependent glucose uptake into muscle and fat—but NEFA and glycerol were regulated normally [10]. Though these experiments have been performed in a genetically modified mouse, it is striking that the phenotype of impaired insulin-dependent glucose uptake with retained TG in adipose tissue very much resembles presentation of an individual with the metabolic syndrome or early type 2 diabetes, perhaps due to hyperinsulinaemic state.
In summary, our data reveal an unexpected divergence in insulin pathways, such that one physiological response, anti-lipolysis, in adipocytes can be preserved, while another, glucose transport, is lost or severely inhibited in the high glucose/high insulin state. These findings provide a framework for understanding the development of insulin resistance and uncovering potential therapeutic targets.
Acknowledgments
We relied heavily on the Cores of the Penn Diabetes Center (University of Pennsylvania, Philadelphia, PA, USA).
Funding
This work was supported by NIH grants R01DK093959 (to MJB), F30DK100123 (to ALS) and F32DK884442 (to LMD).
Abbreviations
- ITT
Insulin tolerance test
- KO
Knockout
- NMR
Nuclear magnetic resonance
- PDE
Phosphodiesterase
- PI3K
Phosphatidyl inositol 3′ kinase
- PKA
Protein kinase A
- TG
Triacylglycerol
Footnotes
Contribution statement
SK was involved in the conception and design, acquisition of data, analysis and interpretation of data, drafting the article and final approval of the version to be published. LMD was involved in the acquisition of data, drafting the article, revising it critically and gave final approval of the version to be published. MJE was involved in the acquisition of data, revision of the manuscript, and gave final approval of the version to be published. ALS was involved in analysis and interpretation of data, drafting the article, revising it critically and gave final approval of the version to be published. QC was involved in the acquisition of data, revision of the manuscript and gave final approval of the version to be published. BM was involved in the acquisition of data, revision of the manuscript and gave final approval of the version to be published. MJB was involved in the conception and design, revising the manuscript critically and gave final approval of the version to be published. SK is the guarantor of this work.
Duality of interest
The authors declare that there is no duality of interest associated with this manuscript.
References
- 1.Jenkins AB, Storlien LH, Chisholm DJ, Kraegen EW. Effects of nonesterified fatty acid availability on tissue-specific glucose utilization in rats in vivo. The Journal of clinical investigation. 1988;82:293–299. doi: 10.1172/JCI113586. [DOI] [PMC free article] [PubMed] [Google Scholar]
- 2.Samuel VT, Petersen KF, Shulman GI. Lipid-induced insulin resistance: unravelling the mechanism. Lancet. 2010;375:2267–2277. doi: 10.1016/S0140-6736(10)60408-4. [DOI] [PMC free article] [PubMed] [Google Scholar]
- 3.Ahmadian M, Duncan RE, Sul HS. The skinny on fat: lipolysis and fatty acid utilization in adipocytes. Trends in endocrinology and metabolism: TEM. 2009;20:424–428. doi: 10.1016/j.tem.2009.06.002. [DOI] [PMC free article] [PubMed] [Google Scholar]
- 4.Ahmad F, Lindh R, Tang Y, Weston M, Degerman E, Manganiello VC. Insulin-induced formation of macromolecular complexes involved in activation of cyclic nucleotide phosphodiesterase 3B (PDE3B) and its interaction with PKB. The Biochemical journal. 2007;404:257–268. doi: 10.1042/BJ20060960. [DOI] [PMC free article] [PubMed] [Google Scholar]
- 5.Berggreen C, Gormand A, Omar B, Degerman E, Goransson O. Protein kinase B activity is required for the effects of insulin on lipid metabolism in adipocytes. American journal of physiology Endocrinology and metabolism. 2009;296:E635–646. doi: 10.1152/ajpendo.90596.2008. [DOI] [PubMed] [Google Scholar]
- 6.Eriksson H, Ridderstrale M, Degerman E, et al. Evidence for the key role of the adipocyte cGMP-inhibited cAMP phosphodiesterase in the antilipolytic action of insulin. Biochimica et biophysica acta. 1995;1266:101–107. doi: 10.1016/0167-4889(94)00237-9. [DOI] [PubMed] [Google Scholar]
- 7.Kitamura T, Kitamura Y, Kuroda S, et al. Insulin-induced phosphorylation and activation of cyclic nucleotide phosphodiesterase 3B by the serine-threonine kinase Akt. Molecular and cellular biology. 1999;19:6286–6296. doi: 10.1128/mcb.19.9.6286. [DOI] [PMC free article] [PubMed] [Google Scholar]
- 8.Snyder PB, Esselstyn JM, Loughney K, Wolda SL, Florio VA. The role of cyclic nucleotide phosphodiesterases in the regulation of adipocyte lipolysis. Journal of lipid research. 2005;46:494–503. doi: 10.1194/jlr.M400362-JLR200. [DOI] [PubMed] [Google Scholar]
- 9.Taniguchi CM, Emanuelli B, Kahn CR. Critical nodes in signalling pathways: insights into insulin action. Nature reviews Molecular cell biology. 2006;7:85–96. doi: 10.1038/nrm1837. [DOI] [PubMed] [Google Scholar]
- 10.Cho H, Mu J, Kim JK, et al. Insulin resistance and a diabetes mellitus-like syndrome in mice lacking the protein kinase Akt2 (PKB beta) Science. 2001;292:1728–1731. doi: 10.1126/science.292.5522.1728. [DOI] [PubMed] [Google Scholar]
- 11.Garofalo RS, Orena SJ, Rafidi K, et al. Severe diabetes, age-dependent loss of adipose tissue, and mild growth deficiency in mice lacking Akt2/PKB beta. The Journal of clinical investigation. 2003;112:197–208. doi: 10.1172/JCI16885. [DOI] [PMC free article] [PubMed] [Google Scholar]
- 12.George S, Rochford JJ, Wolfrum C, et al. A family with severe insulin resistance and diabetes due to a mutation in AKT2. Science. 2004;304:1325–1328. doi: 10.1126/science.1096706. [DOI] [PMC free article] [PubMed] [Google Scholar]
- 13.Choi SM, Tucker DF, Gross DN, et al. Insulin regulates adipocyte lipolysis via an Akt-independent signaling pathway. Molecular and cellular biology. 2010;30:5009–5020. doi: 10.1128/MCB.00797-10. [DOI] [PMC free article] [PubMed] [Google Scholar]
- 14.Leavens KF, Easton RM, Shulman GI, Previs SF, Birnbaum MJ. Akt2 is required for hepatic lipid accumulation in models of insulin resistance. Cell metabolism. 2009;10:405–418. doi: 10.1016/j.cmet.2009.10.004. [DOI] [PMC free article] [PubMed] [Google Scholar]
- 15.Klein J, Fasshauer M, Ito M, Lowell BB, Benito M, Kahn CR. beta(3)-adrenergic stimulation differentially inhibits insulin signaling and decreases insulin-induced glucose uptake in brown adipocytes. The Journal of biological chemistry. 1999;274:34795–34802. doi: 10.1074/jbc.274.49.34795. [DOI] [PubMed] [Google Scholar]
- 16.Schultze SM, Jensen J, Hemmings BA, Tschopp O, Niessen M. Promiscuous affairs of PKB/AKT isoforms in metabolism. Archives of physiology and biochemistry. 2011;117:70–77. doi: 10.3109/13813455.2010.539236. [DOI] [PubMed] [Google Scholar]
- 17.Martinez-Botas J, Anderson JB, Tessier D, et al. Absence of perilipin results in leanness and reverses obesity in Lepr(db/db) mice. Nature genetics. 2000;26:474–479. doi: 10.1038/82630. [DOI] [PubMed] [Google Scholar]
- 18.Tansey JT, Sztalryd C, Gruia-Gray J, et al. Perilipin ablation results in a lean mouse with aberrant adipocyte lipolysis, enhanced leptin production, and resistance to diet-induced obesity. Proceedings of the National Academy of Sciences of the United States of America. 2001;98:6494–6499. doi: 10.1073/pnas.101042998. [DOI] [PMC free article] [PubMed] [Google Scholar]
- 19.Boden G. Pathogenesis of type 2 diabetes. Insulin resistance. Endocrinology and metabolism clinics of North America. 2001;30:801–815. doi: 10.1016/s0889-8529(05)70216-4. [DOI] [PubMed] [Google Scholar]
- 20.Savage DB, Petersen KF, Shulman GI. Disordered lipid metabolism and the pathogenesis of insulin resistance. Physiological reviews. 2007;87:507–520. doi: 10.1152/physrev.00024.2006. [DOI] [PMC free article] [PubMed] [Google Scholar]
- 21.Kashyap S, Belfort R, Gastaldelli A, et al. A sustained increase in plasma free fatty acids impairs insulin secretion in nondiabetic subjects genetically predisposed to develop type 2 diabetes. Diabetes. 2003;52:2461–2474. doi: 10.2337/diabetes.52.10.2461. [DOI] [PubMed] [Google Scholar]
- 22.Randle PJ, Garland PB, Hales CN, Newsholme EA. The glucose fatty-acid cycle. Its role in insulin sensitivity and the metabolic disturbances of diabetes mellitus. Lancet. 1963;1:785–789. doi: 10.1016/s0140-6736(63)91500-9. [DOI] [PubMed] [Google Scholar]
- 23.Thiebaud D, DeFronzo RA, Jacot E, et al. Effect of long chain triglyceride infusion on glucose metabolism in man. Metabolism: clinical and experimental. 1982;31:1128–1136. doi: 10.1016/0026-0495(82)90163-9. [DOI] [PubMed] [Google Scholar]
- 24.Wijkander J, Landstrom TR, Manganiello V, Belfrage P, Degerman E. Insulin-induced phosphorylation and activation of phosphodiesterase 3B in rat adipocytes: possible role for protein kinase B but not mitogen-activated protein kinase or p70 S6 kinase. Endocrinology. 1998;139:219–227. doi: 10.1210/endo.139.1.5693. [DOI] [PubMed] [Google Scholar]
- 25.Liu X, Shi Y, Birnbaum MJ, et al. Quantitative analysis of anti-apoptotic function of Akt in Akt1 and Akt2 double knock-out mouse embryonic fibroblast cells under normal and stressed conditions. The Journal of biological chemistry. 2006;281:31380–31388. doi: 10.1074/jbc.M606603200. [DOI] [PubMed] [Google Scholar]
- 26.Chen WS, Xu PZ, Gottlob K, et al. Growth retardation and increased apoptosis in mice with homozygous disruption of the Akt1 gene. Genes & development. 2001;15:2203–2208. doi: 10.1101/gad.913901. [DOI] [PMC free article] [PubMed] [Google Scholar]
- 27.Cho H, Thorvaldsen JL, Chu Q, Feng F, Birnbaum MJ. Akt1/PKBalpha is required for normal growth but dispensable for maintenance of glucose homeostasis in mice. The Journal of biological chemistry. 2001;276:38349–38352. doi: 10.1074/jbc.C100462200. [DOI] [PubMed] [Google Scholar]
- 28.Easton RM, Cho H, Roovers K, et al. Role for Akt3/protein kinase Bgamma in attainment of normal brain size. Molecular and cellular biology. 2005;25:1869–1878. doi: 10.1128/MCB.25.5.1869-1878.2005. [DOI] [PMC free article] [PubMed] [Google Scholar]
- 29.Yang ZZ, Tschopp O, Hemmings-Mieszczak M, et al. Protein kinase B alpha/Akt1 regulates placental development and fetal growth. The Journal of biological chemistry. 2003;278:32124–32131. doi: 10.1074/jbc.M302847200. [DOI] [PubMed] [Google Scholar]
- 30.Goncalves MD, Pistilli EE, Balduzzi A, et al. Akt deficiency attenuates muscle size and function but not the response to ActRIIB inhibition. PloS one. 2010;5:e12707. doi: 10.1371/journal.pone.0012707. [DOI] [PMC free article] [PubMed] [Google Scholar]
- 31.Bae SS, Cho H, Mu J, Birnbaum MJ. Isoform-specific regulation of insulin-dependent glucose uptake by Akt/protein kinase B. The Journal of biological chemistry. 2003;278:49530–49536. doi: 10.1074/jbc.M306782200. [DOI] [PubMed] [Google Scholar]
- 32.Wan M, Leavens KF, Saleh D, et al. Postprandial hepatic lipid metabolism requires signaling through Akt2 independent of the transcription factors FoxA2, FoxO1, and SREBP1c. Cell metabolism. 2011;14:516–527. doi: 10.1016/j.cmet.2011.09.001. [DOI] [PMC free article] [PubMed] [Google Scholar]
- 33.Matsumoto M, Pocai A, Rossetti L, Depinho RA, Accili D. Impaired regulation of hepatic glucose production in mice lacking the forkhead transcription factor Foxo1 in liver. Cell metabolism. 2007;6:208–216. doi: 10.1016/j.cmet.2007.08.006. [DOI] [PubMed] [Google Scholar]
- 34.Shimomura I, Matsuda M, Hammer RE, Bashmakov Y, Brown MS, Goldstein JL. Decreased IRS-2 and increased SREBP-1c lead to mixed insulin resistance and sensitivity in livers of lipodystrophic and ob/ob mice. Molecular cell. 2000;6:77–86. [PubMed] [Google Scholar]
- 35.Wu X, Williams KJ. NOX4 pathway as a source of selective insulin resistance and responsiveness. Arteriosclerosis, thrombosis, and vascular biology. 2012;32:1236–1245. doi: 10.1161/ATVBAHA.111.244525. [DOI] [PMC free article] [PubMed] [Google Scholar]
- 36.Biddinger SB, Kahn CR. From mice to men: insights into the insulin resistance syndromes. Annual review of physiology. 2006;68:123–158. doi: 10.1146/annurev.physiol.68.040104.124723. [DOI] [PubMed] [Google Scholar]
- 37.Brown MS, Goldstein JL. Selective versus total insulin resistance: a pathogenic paradox. Cell metabolism. 2008;7:95–96. doi: 10.1016/j.cmet.2007.12.009. [DOI] [PubMed] [Google Scholar]
- 38.Li S, Brown MS, Goldstein JL. Bifurcation of insulin signaling pathway in rat liver: mTORC1 required for stimulation of lipogenesis, but not inhibition of gluconeogenesis. Proceedings of the National Academy of Sciences of the United States of America. 2010;107:3441–3446. doi: 10.1073/pnas.0914798107. [DOI] [PMC free article] [PubMed] [Google Scholar]
- 39.Gonzalez E, Flier E, Molle D, Accili D, McGraw TE. Hyperinsulinemia leads to uncoupled insulin regulation of the GLUT4 glucose transporter and the FoxO1 transcription factor. Proceedings of the National Academy of Sciences of the United States of America. 2011;108:10162–10167. doi: 10.1073/pnas.1019268108. [DOI] [PMC free article] [PubMed] [Google Scholar]


