Abstract
Background
Axonal injury is a key feature of several types of brain trauma and neurological disease. However, in mice and humans, many axons are less than 500 nanometers in diameter which is at or below the resolution of most conventional light microscopic imaging methods. In moderate to severe forms of axon injury, damaged axons become dilated and therefore readily detectible by light microscopy. However, in more subtle forms of injury, the damaged axons may remain undilated and therefore difficult to detect.
New Method
Here we present a method for adapting array tomography for the identification and quantification of injured axons. In this technique, ultrathin (~70 nm) plastic sections of tissue are prepared, labeled with axon injury-relevant antibodies and imaged using conventional epifluorescence.
Results
To demonstrate the use of array-tomography-based methods, we determined that mice that received two closed-skull concussive traumatic brain injury impacts had significantly increased numbers of non-dilated axons that were immunoreactive for non-phosphorylated neurofilament (SMI-32;, a marker of axonal injury), compared to sham mice (1682±628 vs. 339±52 per mm2, p=0.004, one-tailed Mann-Whitney U Test). Tubulin loss was not evident (p=0.2063, one-tailed Mann-Whitney U Test). Furthermore, mice that were subject to more severe injury had a loss of tubulin in addition to both dilated and non-dilated SMI-32 immunoreactive axons indicating that this technique is suitable for analysis of various injury conditions.
Comparison with Existing Method
With array tomography we could detect similar overall numbers of axons as electron microscopy, but accurate diameter measurements were limited to those with diameters > 200 nm. Importantly, array tomography had greater sensitivity for detecting small non-dilated injured axons compared with conventional immunohistochemistry.
Conclusion
Imaging of individual axons and quantification of subtle axonal injury is possible using this array tomography method. This method may be most useful for the assessment of concussive injuries and other pathologies in which injured axons are not typically dilated. The ability to process moderately large volumes of tissue, label multiple proteins of interest, and automate analysis support array tomography as a useful alternative to electron microscopy.
Keywords: Array tomography, axonal injury, traumatic brain injury, neurofilament, tubulin, electron microscopy
1. Introduction
A barrier to analysis of axonal injury in mild traumatic brain injury (TBI) is the ability to resolve small, injured axons by light microscopy. This is due, in large part, to the low signal to noise of very small structures that are at or below the resolution of light microscopy. In humans and macaques, axon diameters within the corpus callosum range between 0.08 to >10 µm (Aboitiz et al., 1992; Lamantia and Rakic, 1990). In rodents, axonal diameter is smaller, typically in the 0.05 to 1 µm range (Kim et al., 1996; Olivares et al., 2001). Following moderately severe traumatic brain injury, swollen axons in corpus callosum can become very large (5 µm or more), and are clearly visible with standard immunohistochemistry using antibodies to amyloid precursor protein (APP) and neurofilaments (Blumbergs et al., 1994; Mac Donald et al., 2007a; Mac Donald et al., 2007b). However, several observations have led us to hypothesize that immunohistochemistry and light microscopy may not reflect the true amount of axonal injury present after TBI, particularly after mild concussive injuries.
Along with others, we have developed a model of concussive traumatic brain injury in mouse that results in pronounced behavioral impairments (Creed et al., 2011; Creeley et al., 2004; DeFord et al., 2002; Kane et al., 2012; Laurer et al., 2001; Longhi et al., 2005; Meehan et al., 2012; Mouzon et al., 2012; Shitaka et al., 2011; Uryu et al., 2002; Zohar et al., 2003). However, the underlying pathology is quite subtle. For example, in our repetitive closed skull traumatic brain injury (rcTBI) model, standard immunohistochemistry techniques including amyloid precursor protein labeling (APP) reveal only occasional axonal varicosities that appear to be largely resolved by 7 days. However, widespread abnormalities are apparent on silver staining and electron microscopy indicates that injured axons are present throughout the ipsilateral corpus callosum and external capsule at 7 days post-injury (Shitaka et al., 2011). These axons display compaction of cytoskeletal elements, organelle accumulation, and axolemma collapse. A key observation is that few of these injured axons appear to have diameters greater than 1 micron, and most are less than 500 nanometers—at or below the resolution of standard light microscopy techniques. Indeed other investigators have documented cases of axonal injury without axonal swelling, and it may be possible for axon degeneration to proceed without the classic “beads-on-a-string” morphology (Stone et al., 2001). Additionally, in this concussive injury model, white matter abnormalities are apparent by diffusion tensor imaging (DTI), where mean (MD) and axial diffusivity (AD) are both significantly reduced at 7 days post-injury (Bennett et al., 2012). Neither MD nor AD correlate with the amount of silver staining or Iba-1 labeling for microglia (Bennett et al., 2012). The inability to explain DTI abnormalities by standard histological techniques further supports the idea that we are underestimating the amount of axonal injury in rcTBI by these methods.
To test this hypothesis, we adapted array tomography for measuring axonal injury. Array tomography was developed in the lab of Stephen Smith to quantitatively measure synapses in the cortex (Micheva and Smith, 2007). In this method, improved spatial resolution is achieved along the z-axis through physical sectioning on an ultramicrotome, which greatly improves the signal to noise ratio and allows identification of individual synapses (Kay et al., 2013; Micheva and Smith, 2007). While this technique has not been rigorously validated by quantitative EM, the use of several antibodies to label pre- and post-synaptic densities and the careful co-registration of fluorescent labels with scanning electron micrographs has confirmed the spatial correlation of immunofluorescence with ultrastructural details (Micheva and Smith, 2007). Further, the advantages of this technique over traditional electron microscopy are the ability to assay larger volumes of tissue in a relatively high-throughput fashion, to label multiple proteins of interest, and to perform these experiments with a standard epifluorescent microscope.
Here, we outline a method for using array tomography to examine axon injury. We show preliminary data using this technique to resolve injured and uninjured axons at a level of resolution not previously possible except with electron microscopy. Altogether, this is a promising new method for quantitative analysis of axons that could be applied to many fields in addition to traumatic brain injury.
2. Materials and Methods
2.1 Animals
Male C57Bl/6j mice were purchased from Jackson Laboratory between 6–8 weeks of age (stock#000664). Two male APP knockout mice were obtained from Jackson Laboratory (stock# 004133) at 2 months of age (Zheng et al., 1995). Two 12-month-old male TauP301S mice and two 3-month-old tau knockout mice (gift from Marc Diamond) were also used for these experiments and were bred in house (Tucker et al., 2001). All animals were housed in accordance with the Animal Studies Committee at Washington University in Saint Louis. Mice were provided with food and water ad libitum and were maintained under a 12-hour light/dark cycle.
2.2 Surgical procedures
Mice were subjected to closed-skull sham injury or rcTBI injury (n=5 per group) as previously described (Shitaka et al., 2011). Briefly, mice are anesthetized, placed in a stereotaxic frame, and a midline incision is made. An electromagnetic impactor fitted with a rubber tip is centered over the intact skull 1.5 mm lateral to midline and 1.8 mm posterior to bregma. A 3.3 mm depth impact is delivered at 5 m/s with a dwell time of 100 ms. The incision is then sutured closed and mice recover on a heating pad.
A second group of mice underwent controlled cortical impact injuries at a depth of 1.0 mm (n=2) or 1.5 mm (n=4), which has been described elsewhere (Brody et al., 2007). Briefly, a 5 mm craniotomy is performed over the left parietal cortex. An electromagnetic impactor fitted with a 3 mm metal tip is positioned 1.2 mm left of midline and 1.5 mm anterior to lambda. Impacts are delivered at 5 m/s with a dwell time or 100ms. After irrigation with phosphate buffered saline (PBS) a plastic skull cap is glued in place, the midline incision is sutured closed, and the mice are allowed to recover on a heat pad before being returned to their cage. In all experiments, sham mice were subject to the same surgical procedures as rcTBI mice, but no impact was delivered.
For conventional immunohistochemistry, additional mice underwent either sham (n=1), rcTBI (n=2), or a 2.0 mm CCI (n=1) procedure.
2.3 Tissue embedding and sectioning for array tomography and electron microscopy
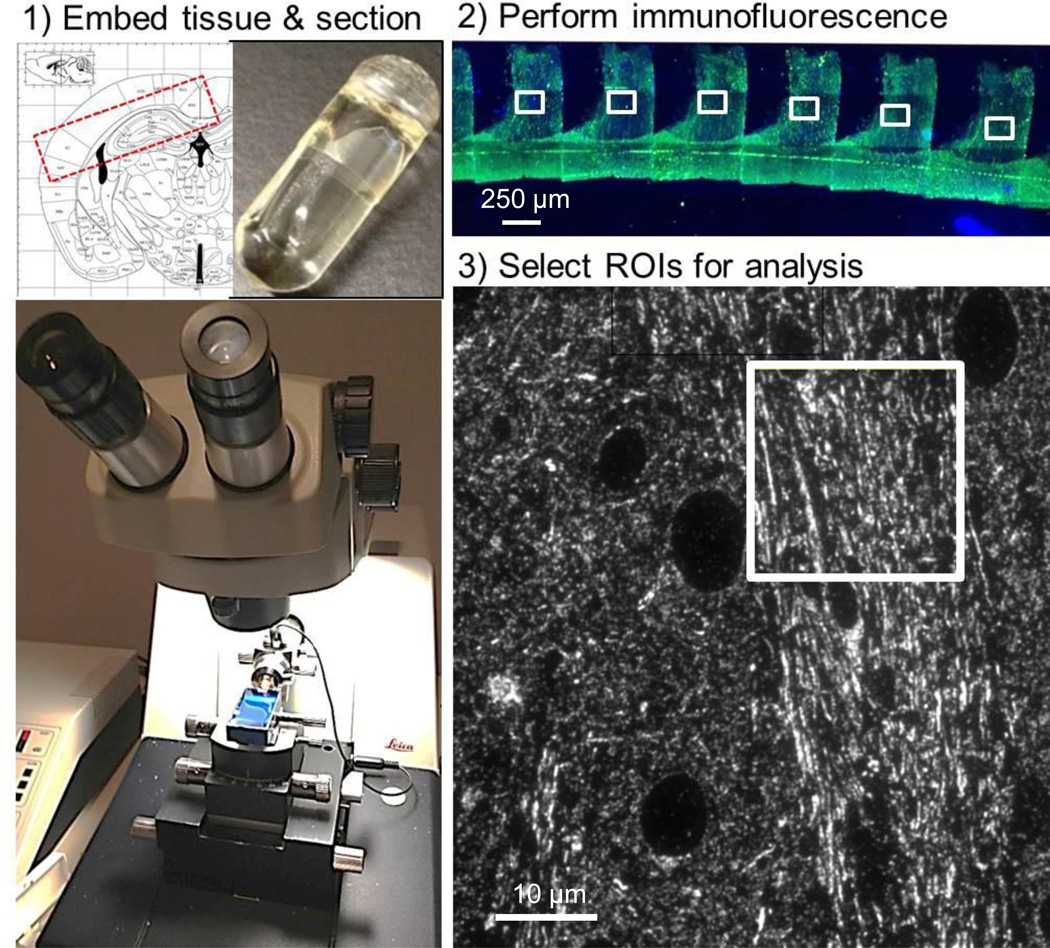
Tissue embedding and sectioning was performed as described by others with minor modifications (Kay et al., 2013). Briefly, animals were sacrificed by deep anesthesia with isofluorane followed by cardiac perfusion with 10 milliliters room temperature 0.3% heparin in 0.01 M PBS. This was immediately followed by perfusion with 10 milliliters 4% paraformaldehyde (PFA, cat# 15710 E.M.S), 0.025% sucrose in 0.01 M PBS. Brains were removed and placed in fixative for 20–30 minutes and then were sectioned into 1 mm thick coronal slabs using a razor blade and a brain slicing matrix. Corpus callosum and external capsule ipsilateral to injury was then dissected into 5 × 1.5 × 1 mm blocks (Figure 1) which were further post-fixed for 1–2 hours. Following fixation, blocks were dehydrated in an ascending ethanol series (50%, 70%, 95%, 100%, 100%). Each dehydration step was performed for 5 minutes with gently shaking using chilled solutions. Blocks were then placed in one wash with equal parts 100% ethanol and LR White (cat# 14381 E.M.S) followed by two washes in 100% LR White. Blocks were allowed to equilibrate overnight at 4°C in LR White and were then placed in gelatin capsules (cat#70100, E.M.S.) and cured overnight in a 53°C oven. Gelatin was removed by gentle heating in a 60°C water bath.
Figure 1. Array tomography workflow.
(1) Tissue is cut into 5 × 1.5 × 1 mm blocks containing corpus callosum and external capsule (Franklin and Paxinos, 2004) which are embedded in LR white media in gelatin capsules (inset, top). An ultramicrotome is used to produce 70–90 nm section ribbons using a histojumbo diamond knife. (2) Standard immunofluorescent techniques are used to label each ribbon and images from sections are captured using a 63× lens on an epifluorescent microscope. (3) Each image can then be further subdivided into smaller regions for analysis, excluding cell bodies and tissue processing artifacts.
Arrays were produced using a histojumbo diamond knife (Diatome). To collect ribbons, the top and bottom edges of each tissue block was painted with a thin layer of Weldwood contact cement (DAP products) mixed with equal parts xylene. Ribbons were collected on gelatin subbed coverslips, air-dried, and stored at room temperature prior to immunofluorescent labeling. This procedure required 30 minutes – 1 hour per mouse.
For parallel electron microscopy studies, after perfusion, 1 mm thick coronal slabs of the contralateral, uninjured hemisphere from sham mice were placed in 1% PFA, 1% glutaraldehyde in 0.01 M phosphate buffer overnight. Three slabs were prepared per mouse, beginning at the anterior-most end of the hippocampus. Sections were then incubated in 1% osmium tetroxide, dehydrated in ethanol, and embedded in Polybed 812 (cat# 08792, Polysciences, Inc.) as previously described (Bennett and Brody, 2014). Semithin sections were cut with glass knives and stained with toluidine blue to identify the region of interest. Ultrathin sections 70–90 nm were cut and stained with Reynold’s lead citrate and 4% uranyl acetate.
2.4 Immunofluorescence
For immunofluorescent labeling, a PAP pen was used to draw a hydrophobic barrier around the tissue ribbon. Sections were then incubated in 50 mM glycine in Tris buffered saline (TBS) for 5 minutes. TBS-glycine was aspirated off and a blocking solution containing 0.05% Tween, 0.1% bovine serum albumin (BSA) in TBS was applied for 20 minutes. Following blocking, primary antibodies in blocking solution were applied and coverslips were placed in a humidified chamber at 4°C overnight. The following day, tissue was washed in TBS and incubated in secondary antibody in blocking solution for 1 hour at room temperature protected from light. Tissue was then washed again in TBS and 5 µg/ml 4',6-Diamidino-2-Phenylindole, Dihydrochloride (DAPI; cat #D1306, Invitrogen) in TBS was applied for 5 minutes followed by a final wash in TBS. Coverslips were mounted on glass slides in Vectashield fluorescent mounting medium (cat# H-1000, Vector Laboratories). See Tables 1 and 2 for a complete listing of primary and secondary antibodies and dilutions that have been tested in array tomography sections and optimized for immunofluorescent labeling of axons. All immunofluorescence was imaged using a Zeiss Axiovert 200 laser scanning confocal microscope with a 40 × 1.2 NA water immersion lens or a Zeiss Axioskop 2 MOT Plus wide-field fluorescence microscope with a 63 × 1.4 NA oil immersion lens.
Table 1.
Primary antibodies tested for imaging axonal components by array tomography
| Antibody | Description | Company | Cat. No. | Dilution |
|---|---|---|---|---|
| SMI-31 | Mouse anti-neurofilament H phosphorylated | Calbiochem | NE1022 | 1:100 |
| SMI-32 | Mouse anti-neurofilament H non-phosphorylated | Calbiochem | NE1023 | 1:100 |
| SMI-34 | Mouse anti-neurofilament 200 kDa + 160 kDa | Abcam | ab24571 | 1:200 |
| MBP | Rat monoclonal to myelin basic protein | Abcam | ab7349 | 1:100 |
| APP | Rabbit polyclonal anti-β-APP | Invitrogen | 51-2700 | 1:50 |
| Tubulin | Rabbit polyclonal to α-tubulin | Abcam | ab18251 | 1:200 |
| NF200 | Rabbit polyclonal anti-200 kDa neurofilament | Sigma-Aldrich | n4142 | 1:200 |
| AT8 | Mouse monoclonal phospho-tau (pS202) | Pierce | MN-1020 | 1:50 |
| CP13 | Mouse monoclonal phospho-tau (pS202) | Courtesy P.Davies | 1:50 | |
| PHF1 | Mouse monoclonal to paired helical filaments | Courtesy P.Davies | 1:50 | |
| STMN3, SCLIP | Mouse monoclonal to stathmin 3 | Calbiochem | ab76678 | 1:50 |
Table 2.
Secondary antibodies used for array tomography.
| Antibody | Company | Cat. No. | Dilution |
|---|---|---|---|
| Donkey anti-rabbit Alexa 488 | Invitrogen | A21206 | 1:200 |
| Goat anti-rat Alexa 488 | Invitrogen | A11006 | 1:200 |
| Goat anti-mouse Alexa 488 | Jackson Immunoresearch | 115-546-146 | 1:200 |
| Goat anti-mouse Alexa 594 | Invitrogen | A11032 | 1:200 |
| Donkey anti-rabbit Cy3 | Jackson Immunoresearch | 711-165-152 | 1:200 |
2.5 Conventional immunohistochemistry
Mice were sacrificed as in 2.3, and brains were fixed in 4% PFA overnight. Following fixation, brains were equilibrated in 30% sucrose in PBS for 24 hours. A freezing microtome was used to cut 50 µm coronal slices beginning at the anterior portion of the corpus callosum ending at the posterior portion of the hippocampus. For amyloid-precursor protein and SMI-32, immunohistochemistry was performed as previously described (Mac Donald, et al. 2007a; Mac Donald, et al. 2007b). In brief sections were rinsed in Tris-buffered saline (TBS) twice, incubated in 0.03% H202 in TBS for 10 minutes, rinsed twice in TBS, and then blocked for 1 hour in normal goat serum in TBS containing 0.25% Triton-X (TBS- X). Following blocking, sections went into rabbit anti-APP (1:1000, Invitrogen) or mouse anti-SMI-32 (1:1000, Abcam), and sections were incubated overnight at 4°C with gentle shaking. For SMI-32, after blocking, sections were incubated in 1:10 goat anti-mouse Fab IgG (Jackson Immunoresearch) in TBS for 30 minutes. Sections were then rinsed twice in TBS and incubated overnight in SMI-32. After the overnight incubation, sections are rinsed with TBS twice, incubated for 1 hour in goat anti-rabbit or antimouse IgG. After incubation with secondary antibodies, sections were rinsed again, then incubated in streptavidin-horseradish peroxidase (1:400, Vector Labs) for 1 hour. Labeling was visualized with 3-3‘diaminobenzidine tetrahydrochloride (DAB; Sigma Aldrich), sections were mounted on slides, and coverslipped with Cytoseal XYL (Thermo Scientific).
2.6 Electron microscopy in uninjured sham mice
All electron micrographs were captured using a Joel 100C electron microscope. Three grids were prepared and analyzed per mouse, 1 grid per 1 mm coronal slab (n=5 mice). Images of axonal cross-sections were captured at a direct magnification of 6,000 × beginning at the base of the cingulum and continuing to the lateral edge of the tissue section. Tissue sections were placed on grids with 125 µm holes. To reduce user bias, one field of axons was sampled from each grid square in a systematic fashion. The axonal field closest to the grid bar nearest to midline was chosen. Areas of sectioning artifacts, folds, and transversely or longitudinally cut axons were avoided. In sum, this resulted in 5–8 images per section, 3 sections were imaged per mouse (3 grids), for a total of ~16 images per mouse. In total, 80 images were captured from 5 separate mice and were examined for quantitative measurement of axonal diameters.
2.7 Quantitative measurement of axonal diameters
Image J (NIH) was used for all image analysis. In each electron micrograph, a 5 × 5 µm area was selected in the center of the image for measuring axon diameters. A scaled line was drawn across the narrowest portion of the axon, excluding the myelin sheath, and this measurement was recorded. This narrowest portion of each axon was chosen as to account for the random orientation of each axonal segment. All cross-sectional axons with distinct borders were measured from each image, excluding those touching the edge of the image. In total, this analysis included an area of 400 µm2 out of an estimated total area of 500,000 µm2 (derived from area measurement of white matter in toluidine blue stained semithin sections) per mouse. This region includes ipsilateral corpus callosum and external capsule immediately below the injury site ±1.5 mm anterior-posterior.
For comparison with array tomography, approximately the same volume of tissue was analyzed by capturing 4 fluorescence images from a single 70–90 nm section per animal (n=5 uninjured sham mice) corresponding to the area of corpus callosum beneath the cingulum and extending to the lateral edge of the external capsule. Within each image, four 5 × 5 µm areas of cross-sectional axons were randomly selected. This resulted in a total of 16 fields from each mouse (80 total for analysis from all 5 mice). Rabbit anti-tubulin immunofluorescence was performed using a goat anti-rabbit Alexa 488 secondary antibody. In Image J, a line was drawn across the middle of the narrowest portion of each fluorescent point and the full width at half max (FWHM) was determined from the intensity profile. These measures were rapidly collected from several axons per field using a publically available Image J macro (courtesy John Lim, v.3 available at http://imagej.1557.x6.nabble.com/FWHM-on-line-selection-td5004777.html).
2.8 Creating projection images of axons
Images of immunofluorescent arrays containing ~30 sections each were captured and processed in Image J as previously described for synapses in Kay et al. 2013. The macros that have been developed for simplifying this process can be found in the supplementary information of their publication. In short, images of serial sections are first compiled in a stack (see Macro 1, supplemental material Kay et al. 2013) and then the multistackreg Image J plugin is used to align each section (courtesy Brad Busse, available at http://bradbusse.net/downloads.html). For axons, tubulin-labeled images were used for all alignments and the transformation file was applied to all subsequent channels. Following alignment, max z-projection images were created from each stack, channels were merged and converted to color, and the resulting image was cropped to the area of interest.
2.9 Quantitative measurement of injured axons
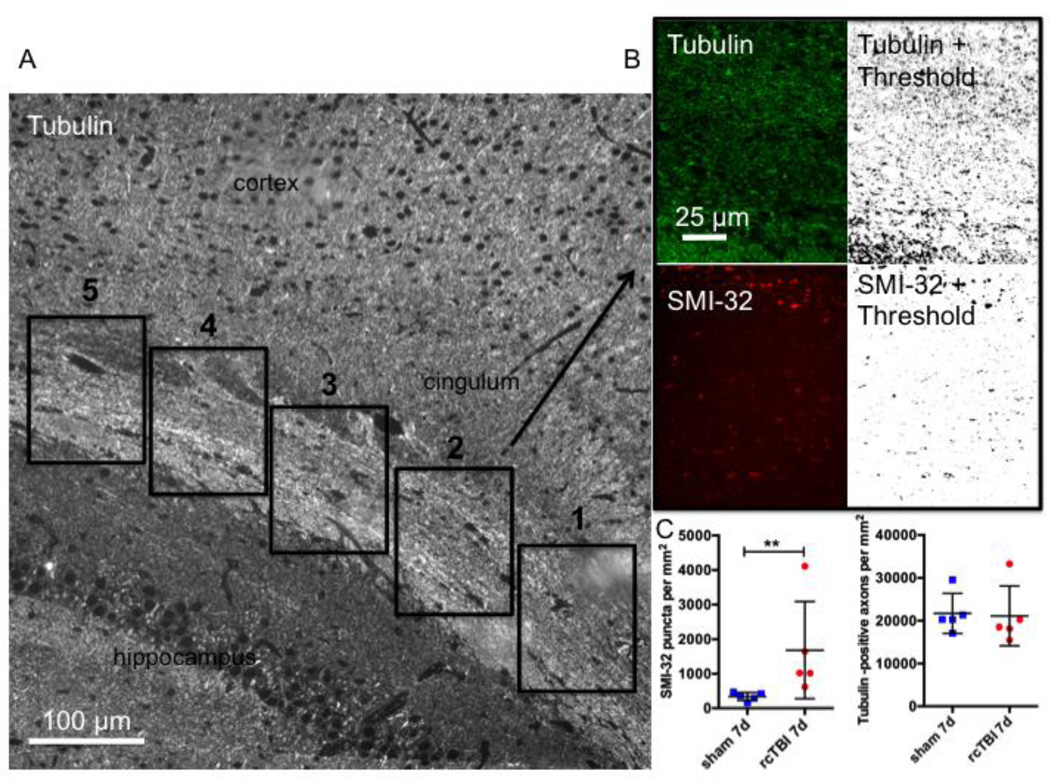
To avoid sampling bias, three short 3–5 section ribbons were taken from blocks systematically at 200 µm intervals. As two blocks, each 1 mm thick, were taken from each mouse, this resulted in six ribbons for analysis from each animal that spanned a minimum of 1.4 mm anterior to posterior. Ribbons were labeled for tubulin and SMI-32 and a single section from each ribbon was imaged using a Zeiss Axioskop 2 MOT Plus wide-field fluorescence microscope with a 63× 1.4 NA oil immersion lens. Fields centered over the corpus callosum were imaged in each section (Figure 8 A) beginning at the medial edge of the cingulum and continuing laterally until 5 images were captured (dorsal to the lateral ventricle). This resulted in a total of 30 images per mouse.
Figure 8. Quantification of injured axons following repetitive concussive traumatic brain injury.
(A) Example of a tubulin labeled section and the scheme for imaging corpus callosum and external capsule beginning at the medial edge of the cingulum and continuing laterally until 5 images are captured. (B) Example of a field included in the analysis for tubulin-Alexa 488 (top) and SMI-32-Alexa 594 (bottom) shown pre- and post-thresholding (“Moments” threshold selected for tubulin and “MaxEntropy” threshold selected for SMI-32 in Image J). (C) Quantification of SMI-32 puncta and tubulin labeled axons per mm2 in sham and rcTBI mice 7 days post injury (Error bars represent standard error of the mean, **p<0.01).
Each image was opened in image J and thresholds were applied for each channel (tubulin = Moments, smi-32 = MaxEntropy, Figure 8 B). Analyze particles was used to count the number of axons labeled for either tubulin or SMI-32.
3. Results
3.1 Adapting array tomography for the detection of injured axons
Overall the workflow (Figure 1) is similar to that reported for analysis of synapses though there are additional considerations to take into account for the preparation of arrays for analysis of axons. Most importantly, orienting tissue blocks in the gelatin capsules or molds for embedding in resin was performed with care so that the maximum amount of white matter could be sectioned later. Second, because axons have clear orientations, it was important to consider this in downstream analysis. For example, axons cut crosswise will appear punctate while axons cut longitudinally or obliquely will appear as short segments that have different X–Y locations in each section. We reasoned that assaying axons so that isotropic volumes are measured in each array or sampling from a sufficient number of randomly selected areas throughout the tissue may be the best approaches to avoiding orientation-dependent sampling bias.
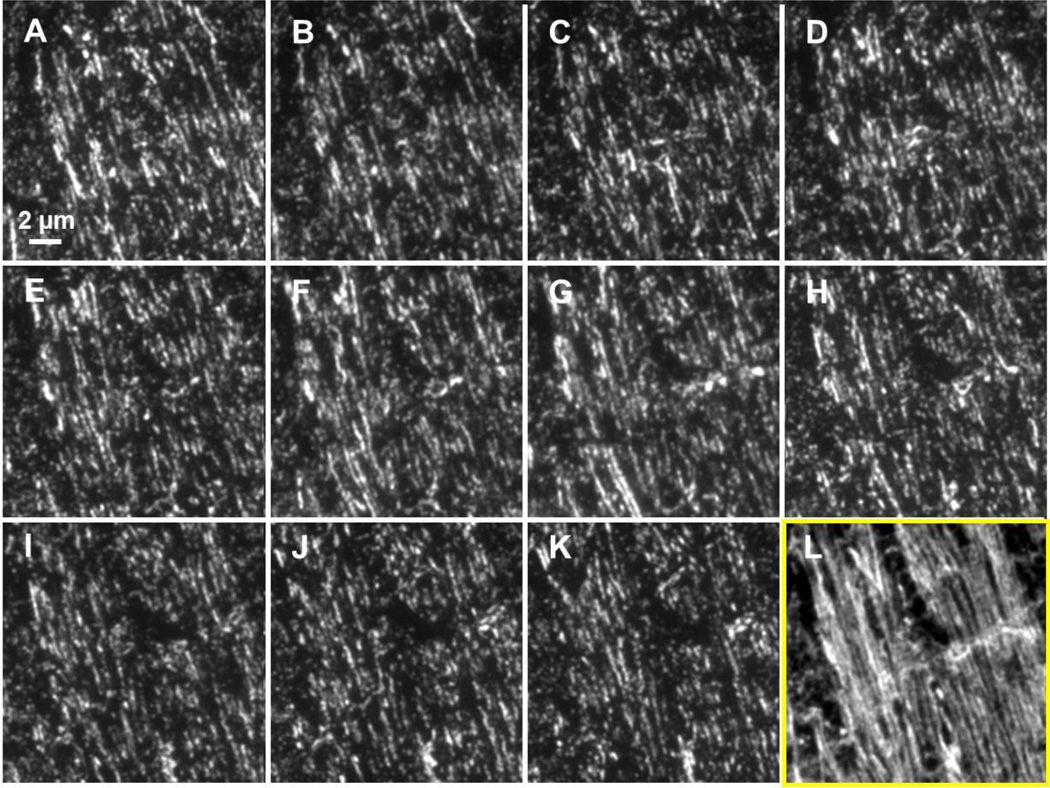
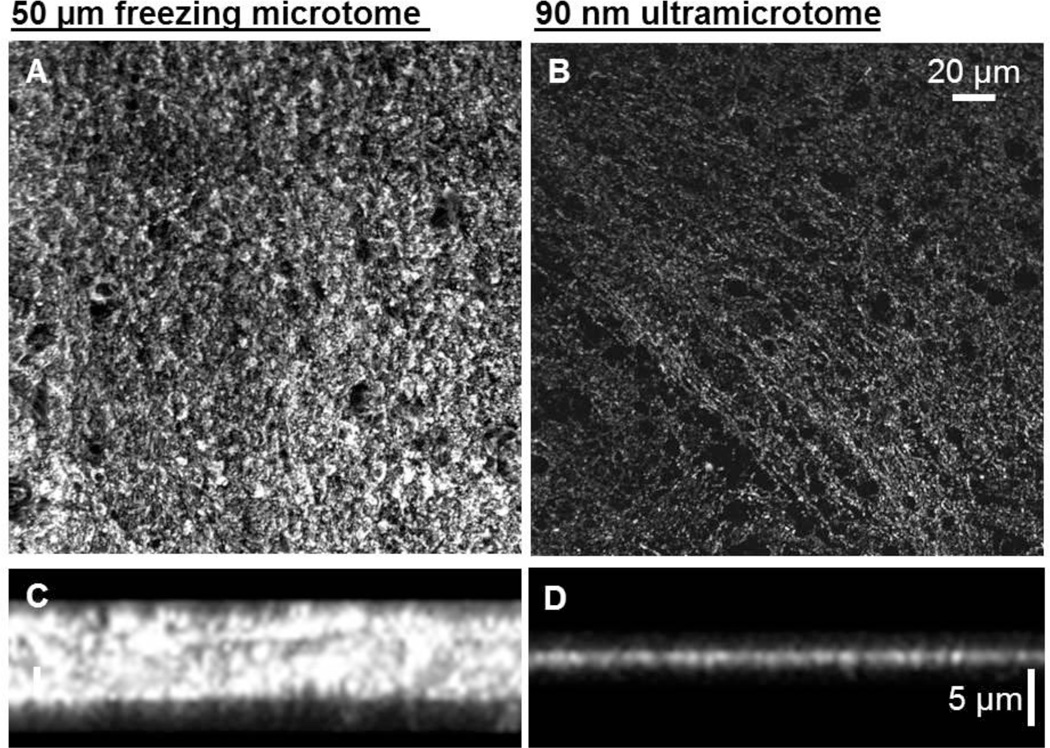
Several antibodies were tested and their sensitivity to the detection of axonal proteins and axonal injury was determined (Tables 1 and 2). We found that the antibody to tubulin appears to robustly detect axons in the mouse corpus callosum and external capsule. Using this antibody we were able to resolve individual axons by array tomography (Figure 2 A–L and 3 B). By comparison, we were not able to resolve single axons by conventional laser scanning confocal microscopy of tubulin immunofluorescence in thick sections (Figure 3 A).
Figure 2. Example of a short array containing uninjured mouse external capsule labeled with anti-tubulin and Alexa 488.
(A–K) Images of eleven 70 nm thick ultrathin sections labeled with anti-tubulin and Alexa 488. Images have been co-registered so that each represents the same 19.5 × 19.5 µm area. (L) A projection of the 11 image stack shows a reconstruction of individual, longitudinally/transversely cut axons within this stack.
Figure 3. Side by side comparison of tubulin labeling in thick sections and ultrathin sections.
(A) A confocal X–Y projection image of a section of uninjured mouse corpus callosum mouse cut at a 50 µm thickness on a freezing microtome and labeled with anti-tubulin and Alexa 488. (B) A confocal X–Y projection image of an ultrathin section from a similar region of corpus callosum cut at 90 nm on ultramicrotome and labeled with anti-tubulin and Alexa 488. (C and D) are X–Z images showing the improved spatial resolution along the Z axis.
3.2 Comparison of tubulin-labeled ultrathin sections with electron microscopy
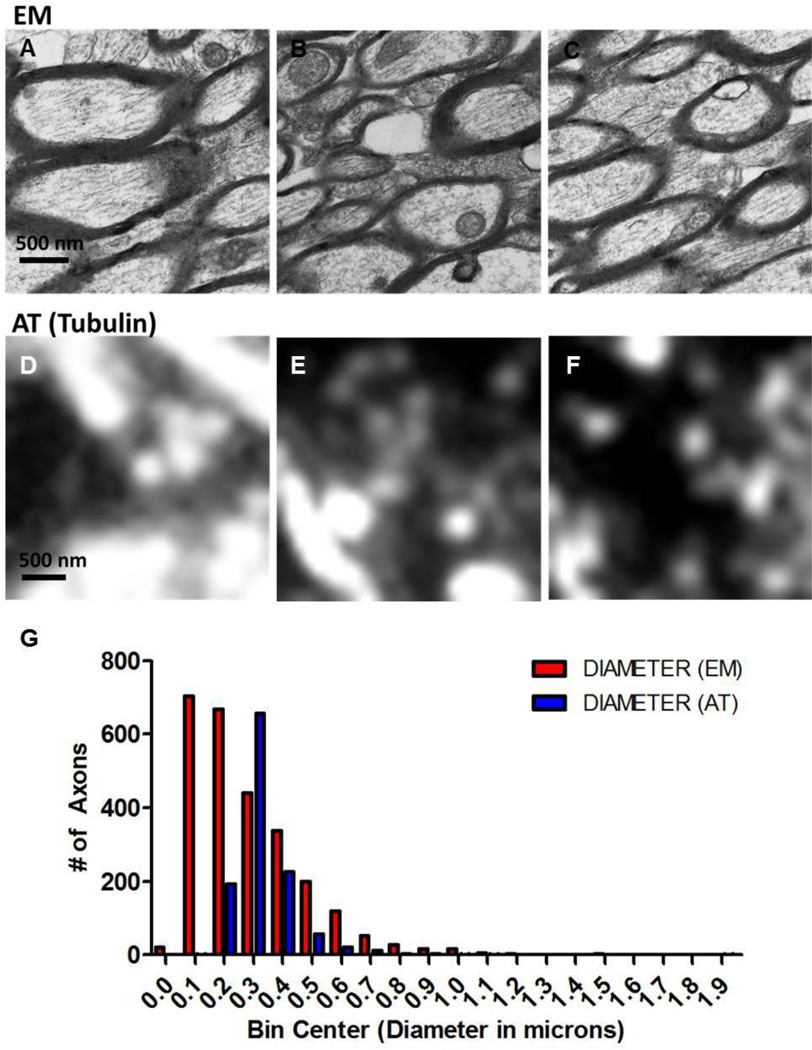
To determine how tubulin labeling in ultrathin sections reflects axonal ultrastructure, corpus callosum and external capsule in one hemisphere from uninjured sham mice (n=5) was prepared for array tomography and the opposite hemisphere was prepared for electron microscopy (Figure 4 A–F). Axon diameters were measured in both electron micrographs and fluorescent images. A total area of 0.002 mm2 was analyzed in each case. By electron microscopy, we were able to measure the diameters of 2612 axons. With ultrathin sections stained with an antibody to tubulin we measured the diameters of 1178 axons. A frequency distribution of measures from electron micrographs shows that the 25 % percentile for axon diameters was 0.14 µm, the median was 0.23 µm, and the 75% percentile was 0.39 (Figure 4 G). In tubulin-Alexa 488-labeled ultrathin sections, the 25% percentile was 0.26 µm, the median was 0.30 µm, the 75% percentile was 0.36 µm. Precision estimates of FWHM values indicate that this method of measuring axon diameters resulted in an average of ~6% error. By comparison, the uncertainty of measurement from electron micrographs is expected to be roughly the width of one pixel (3 nm), which is on average ~1% of the diameter of each axon. In all, this indicates that array tomography-based tubulin labeling does not identify all axons and, in particular, very small diameter fibers are not imaged. Furthermore, axons appear blurred due to spatial low-pass filtering which may lead to overestimated axon diameters. For example, an axon with a diameter of 100 nm imaged using a technique with maximum spatial resolution of 250 nm may appear to be 250 nm in diameter.
Figure 4. Electron microscopy versus tubulin-labeled ultrathin sections in uninjured wild-type mouse corpus callosum and external capsule.
(A–C) Electron micrographs or (DF) tubulin-Alexa 488 fluorescence images were obtained of axonal cross-sections and were used for axon diameter measurements. (G) Frequency distribution of axon diameter measurements from electron micrographs (EM) and ultrathin sections used in array tomography (AT). An equal tissue area was examined by each technique. A total of 5 uninjured mice were included in this analysis, with the right hemisphere being prepared for EM and the left for AT.
3.3 Axonal Injury Markers in Ultrathin Sections
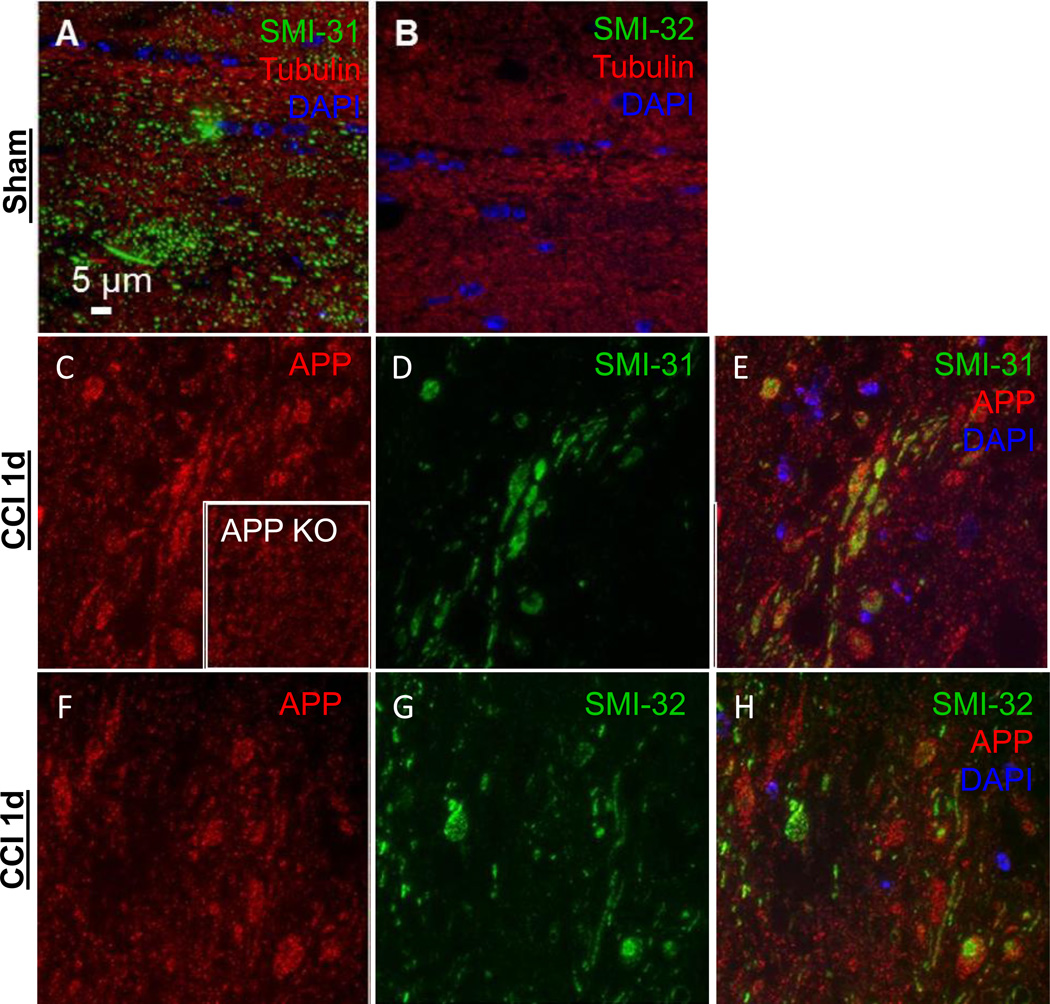
Axonal injury markers were tested in ultrathin sections containing corpus callosum and external capsule from mice subject to a moderate controlled cortical impact (CCI) traumatic brain injury and sacrificed at 24 hours (n=2). Markers to phosphorylated or non-phosphorylated heavy chain neurofilaments and amyloid precursor protein (APP) resolved structures resembling classic axonal varicosities (Figure 5 C–H). However, labeling in APP knockout mice subject to controlled cortical impact (n=2) indicates that the antibody used recognizes additional non-APP epitopes or requires additional blocking considerations in this preparation (Figure 5 C inset).
Figure 5. Axonal injury markers SMI-31, SMI-32 and APP 24 hours in uninjured sham or 1.0 mm CCI in the ipsilateral external capsule.
(A) SMI-31-Alexa 488 labels axons in an uninjured mouse while (B) SMI-32-Alexa 488 does not. Both images are co-labeled for tubulin- Alexa 594 to visualize axons and DAPI to indicate cell nuclei. After injury, (C) APP Cy3 labeled axons (inset is from CCI injured APP knockout mouse indicating non-specific binding). (D) SMI- 31 and (E) composite image of DAPI, SMI-31, and APP. (F) APP Cy3 labeled axons. (G) SMI-32 Alexa 488 labeled axons. (H) Composite image of DAPI, SMI-32, and APP. All images are from wild-type mice except panel C inset.
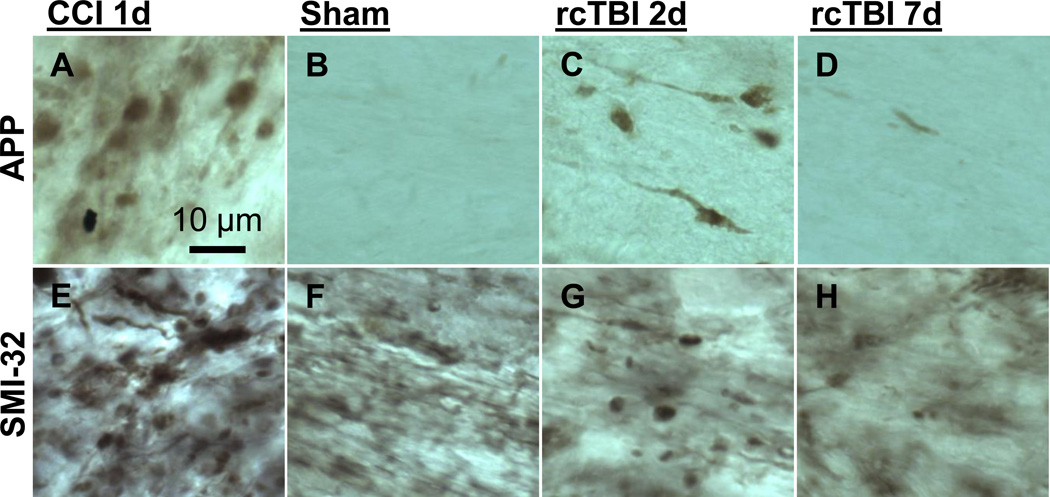
Further, when tested in an uninjured sham mouse, SMI-31 appeared to label uninjured axonal segments (Figure 5 A). This injury nonspecific labeling was also seen using other neurofilament antibodies such as NF200 and SMI-34 (data not shown). SMI-32 immunolabeling, however, was not detected in uninjured sham mice (Figure 5 B). Thus, SMI- 32 was used in subsequent studies as an axon injury specific marker. Other investigators have reported similar results using SMI-32 (Budde et al., 2008). By comparison, conventional immunohistochemistry for APP (Figure 6 A–D) and SMI-32 (Figure 6 E–H) revealed classic axonal swellings in CCI injured mice 1 day post-injury (Figure 6 A, E), but only sparsely labeled axons at 2 or 7 days following repetitive concussive injuries (Figure 6 C–D, G–H) similar to previous observations in these injury models (Mac Donald et al., 2007b; Shitaka et al., 2011). The appearance of SMI-32 non-specific background labeling seen in tissue from sham mice using conventional immunohistochemistry but not in arrays is most likely due to the embedding in plastic resin, which limits the availability of epitopes for antibody binding. These differences between preparations, including the inefficient immunolabeling in LR White resin, have been noted elsewhere (Kay et al., 2013).
Figure 6. Conventional immunohistochemistry for APP and SMI-32 in external capsule.
Representative images of axonal injury from 1 day CCI (A, E), 7 day sham (B, F), 2 day rcTBI (C, G) or 7 day rcTBI (D, H) in wild-type mice. Sections were labeled for amyloid precursor protein (A, B, C, D) or with antibodies to SMI-32 (E, F, G, H). Images in CCI mice were captured from pericontusional corpus callosum. All other images were taken from external capsule directly underlying the site of impact (or sham injury) near the lateral ventricle, which was the only region where axonal varicosities were observed using these markers.
3.4 Using SMI-32/Tubulin to assess axonal injury after TBI
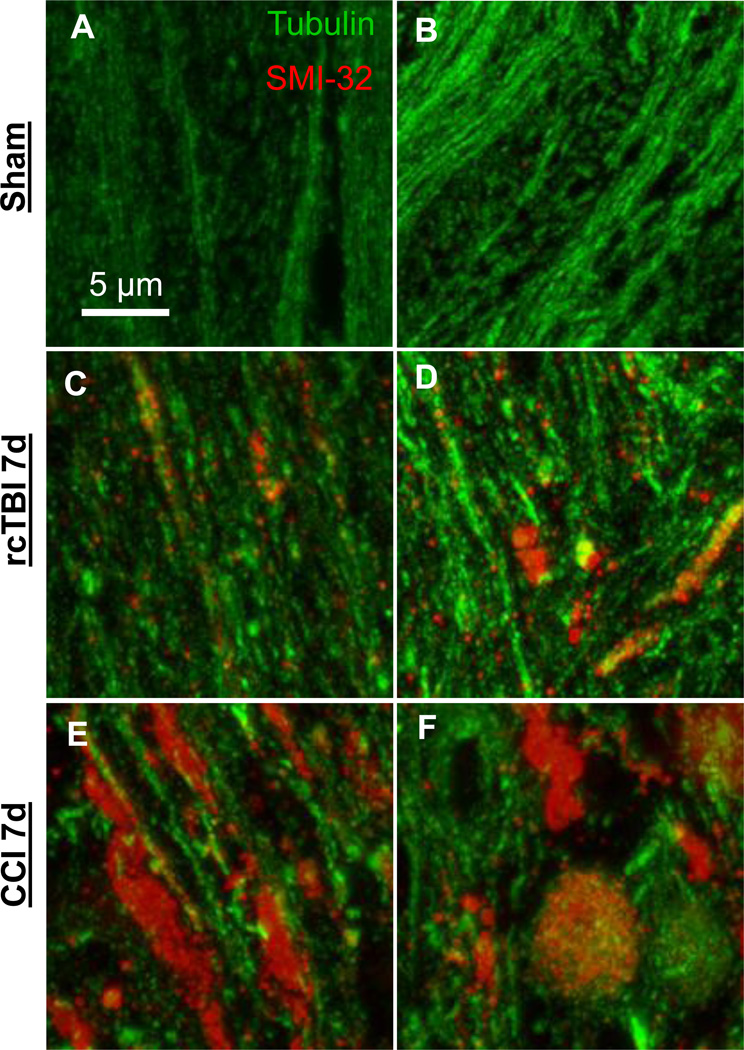
To qualitatively assess axonal injury in TBI, tissue blocks containing corpus callosum and external capsule from uninjured sham (n=5), repetitive concussive TBI (n=5), and 1.5 mm CCI (n=4) mice were prepared 7 days post-injury. Sections from each were stained for anti- SMI-32 to label areas of injury and anti-tubulin to label all axons (Figure 7 A–F). In sham mice, little to no SMI-32 was detected and tubulin-labeled axons did not appear to be swollen or distorted (Figure 7 A, B). Mice subjected to rcTBI had areas of small punctate SMI-32 labeling as well as regions of SMI-32/tubulin co-localization (Figure 7 C, D). In moderate TBI, clear disruption of axons was evident with large SMI-32 swellings appearing with or without tubulin co-localization. Further, the overall amount of tubulin appeared to be greatly reduced (Figure 7 E,F).
Figure 7. Projection images of arrays (~20 sections each) from external capsule labeled with the axonal injury marker SMI-32-Alexa 594 and tubulin-Alexa 488.
(A, B) Axons from uninjured wild-type mice displayed little SMI-32 labeling. (C,D) Mice subjected to repetitive concussive traumatic brain injury had punctate areas of SMI-32 labeling and occasional colocalization of SMI-32 and tubulin in swollen axons at 7 days. (E,F) Larger axonal varicosities >3 µm in diameter were apparent in a model of 1.5 mm CCI moderate traumatic brain injury at 7 days. Tubulin loss was also evident. Panels in each row represent images of arrays from two separate mice.
To quantitatively determine the number of injured axons in rcTBI mice versus shams, single sections containing corpus callosum and external capsule were systematically sampled from each animal (n=5 per group, see Methods 2.9 for details, Figure 8 A,B). As expected there was a significant difference in the number of SMI-32 puncta seen in sections from injured mice versus sham mice 7 days post-injury (One-tailed Mann-Whitney U test, p=0.004, Figure 8 C). The total number of tubulin labeled axons was not different, however (One-tailed Mann- Whitney U test, p=0.206, Figure 8 C).
3.5 Other markers for array tomography
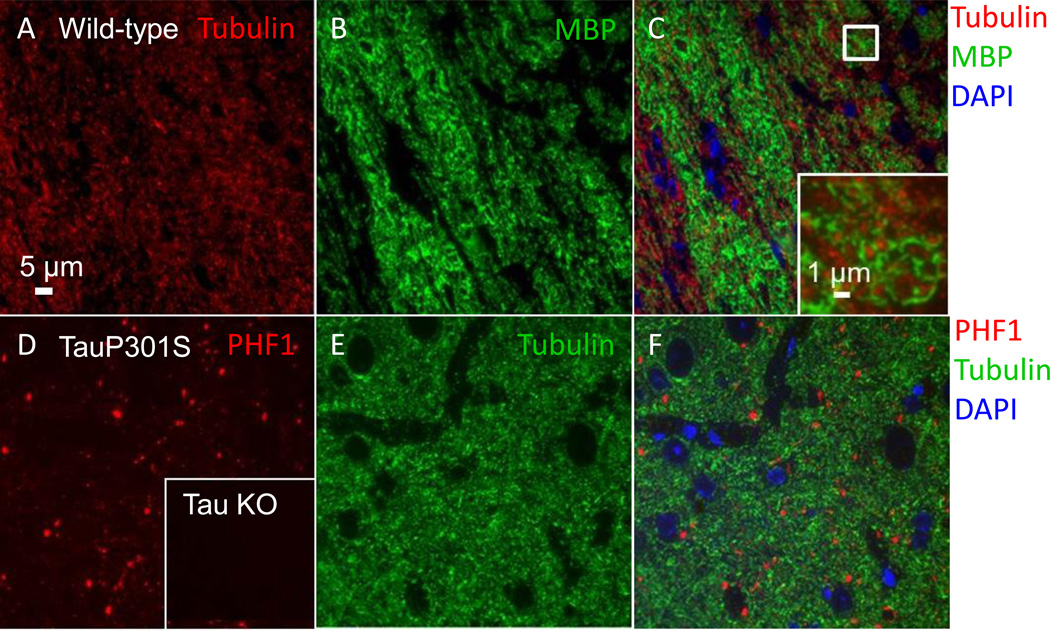
In addition to assaying classic markers of axonal injury in white matter, we also tested antibodies to myelin basic protein (MBP) and to the microtubule associated protein tau, which is enriched in axons. Anti-MBP prominently labeled myelinated axons in white matter tracts in a distribution that was complementary to that of tubulin, as expected (Figure 9 A–C). The tau antibodies PHF1, AT8, and CP13 were all tested in tissue from aged mice carrying a familial frontotemporal dementia mutation (TauP301S). These phospho-tau antibodies all detected punctate aggregates in entorhinal cortex (PHF1 shown, Figure 9 D–F). No tau labeling was seen in the cortex of tau knockout mice (PHF1 shown, Figure 9 D inset).
Figure 9. Additional axonal markers for use with array tomography.
(A–C) Myelin basic protein and tubulin labeling in the external capsule of an uninjured wild-type mouse. (A) Tubulin- Alexa 594 labeled axons. (B) Myelin basic protein (MBP)-Alexa 488 labeled axons. (C) Composite image of DAPI, myelin basic protein, and tubulin. Inset shows an enlarged view of the box in (C), where individual myelinated axonal cross-sections are clearly visible. (D–F) PHF-1 tau and tubulin labeling in the entorhinal cortex of a 12-month-old Tau P301S mouse. (D) PHF1-Cy3 labeled punctae. Inset shows the absence of PHF1 labeling in cortex from a tau knockout mouse. (E) Tubulin Alexa 488 labeled neuropil. (F) Composite image of DAPI, tubulin, and PHF1.
Discussion
Here we have applied the powerful technique of array tomography to the detection of injured axons. This promising method appears to distinguish injury in non-dilated axons with diameters greater than ~200 nm following repetitive concussive TBI models compared to uninjured shams. Conventional light microscopic techniques are insufficient for this purpose, and prior to this report, electron microscopy was required to assess injured non-dilated axons. Further, a range of antibodies were assessed that can be used in several downstream applications in addition to the field of traumatic brain injury.
Previously, array tomography has been used to quantify synaptic density near amyloid plaques in mice, to quantify synapses in human AD patients with or without the APOE4 allele, to investigate mitochondria distribution in the soma and neurites of mutant tau mice, to reconstruct tau-containing axons and synapses in a reversible tauopathy model, and to examine morphological changes in mouse blood vessels and aortic aneurysms (Koffie et al., 2012; Koffie et al., 2009; Kopeikina et al., 2011; Kopeikina et al., 2013; Polydoro et al., 2013; Pooler et al., 2013; Saatchi et al., 2012). To date, this is the only investigation of which we are aware using this technique to study axonal injury specifically. The ability to qualitatively and quantitatively examine axonal pathology is broadly relevant to several injury and neurodegenerative disease studies which currently rely on traditional histological measures and in vivo MRI techniques to investigate axonal injury. However, use of standard light microscopic techniques only reflects axonal injury if it results in large scale changes. Here, we confirmed by electron microscopy that most mouse axons in corpus callosum and external capsule are smaller than 500 nanometers, which is well below the typical resolution of these techniques. Using array tomography we were able to resolve individual axons with diameters near 200 nm or greater.
Further, in these small axons we were able to detect axonal injury in mice that were subjected to repetitive concussive TBI and were sacrificed at 7 days. These results are in accordance with silver staining abnormalities and electron microscopy data in this injury model which indicates widespread axonal damage in spite of the lack of traditional immunohistochemistry findings (Shitaka et al., 2011). Thus, it would appear that array tomography may be useful for future studies investigating axonal injury in this model. This technique has the advantage of being more quantitative than silver staining, which is measured semi-quantitatively by optical density. Also, array tomography is less costly than electron microscopy or super-resolution light microscopy as it can be performed with a standard epifluorescence microscope. Further, compared to electron microscopy or super-resolution light microscopy, this technique has higher throughput and allows for a greater volume of tissue to be processed at a time. It also has the advantage that many antibodies are available which aid in the study of specific proteins in axonal injury. While immunoEM is also possible, it is challenging, time consuming, and rarely allows visualization of more than 1–2 markers in a semi-quantitative fashion. Arrays have the advantage of allowing visualization of multiple proteins of interest at once using different fluorophore-tagged secondary antibodies.
However, there are several limitations that should be addressed. First, while arrays can provide high spatial resolution data that conventional histology cannot, electron microscopy remains the gold standard. In these studies, we were not able to resolve small axons <200 nm in diameter and based on data from parallel electron microscopy studies, this appears to be nearly half of the total population of axons in the corpus callosum and external capsule as determined in this study. Further, considering that we were also not able to resolve all large diameter axons, it may be that the rabbit polyclonal anti-tubulin antibody chosen for these studies does not label all axonal populations. Testing additional tubulin antibodies may shed light on this issue. On the other hand, the size differences observed could have been in part due to differential preparation and handling of tissue for EM versus AT. We were not able to determine the extent to which preparative difference may have contributed to this size discrepancy. Thus direct quantitative comparison between EM and AT may not be entirely appropriate. Ideally, such a study would be performed in the same tissue sections—prior to embedding in LR White, tissue could be incubated in osmium tetroxide. After immunofluorescence, lead citrate and uranyl acetate could be applied to the tissue sections and scanning electron miscroscopy could be performed. This correlative electron microscopy approach has been reported by Micheva and colleagues and may be a future direction for validation of axonal injury measures in array tomography (2007).
Additional studies to be performed include further validating this method by extending quantitative studies to additional injury timepoints, severities, and injury markers. Intriguingly, here we show injury induces SMI-32 neurofilament immunoreactivity with and without tubulin colocalization, demonstrating the ability to spatially localize these small structures. It would be of interest to better characterize the spatial relationships of classic injury markers using arrays, as conventional histology may overestimate the amount of co-localization.
Future studies may also use this method to study other aspects of axonal injury in both traumatic brain injury and other conditions. Labeling myelin basic protein, for example could be used not only to determine if myelinated axons are preferentially injured in rcTBI, but could also be used to investigate demyelinating disorders such as multiple sclerosis. Given the ability to discriminate individual axons in large areas of tissue, it may be possible to detect early signs of demyelination, and discern the effects of therapeutic or genetic manipulations on disease progression. Also, given our ability to detect abnormally phosphorylated tau species using multiple antibodies, a clear future direction is to apply this method to the detection of tau alterations after traumatic brain injury. Previously, our lab has observed abnormal accumulations of phosphorylated intra-axonal tau following moderate-severe injury (Tran et al., 2011a; Tran et al., 2011b). Considering the sensitivity of this technique, it will be interesting to use arrays to measure intra-axonal tau in less severe injury models such as rcTBI. Last, an exciting direction is to use this method to detect axon degeneration in tissue from human patients where it may be possible to answer key questions about Chronic Traumatic Encephalopathy and Alzheimer’s disease through quantitation of axon injury or loss and correlative analysis with clinical measures.
To summarize, we have adapted array tomography to qualitatively and quantitatively assess injured axons in tissue from two different experimental TBI mouse models. Several immunofluorescent markers are available for examining different aspects of axonal integrity including tubulin, neurofilaments, APP, myelin basic protein, and phospho-tau species. Future directions will be aimed at extending these studies to examining additional brain injury and neurodegenerative disease models and for adapting these methods for use in human tissue.
Highlights.
Improved spatial resolution allows visualization of individual axons
Enhanced visualization of small non-dilated injured axons over conventional histology
Identified array-compatible antibodies for examining axon integrity and injury
Acknowledgements
We would like to thank Tara Spires-Jones and Kevin Kay for their generous technical assistance and advice for adapting arrays to measuring axons. We also thank Krikor Dikranian and Marilyn Levy for their assistance with electron microscopy, Cheryl Leyns and Joseph Benetatos for their preliminary work testing antibodies on arrays, and Jeremy Dittman for assistance with axon diameter precision estimates. We would also like to thank the NIH F31- NS076047 (REB), NIH R01-NS065069, (DLB), Health South (DLB) the Alafi NeuroImaging Core, and the Molecular Microbiology Imaging Facility.
Abbreviations
- TBI
traumatic brain injury
- rcTBI
repetitive closed-skull traumatic brain injury
- APP
amyloid precursor protein
- DTI
diffusion tensor imaging
- MD
mean diffusivity
- AD
axial diffusivity
- NF
neurofilament
- MBP
myelin basic protein
- PBS
phosphate buffered saline
- TBS
tris buffered saline
- PFA
paraformaldehyde
Footnotes
Publisher's Disclaimer: This is a PDF file of an unedited manuscript that has been accepted for publication. As a service to our customers we are providing this early version of the manuscript. The manuscript will undergo copyediting, typesetting, and review of the resulting proof before it is published in its final citable form. Please note that during the production process errors may be discovered which could affect the content, and all legal disclaimers that apply to the journal pertain.
References
- Aboitiz F, Scheibel AB, Fisher RS, Zaidel E. Fiber composition of the human corpus callosum. Brain research. 1992;598:143–153. doi: 10.1016/0006-8993(92)90178-c. [DOI] [PubMed] [Google Scholar]
- Bennett RE, Brody DL. Acute reduction of microglia does not alter axonal injury in a mouse model of repetitive concussive traumatic brain injury. Journal of neurotrauma. 2014;31:1647–1663. doi: 10.1089/neu.2013.3320. [DOI] [PMC free article] [PubMed] [Google Scholar]
- Bennett RE, Mac Donald CL, Brody DL. Diffusion tensor imaging detects axonal injury in a mouse model of repetitive closed-skull traumatic brain injury. Neurosci Lett. 2012;513:160–165. doi: 10.1016/j.neulet.2012.02.024. [DOI] [PMC free article] [PubMed] [Google Scholar]
- Blumbergs PC, Scott G, Manavis J, Wainwright H, Simpson DA, McLean AJ. Staining of amyloid precursor protein to study axonal damage in mild head injury. Lancet. 1994;344:1055–1056. doi: 10.1016/s0140-6736(94)91712-4. [DOI] [PubMed] [Google Scholar]
- Brody DL, Mac Donald C, Kessens CC, Yuede C, Parsadanian M, Spinner M, Kim E, Schwetye KE, Holtzman DM, Bayly PV. Electromagnetic controlled cortical impact device for precise, graded experimental traumatic brain injury. Journal of neurotrauma. 2007;24:657–673. doi: 10.1089/neu.2006.0011. [DOI] [PMC free article] [PubMed] [Google Scholar]
- Budde MD, Kim JH, Liang HF, Russell JH, Cross AH, Song SK. Axonal injury detected by in vivo diffusion tensor imaging correlates with neurological disability in a mouse model of multiple sclerosis. NMR in biomedicine. 2008;21:589–597. doi: 10.1002/nbm.1229. [DOI] [PMC free article] [PubMed] [Google Scholar]
- Creed JA, DiLeonardi AM, Fox DP, Tessler AR, Raghupathi R. Concussive brain trauma in the mouse results in acute cognitive deficits and sustained impairment of axonal function. J Neurotrauma. 2011;28:547–563. doi: 10.1089/neu.2010.1729. [DOI] [PMC free article] [PubMed] [Google Scholar]
- Creeley CE, Wozniak DF, Bayly PV, Olney JW, Lewis LM. Multiple episodes of mild traumatic brain injury result in impaired cognitive performance in mice. Academic emergency medicine : official journal of the Society for Academic Emergency Medicine. 2004;11:809–819. doi: 10.1111/j.1553-2712.2004.tb00761.x. [DOI] [PubMed] [Google Scholar]
- DeFord SM, Wilson MS, Rice AC, Clausen T, Rice LK, Barabnova A, Bullock R, Hamm RJ. Repeated mild brain injuries result in cognitive impairment in B6C3F1 mice. J Neurotrauma. 2002;19:427–438. doi: 10.1089/08977150252932389. [DOI] [PubMed] [Google Scholar]
- Franklin KB, Paxinos G. The Mouse Brain in Stereotaxic Coordinates. San Diego: Academic Press; 2004. [Google Scholar]
- Kane MJ, Angoa-Perez M, Briggs DI, Viano DC, Kreipke CW, Kuhn DM. A mouse model of human repetitive mild traumatic brain injury. Journal of neuroscience methods. 2012;203:41–49. doi: 10.1016/j.jneumeth.2011.09.003. [DOI] [PMC free article] [PubMed] [Google Scholar]
- Kay KR, Smith C, Wright AK, Serrano-Pozo A, Pooler AM, Koffie R, Bastin ME, Bak TH, Abrahams S, Kopeikina KJ, McGuone D, Frosch MP, Gillingwater TH, Hyman BT, Spires-Jones TL. Studying synapses in human brain with array tomography and electron microscopy. Nature protocols. 2013;8:1366–1380. doi: 10.1038/nprot.2013.078. [DOI] [PMC free article] [PubMed] [Google Scholar]
- Kim JH, Ellman A, Juraska JM. A re-examination of sex differences in axon density and number in the splenium of the rat corpus callosum. Brain research. 1996;740:47–56. doi: 10.1016/s0006-8993(96)00637-3. [DOI] [PubMed] [Google Scholar]
- Koffie RM, Hashimoto T, Tai HC, Kay KR, Serrano-Pozo A, Joyner D, Hou S, Kopeikina KJ, Frosch MP, Lee VM, Holtzman DM, Hyman BT, Spires-Jones TL. Apolipoprotein E4 effects in Alzheimer's disease are mediated by synaptotoxic oligomeric amyloid-beta. Brain : a journal of neurology. 2012;135:2155–2168. doi: 10.1093/brain/aws127. [DOI] [PMC free article] [PubMed] [Google Scholar]
- Koffie RM, Meyer-Luehmann M, Hashimoto T, Adams KW, Mielke ML, Garcia-Alloza M, Micheva KD, Smith SJ, Kim ML, Lee VM, Hyman BT, Spires-Jones TL. Oligomeric amyloid beta associates with postsynaptic densities and correlates with excitatory synapse loss near senile plaques. Proceedings of the National Academy of Sciences of the United States of America. 2009;106:4012–4017. doi: 10.1073/pnas.0811698106. [DOI] [PMC free article] [PubMed] [Google Scholar]
- Kopeikina KJ, Carlson GA, Pitstick R, Ludvigson AE, Peters A, Luebke JI, Koffie RM, Frosch MP, Hyman BT, Spires-Jones TL. Tau accumulation causes mitochondrial distribution deficits in neurons in a mouse model of tauopathy and in human Alzheimer's disease brain. The American journal of pathology. 2011;179:2071–2082. doi: 10.1016/j.ajpath.2011.07.004. [DOI] [PMC free article] [PubMed] [Google Scholar]
- Kopeikina KJ, Polydoro M, Tai HC, Yaeger E, Carlson GA, Pitstick R, Hyman BT, Spires-Jones TL. Synaptic alterations in the rTg4510 mouse model of tauopathy. The Journal of comparative neurology. 2013;521:1334–1353. doi: 10.1002/cne.23234. [DOI] [PMC free article] [PubMed] [Google Scholar]
- Lamantia AS, Rakic P. Cytological and quantitative characteristics of four cerebral commissures in the rhesus monkey. The Journal of comparative neurology. 1990;291:520–537. doi: 10.1002/cne.902910404. [DOI] [PubMed] [Google Scholar]
- Laurer HL, Bareyre FM, Lee VM, Trojanowski JQ, Longhi L, Hoover R, Saatman KE, Raghupathi R, Hoshino S, Grady MS, McIntosh TK. Mild head injury increasing the brain's vulnerability to a second concussive impact. J Neurosurg. 2001;95:859–870. doi: 10.3171/jns.2001.95.5.0859. [DOI] [PubMed] [Google Scholar]
- Longhi L, Saatman KE, Fujimoto S, Raghupathi R, Meaney DF, Davis J, McMillan BSA, Conte V, Laurer HL, Stein S, Stocchetti N, McIntosh TK. Temporal window of vulnerability to repetitive experimental concussive brain injury. Neurosurgery. 2005;56:364–374. doi: 10.1227/01.neu.0000149008.73513.44. [DOI] [PubMed] [Google Scholar]
- Mac Donald CL, Dikranian K, Bayly P, Holtzman D, Brody D. Diffusion tensor imaging reliably detects experimental traumatic axonal injury and indicates approximate time of injury. The Journal of neuroscience : the official journal of the Society for Neuroscience. 2007a;27:11869–11876. doi: 10.1523/JNEUROSCI.3647-07.2007. [DOI] [PMC free article] [PubMed] [Google Scholar]
- Mac Donald CL, Dikranian K, Song SK, Bayly PV, Holtzman DM, Brody DL. Detection of traumatic axonal injury with diffusion tensor imaging in a mouse model of traumatic brain injury. Experimental neurology. 2007b;205:116–131. doi: 10.1016/j.expneurol.2007.01.035. [DOI] [PMC free article] [PubMed] [Google Scholar]
- Meehan WP, 3rd, Zhang J, Mannix R, Whalen MJ. Increasing recovery time between injuries improves cognitive outcome after repetitive mild concussive brain injuries in mice. Neurosurgery. 2012;71:885–891. doi: 10.1227/NEU.0b013e318265a439. [DOI] [PMC free article] [PubMed] [Google Scholar]
- Micheva KD, Smith SJ. Array tomography: a new tool for imaging the molecular architecture and ultrastructure of neural circuits. Neuron. 2007;55:25–36. doi: 10.1016/j.neuron.2007.06.014. [DOI] [PMC free article] [PubMed] [Google Scholar]
- Mouzon B, Chaytow H, Crynen G, Bachmeier C, Stewart J, Mullan M, Stewart W, Crawford F. Repetitive mild traumatic brain injury in a mouse model produces learning and memory deficits accompanied by histological changes. J Neurotrauma. 2012;29:2761–2773. doi: 10.1089/neu.2012.2498. [DOI] [PubMed] [Google Scholar]
- Olivares R, Montiel J, Aboitiz F. Species differences and similarities in the fine structure of the mammalian corpus callosum. Brain, behavior and evolution. 2001;57:98–105. doi: 10.1159/000047229. [DOI] [PubMed] [Google Scholar]
- Polydoro M, de Calignon A, Suarez-Calvet M, Sanchez L, Kay KR, Nicholls SB, Roe AD, Pitstick R, Carlson GA, Gomez-Isla T, Spires-Jones TL, Hyman BT. Reversal of neurofibrillary tangles and tau-associated phenotype in the rTgTauEC model of early Alzheimer's disease. The Journal of neuroscience : the official journal of the Society for Neuroscience. 2013;33:13300–13311. doi: 10.1523/JNEUROSCI.0881-13.2013. [DOI] [PMC free article] [PubMed] [Google Scholar]
- Pooler AM, Polydoro M, Wegmann SK, Pitstick R, Kay KR, Sanchez L, Carlson GA, Gomez-Isla T, Albers MW, Spires-Jones TL, Hyman BT. Tau-amyloid interactions in the rTgTauEC model of early Alzheimer's disease suggest amyloid-induced disruption of axonal projections and exacerbated axonal pathology. The Journal of comparative neurology. 2013;521:4236–4248. doi: 10.1002/cne.23411. [DOI] [PMC free article] [PubMed] [Google Scholar]
- Saatchi S, Azuma J, Wanchoo N, Smith SJ, Yock PG, Taylor CA, Tsao PS. Three-dimensional microstructural changes in murine abdominal aortic aneurysms quantified using immunofluorescent array tomography. The journal of histochemistry and cytochemistry : official journal of the Histochemistry Society. 2012;60:97–109. doi: 10.1369/0022155411433066. [DOI] [PMC free article] [PubMed] [Google Scholar]
- Shitaka Y, Tran HT, Bennett RE, Sanchez L, Levy MA, Dikranian K, Brody DL. Repetitive closed-skull traumatic brain injury in mice causes persistent multifocal axonal injury and microglial reactivity. J Neuropathol Exp Neurol. 2011;70:551–567. doi: 10.1097/NEN.0b013e31821f891f. [DOI] [PMC free article] [PubMed] [Google Scholar]
- Stone JR, Singleton RH, Povlishock JT. Intra-axonal neurofilament compaction does not evoke local axonal swelling in all traumatically injured axons. Experimental neurology. 2001;172:320–331. doi: 10.1006/exnr.2001.7818. [DOI] [PubMed] [Google Scholar]
- Tran HT, Laferla FM, Holtzman DM, Brody DL. Controlled Cortical Impact Traumatic Brain Injury in 3xTg-AD Mice Causes Acute Intra-Axonal Amyloid-beta Accumulation and Independently Accelerates the Development of Tau Abnormalities. The Journal of neuroscience : the official journal of the Society for Neuroscience. 2011a;31:9513–9525. doi: 10.1523/JNEUROSCI.0858-11.2011. [DOI] [PMC free article] [PubMed] [Google Scholar]
- Tran HT, Sanchez L, Esparza TJ, Brody DL. Distinct Temporal and Anatomical Distributions of Amyloid-beta and Tau Abnormalities following Controlled Cortical Impact in Transgenic Mice. PloS one. 2011b;6:e25475. doi: 10.1371/journal.pone.0025475. [DOI] [PMC free article] [PubMed] [Google Scholar]
- Tucker KL, Meyer M, Barde YA. Neurotrophins are required for nerve growth during development. Nat Neurosci. 2001;4:29–37. doi: 10.1038/82868. [DOI] [PubMed] [Google Scholar]
- Uryu K, Laurer H, McIntosh T, Pratico D, Martinez D, Leight S, Lee VM, Trojanowski JQ. Repetitive mild brain trauma accelerates Abeta deposition, lipid peroxidation, and cognitive impairment in a transgenic mouse model of Alzheimer amyloidosis. The Journal of neuroscience : the official journal of the Society for Neuroscience. 2002;22:446–454. doi: 10.1523/JNEUROSCI.22-02-00446.2002. [DOI] [PMC free article] [PubMed] [Google Scholar]
- Zheng H, Jiang M, Trumbauer ME, Sirinathsinghji DJ, Hopkins R, Smith DW, Heavens RP, Dawson GR, Boyce S, Conner MW, Stevens KA, Slunt HH, Sisoda SS, Chen HY, Van der Ploeg LH. beta-Amyloid precursor protein-deficient mice show reactive gliosis and decreased locomotor activity. Cell. 1995;81:525–531. doi: 10.1016/0092-8674(95)90073-x. [DOI] [PubMed] [Google Scholar]
- Zohar O, Schreiber S, Getslev V, Schwartz JP, Mullins PG, Pick CG. Closed-head minimal traumatic brain injury produces long-term cognitive deficits in mice. Neuroscience. 2003;118:949–955. doi: 10.1016/s0306-4522(03)00048-4. [DOI] [PubMed] [Google Scholar]


