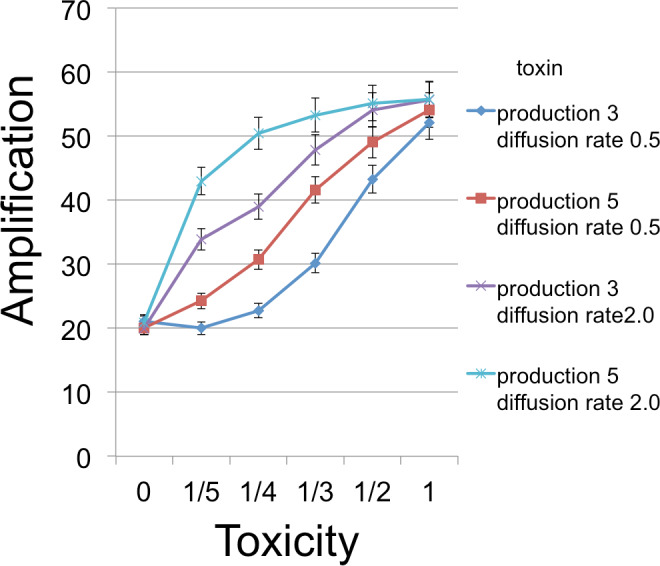
Figure 4. B cell amplification as a function of toxin toxicity for different values of toxin production and toxin diffusion rate.

Toxin toxicity (horizontal axis) denotes the reciprocal of the number of attached toxin molecules needed to kill a C cell; the value x = 0 corresponds to the situation with no toxin. Toxin production is the number of toxin molecules produced per simulation time step by a B cell, provided it has sufficient energy; toxin diffusion rate is the number of patches that a toxin moves (in a randomly chosen direction) each time step. The dynamic range was highest for the larger diffusion rate and corresponds to an overall 2.67 × increase. The simulations were initialized with a 1 : 1 ratio of randomly distributed C to B cells (200 cells each). Other model parameters were toxin duration (3 steps), nutrient units per patch (12), nutrient units available per killed cell (.5), simulation time (350 steps).
