

Abstract
This study reports T2 and diffusion-tensor magnetic resonance imaging (MRI) studies of a mild open-skull, controlled cortical impact injury in rats (n=6) from 3 h to up to 14 d after traumatic brain injury (TBI). Comparison was made with longitudinal behavioral measurements and end-point histology. The impact was applied over the left primary forelimb somatosensory cortex (S1FL). The major findings were: 1) In the S1FL, T2 increased and fractional anisotropy (FA) decreased at 3 h after TBI and gradually returned toward normal by Day 14; 2) in the S1FL, the apparent diffusion coefficient (ADC) increased at 3 h, peaked on Day 2, and gradually returned toward normal at Day 14; 3) in the corpus callosum underneath the S1FL, FA decreased at 3 h to Day 2 but returned to normal at Day 7 and 14, whereas T2 and ADC were normal throughout; 4) heterogeneous hyperintense and hypointense T2 map intensities likely indicated the presence of hemorrhage but were not independently verified; 5) lesion volumes defined by abnormal T2, ADC, and FA showed similar temporal patterns, peaking around Day 2 and returning toward normal on Day 14; 6) the temporal profiles of lesion volumes were consistent with behavioral scores assessed by forelimb placement and forelimb foot fault tests; and 7) at 14 d post-TBI, there was substantial tissue recovery by MRI, which could either reflect true tissue recovery or reabsorption of edema. Histology performed 14 d post-TBI, however, showed a small cavitation and significant neuronal degeneration surrounding the cavitation in S1FL. Thus, the observed improvement of behavioral scores likely involves both functional recovery and functional compensation.
Key words: : behavioral assessments, controlled cortical impact, diffusion tensor imaging, immunohistochemistry, quantitative magnetic resonance imaging, TBI
Introduction
Traumatic brain injury (TBI) is a leading cause of death and disability, affecting 3.5 million American civilians, with an annual cost exceeding $60 billion.1 In addition, more than 270,000 U.S. Service Members have been diagnosed with TBI since the beginning of the global war on terrorism (http://dvbic.dcoe.mil). Following the primary physical impact, progressive secondary injuries occur, including cytotoxic and vasogenic edema, microstructural changes, and diffuse axonal injury.2,3 Improved characterization of the spatial temporal dynamics of these secondary injuries is important because it could improve diagnosis, staging of injury, and evaluation of novel treatments.
Magnetic resonance imaging (MRI) offers the means to non-invasively probe many of these secondary injuries. MRI has been used to image anatomical, physiological, and functional changes associated with TBI in a longitudinal manner.4,5 T1 and T2 anatomical MRI allows for visualization of gross structural damage, possible hemorrhage, and vasogenic edema in TBI.6,7 Diffusion weighted imaging,8 in which contrast is based on the apparent diffusion coefficient (ADC) of water, can detect ischemic brain injury within minutes. ADC reduction is often attributed to cytotoxic edema, a common feature of TBI.9–11 Diffusion tensor imaging (DTI) provides both magnitude and directional information about water diffusion and thus has been used to detect changes in fiber tracts following TBI.12 Fractional anisotropy (FA), an index of anisotropy of water motion from DTI measurements, is sensitive to white-matter injury and microstructural changes13,14 and diffuse axonal injury14–18 in TBI.
Rodent models have been widely utilized to study TBI and they include the controlled cortical impact (CCI), fluid percussion, acceleration-impact or weight drop, Marmarou, Feeney, and blast injury models.19,20 The common areas of impact included somatosensory/motor, auditory, parietal, and visual cortices. Outcomes and lesion sizes are highly variable due to the use of different experimental models, each with different injury parameters.19,20 Surprisingly, there have only been a few quantitative multimodal MRI studies of animal models of TBI with behavioral and histological correlation. Quantitative multimodal MRI has been used to study the fluid percussion injury model21 but not the CCI model,16 with the latter being considered more reproducible and with lower rates of morbidity.
The goal of this study was to apply multi-parametric quantitative MRI to systemically characterize the spatiotemporal dynamics of T2, ADC, FA, and lesion volume, in the gray and white matter following an open-skull CCI model of mild TBI in rats. The impact was applied over the left primary forelimb somatosensory cortex (S1FL). MRI measurements were made longitudinally from 3 h to up to 14 d post-TBI. Comparisons were made with longitudinal behavioral assessments (foot fault and forelimb asymmetry test)22–24 and end-point histology (Nissl staining).
Methods
Animal preparations
All animal procedures were approved by the Institutional Animal Care and Use Committee of the University of Texas Health Science Center San Antonio. The induction of TBI was done as previously described.25 Briefly, male Sprague Dawley rats (250–350 g; n=6) were anesthetized initially with 5% isoflurane mixed with room air and maintained at 1.2% isoflurane throughout all surgical and imaging procedures. The animal was secured in a stereotaxic frame and an incision was made at the level of the cerebellum as posterior from the impact site as possible to prevent artifacts during MRI acquisition, and the periosteum was removed over the impact site. A Ø5mm craniotomy was created over the left S1FL (+0.25mm anterior and 3.5 mm lateral to bregma), exposing the dura matter. The intact dura matter was impacted using a pneumatic-controlled cortical impactor (Precision Systems and Instrumentation, LLC, Fairfax Station, VA) fitted with a Ø3mm tip (5.0 m/s, 250 μs dwell time, 1 mm depth) to mimic a mild focal TBI. Following the impact, the cranial opening was sealed with bone wax, the scalp sutured closed, and antibiotic ointment applied. Saline was injected under the skin to facilitate the removal of air pockets between the scalp and the skull to minimize artifacts during MRI acquisition. Buprenex (0.05 mg/kg) was given subcutaneously every 12 h for 3 d for pain.
MRI was acquired on the day of the TBI procedure (1–3 h post-TBI), and again on Days 1, 2, 7, and 14 after TBI onset. Behavioral assessments were made 1–3 d prior to TBI and again 1, 2, 7, and 14 d post-TBI prior to the MRI experiments in the same animals. Behavioral tests were not performed on the day of TBI induction due to incomplete recovery from anesthetic. Immunohistology was done after MRI on Day 14 post-TBI. The 14 d endpoint was selected based on a subset of studies in which no apparent difference was observed in lesion volumes between 14 and 28 d post-TBI.
MRI
MRI was performed on a rodent Bruker 7-Tesla Pharmascan Scanner with 16-cm clear bore diameter under 1.5% isoflurane. The animal was secured in a custom-built MRI-compatible rat head stereotaxic holder with ear and tooth bars.
Diffusion tensor-weighted MRI (3.5 mins)
DTIs were obtained with a single low b-value (10 sec/mm2) in 30 directions with a 1200 sec/mm2 bmax-value. Echo planar imaging (EPI) scans with partial Fourier (5/8) also were acquired using the following settings: seven 1.0-mm coronal images, field of view (FOV)=2.56×2.56 cm, matrix 96×96 and reconstructed to 128×128, single shot, repetition time (TR)=3 sec, echo time (TE)=32 msec, Δ=14 ms, δ=5 msec, and 2 transients for signal averaging.26–28
T2 map (9.5 mins)
T2-weighted images were acquired using a fast spin-echo sequence with TR=3 sec (90o flip angle), effective TE=18, 54, 90 and 126 msec, 4 echo train lengths, where the center of the echo train was taken as the effective TE for T2 calculation. The other parameters were: seven 1.0-mm coronal images, FOV=2.56×2.56 cm, matrix 96×96 and reconstructed to 128×128, and 8 transients for signal averaging. The contralateral hemisphere T2 was used as the internal control (note that although there are changes in the molecular or cellular levels in the contralateral hemisphere, these changes did not alter T2 values).
Image analysis
ADC, FA, and T2 maps were calculated as previously described.26,29,30 Image maps of individual subjects were co-registered across time points via the application of a transformation matrix generated by QuickVol and MRIAnalysisPak software.31,40 Regions of interest (ROIs) were defined by pixels that had T2 values higher than the mean plus 2 standard deviations of the value in the homologous contralesional region. The ROIs used to determine T2 lesion volumes were also used to tabulate the T2, ADC, and FA values across all time points using Stimulate software (University of Minnesota).
Functional assessment
Sensorimotor function was assessed using the asymmetry forelimb placement (cylinder) test and foot-fault test.25 Previous behavioral studies have demonstrated that these functional tests have the appropriate sensitivity for this injury models.22–24 Testing was conducted 1–3 d prior to TBI and again 1, 2, 7, and 14 d post-TBI.
The forelimb asymmetry placement test was performed with videotaping to assess the use of forelimbs during exploration of the cylinder. The rat was placed in a transparent cylinder (20 cm diameter, 30 cm height) for 5 min or until 30 placements were made. A mirror was positioned under the cylinder to enable the video recorder to see directly into the cylinder. Behavior was scored by counting the number of left or right individual forelimb placements, and the number of simultaneous right and left (both) forelimb placements onto the wall of the cylinder during rearing. The forelimb asymmetry index was calculated as (the number of forelimb placements for each individual limb)+0.5 (number of both placements) divided by the total number of placements.
The forelimb foot fault test was performed with videotaping to assess forelimb misplacement during locomotion. The rat was placed on an elevated grid floor (size, 18×11 inches with grid openings of 1.56×1.00 inches) for 5 min or until 50 steps were taken with one (non-affected) forelimb. The rat was allowed to move freely on the grid and the total number of steps and the number of times each limb fell below the grid opening were counted. The percentage of foot faults for each limb was calculated as the number of right or left forelimb foot faults divided by the total number of steps taken.
Nissl staining
Nissl staining was used to measure morphological changes within and around the impact following TBI as described in Watts and colleagues.25 Briefly, anesthetized rats were perfused on Day 14 post-TBI with ice-cold heparinized phosphate buffered saline, followed by ice-cold 4% buffered paraformaldehyde (PFA). Brains were removed and post-fixed with 4% PFA and subsequently cryopreserved (30% sucrose) for 48 hours at 4°C. Coronal section measuring 25-μm were affixed to gelatin coated slides and dried overnight at 37°C. Slides were hydrated through a series of graded alcohols to distilled water, followed by 0.1% cresyl violet acetate for 7 min. Brain sections were then dehydrated, cleared in Histoclear, and coverslipped with Permount mounting medium.
Images were acquired on an Olympus BX60F microscope equipped with an Olympus DP70 camera. A 5×objective was utilized to acquire images for mosaic full brain images assimilated using Microsoft ICE software. Intact neurons were defined as nonbasophilic neurons with pale nuclei and discrete nucleoli and that had an intact neuronal body. Dark stained neurons were defined as neurons with abnormal morphology, such as hyperbasophilic neurons and those with shrunken morphology.
For quantitative analysis, four brain slices from each animal were obtained to carefully represent the T2 MRI that showed the lesion. Histological slices were carefully co-located with the MRI slices based on anatomical features present in both. Ten regions from each slice located under the impact zone were imaged at 60×(175 μm×175 μm) by sampling beginning directly under the impact zone 3.5 mm from the median plane and 1.5 mm from the edge of the cortex, and on either side of and below this area in two rows spaced 250 μm apart (see Fig. 8A for representative imaging locations). For each slice, 10 corresponding regions on the contralateral side also were imaged for comparison. The numbers of dark stained cells were counted and averaged per field. Results were expressed as the number of Nissl dark-stained cells per field.
FIG. 8.

Histological staining 14 d post- traumatic brain injury (TBI). (A) Mosaic Nissl image of a TBI animal. The smaller black boxes indicate the location of the magnified images shown in 8C. The larger black boxes indicate the area used for quantitative analysis in 8D. (B) Representative T2 image from the corresponding slice of the same animal shown in A at 14 d post-TBI. (C) Magnified images from the contralesional and ipsilesional cortex of a TBI animal were obtained using a 60×objective. The red arrows indicate atypical dark-stained neurons. (D) Bar graph of the number of dark-stained Nissl bodies counted per field from the ipsilesional and contralesional cortices for TBI animals (mean±standard error of the mean; n=6 each group; ***p<0.001). (E) Magnified images from the contralesional and ipsilesional cortex of a TBI animal were obtained using a 60×objective. The red arrows indicate a Fluro-Jade–positive neuron. (F) Bar graph of the number of Fluro-Jade–positive cells counted per field from the ipsilesional and contralesional cortices for TBI animals (mean±standard error of the mean; n=6 each group; ***p<0.001). Color image is available online at www.liebertpub.com/neu
Fluro-Jade B staining
Fluro-Jade B was used to stain degenerating neurons.32,33 Frozen sections measuring 30 μm were incubated in a solution of 1%NaOH in 80% ethanol for 5 min followed by hydration in graded ethanols (75%, 50%, and 25%) to distilled water. The sections were then incubated for 10 min in 0.06% potassium permanganate, rinsed with distilled water, and incubated in 0.004% Fluro-Jade B (Hist-Chem Inc, Jefferson, AR) for 20 min. Sections were rinsed with distilled water three times for two min each. The slides were dried on a slide warmer for 10 min, cleared with Histoclear and coverslipped with DPX (Fluka). Images were acquired on a Nikon C1si microscope using a 60×water immersion objective. Image analysis was done as described for Nissl staining, counting Fluro-Jade–positive cells per field.
Statistical analysis
Paired t-tests were used to compare T2, ADC, and FA abnormality between the ipsilesional and contralesional sides. Values are presented as mean±standard error of the mean (SEM). Statistical significance was set at p<0.05. Multiple regression analysis was performed to determine the correlation between T2, ADC, and FA abnormality and asymmetry scores or foot fault scores. The differences in the number of dark-stained Nissl neurons and Fluro-Jade B–positive cells between ipsilesional and contralesional animals were assessed using unpaired two-tailed t-tests.
Results
T2 lesion values
Figure 1A shows representative multi-slice T2 maps from a single animal at 3 h and at 1, 2, 7, and 14 d post-TBI. T2 MRI at 3 h after TBI showed apparent changes. The T2 map below the impacted area (S1FL cortex) showed heterogeneous contrast across different time points, with hyperintensity indicating vasogenic edema and hypointensity indicating possible hemorrhage.
FIG. 1.
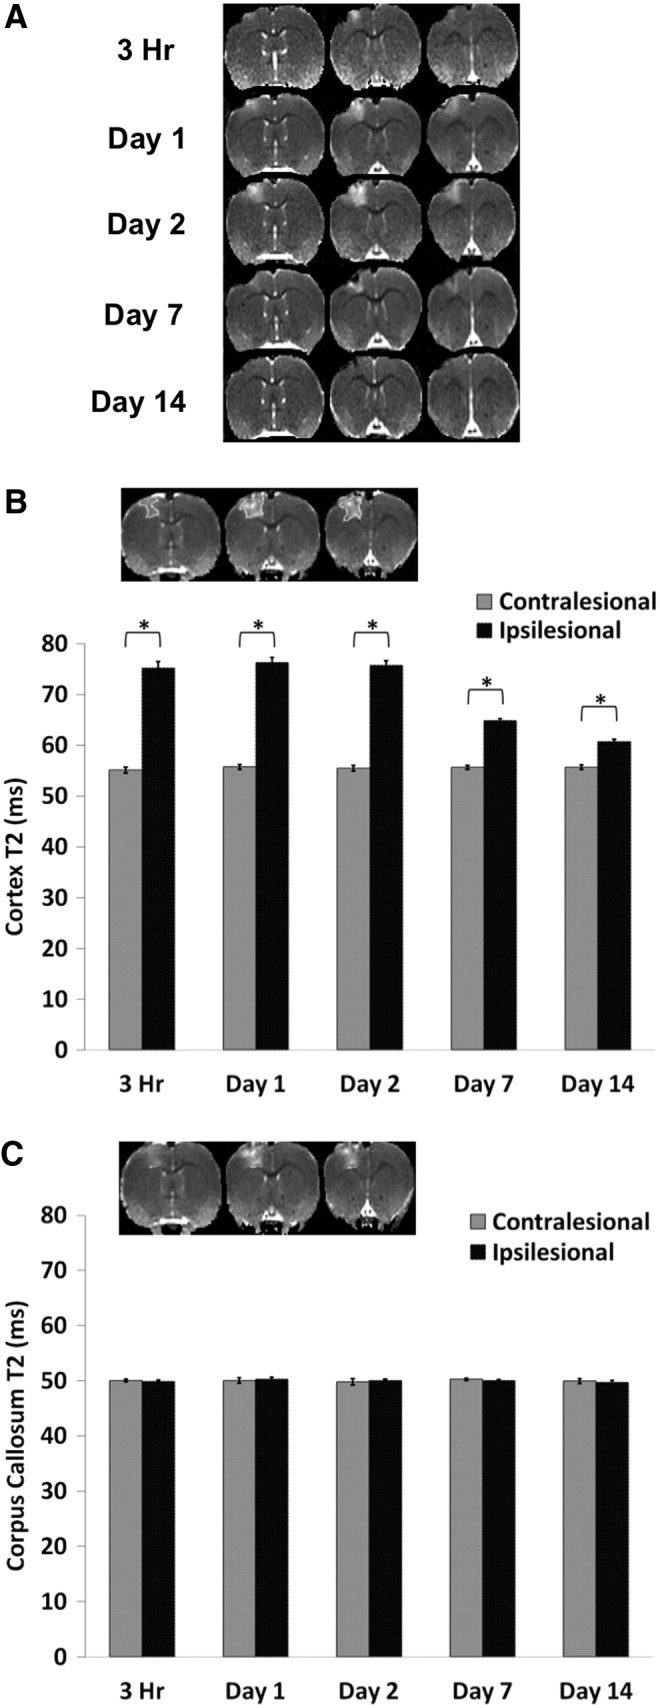
T2 magnetic resonance imaging. (A) Representative T2 maps are shown for subjects at 3 h and at 1, 2, 7, and 14 d post–traumatic brain injury. (B) The bar graph shows the temporal progression of T2 values for the ipsilesional and contralesional cortices. The inset shows the typical regions of interest (ROIs) derived from threshold method used to tabulate T2 in the primary forelimb somatosensory cortex. Homologous contralateral ROIs were used for comparison. (C) The typical ROI used to tabulate T2 in the corpus callosum. The bar graph shows the temporal progression of T2 values for the ipsilesional and contralesional corpus callosum (mean±standard error of the mean; n=6; *p<0.05 between ipsilesional and contralesional sides).
For quantitative analysis, T2 values were tabulated using the same threshold-based ROIs for all time points (Fig. 1B). In the ipsilesional S1FL cortex, T2 MRI values were elevated at 3 h, remained elevated on Days 1 and 2, and returned toward (but did not reach) normal values at Days 7 and 14. In the contralesional S1FL cortex, by contrast, T2 values did not change substantially across all time points studied (55±2 msec). In the corpus callosum, the ipsilesional T2 values were not significantly different from contralesional values at all time-points studied (Fig. 1C).
ADC lesion values
Figure 2A shows representative multi-slice ADC maps from a single animal at 3 h and at 1, 2, 7, and 14 d. The ADC maps below the impacted area (S1FL cortex) showed heterogeneous contrast (i.e., 3 h and 1 d), with hyperintensity indicating vasogenic edema and hypointensity indicating possible cellular or cytotoxic edema. The ROIs used to determine ADC values were the same as those used to obtain T2 values. In the S1FL ipsilesional S1FL cortex, ADC was significantly elevated at 3 h, peaked on Day 2, and returned toward (but did not reach) normal values on Day 14 (Fig. 2B). In the contralesional S1FL cortex, by contrast, ADC values did not change substantially across any time point studied. In the corpus callosum, ipsilesional ADC values were not significantly different from contralesional values except at the 3 h time point, in contrast to the S1FL cortex (Fig. 2C).
FIG. 2.
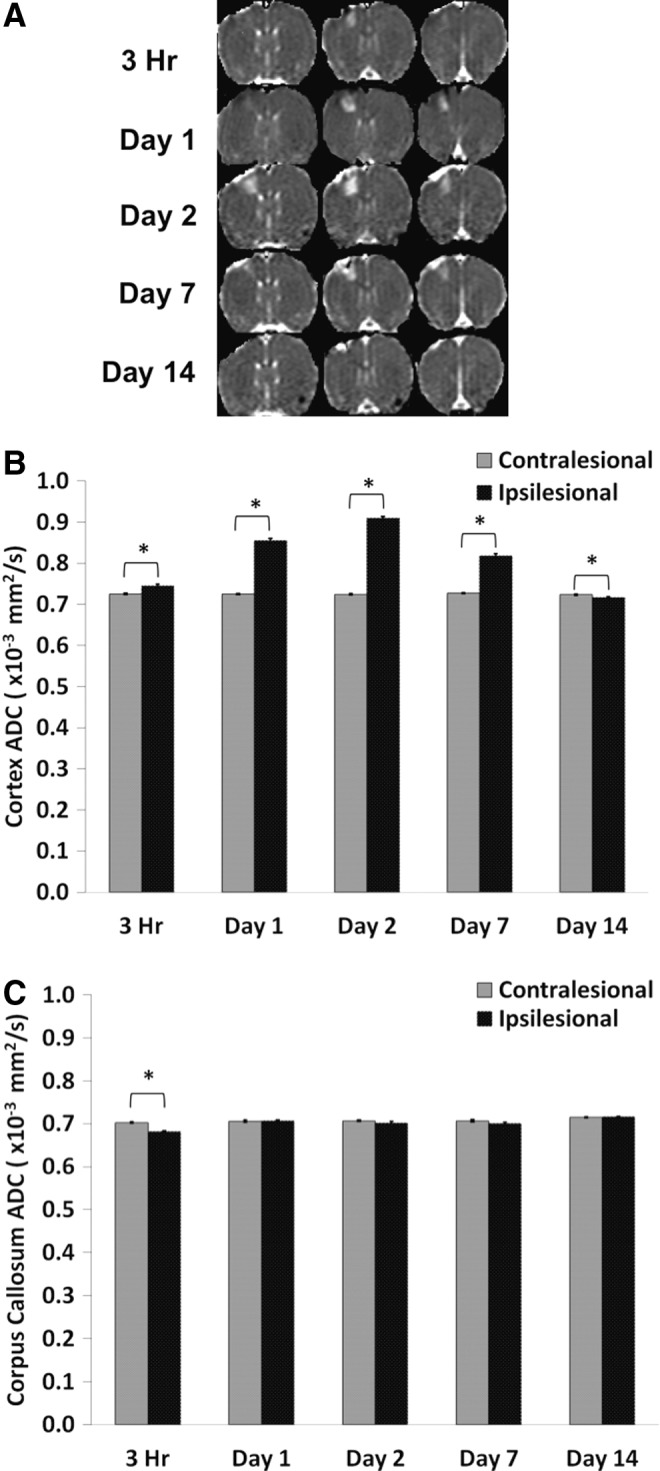
(A) Representative apparent diffusion coefficient (ADC) maps are shown for subjects at 3 h, and at 1, 2, 7, and 14 d post-TBI. (B) Bar graph showing the temporal progression of ADC values for the ipsilesional and contralesional cortices. (C) Bar graph indicating the temporal progression of ADC values for the ipsilesional and contralesional corpus callosum (mean±standard error of the mean; n=6; *p<0.05 between ipsilesional and contralesional sides).
FA lesion values
Figure 3A shows representative multi-slice FA maps from a single animal at 3 h, and at 1, 2, 7 and 14 d. Abnormal FA was apparent within 3 h of the impact. In the S1FL ipsilesional cortex, FA was significantly reduced at 3 h, remained reduced on Days 1, 2, and 7 but returned toward normal values on Day 14 (Fig. 3B). In the contralesional S1FL cortex, by contrast, FA values did not change substantially at any time point studied. In the corpus callosum, ipsilesional FA values were significantly different from contralesional FA values at 3 h and Days 1 and 2, but not on Days 7 and 14 (Fig. 3C).
FIG. 3.
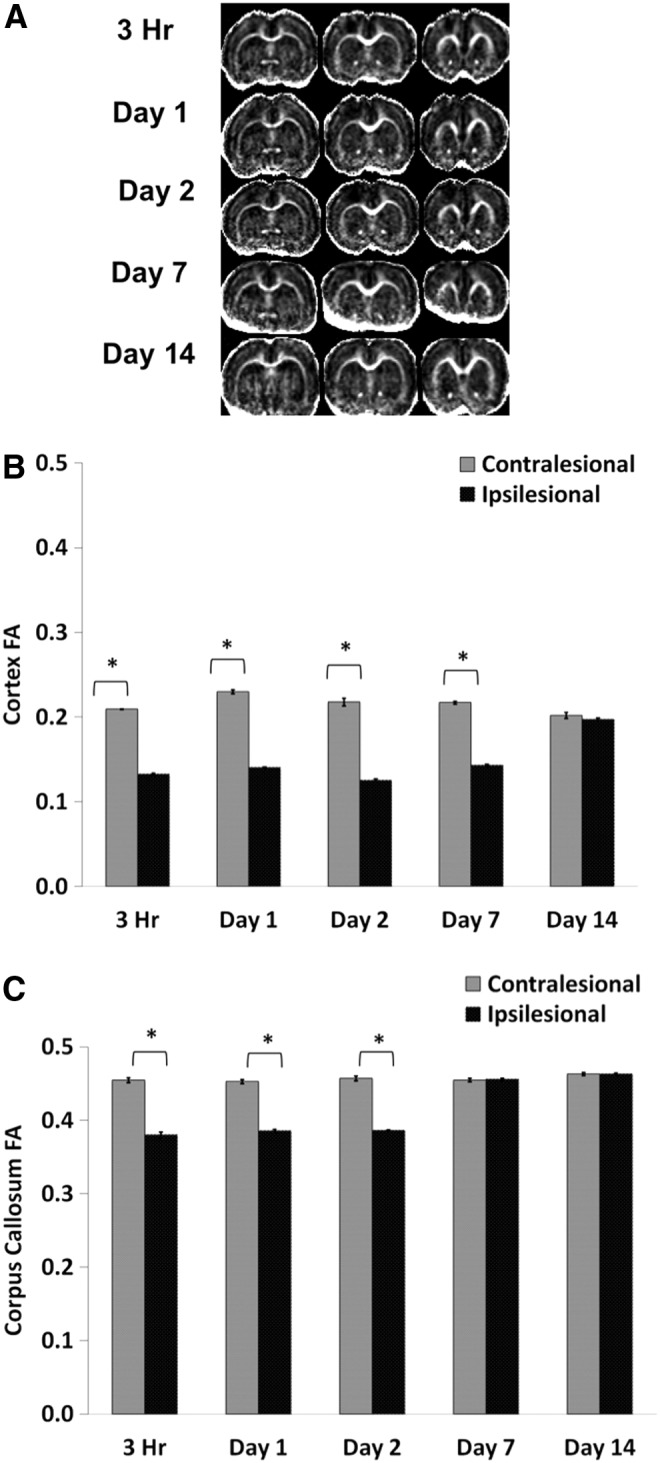
(A) Representative fractional anisotropy (FA) maps are shown for subjects at 3 h and at 1, 2, 7, and 14 d post–traumatic brain injury. (B) Bar graph showing the temporal progression of FA values for the ipsilesional and contralesional cortices. (C) Bar graph indicating the temporal progression of FA values for the ipsilesional and contralesional corpus callosum (mean±standard error of the mean; n=6; *p<0.05 between ipsilesional and contralesional sides).
Lesion volumes
Figure 4 depicts the averaged temporal progression of lesion volumes defined by abnormal T2, ADC, and FA following TBI. T2, ADC and FA lesion volumes consistently peaked on Day 2 and were markedly reduced by Day 14.
FIG. 4.

Line graph of lesion volumes defined by T2, apparent diffusion coefficient (ADC), and FA changes at 3 h and at 1, 2, 7, and 14 d post-TBI (mean±standard error of the mean; n=6 each group). Lesion volumes were determined as pixels that had T2, ADC, or fractional anisotropy (FA) values higher than the mean plus 2 standard deviations of the value in the homologous contralesional region.
Correlation with behavioral outcomes
The mean scores for the behavioral tests (foot fault and forelimb asymmetry) are shown in Figure 5A and 5B. Pre-TBI foot fault scores were 5.13±0.64%. Following TBI, foot fault scores were the worst in the affected forelimb on Day 1 (17.1±3.2%), improved slightly on Days 2 and 7 post-TBI, and returned toward the pre-TBI value on Day 14 (9.5±2.5%). Pre-TBI forelimb asymmetry was 52±2%, indicating symmetrical use of both forelimbs. The asymmetry score was the worst on Days 1 and 2 post-TBI (65%±5% and 63%±2%, respectively), indicating increased utilization of the unaffected forelimb.
FIG. 5.
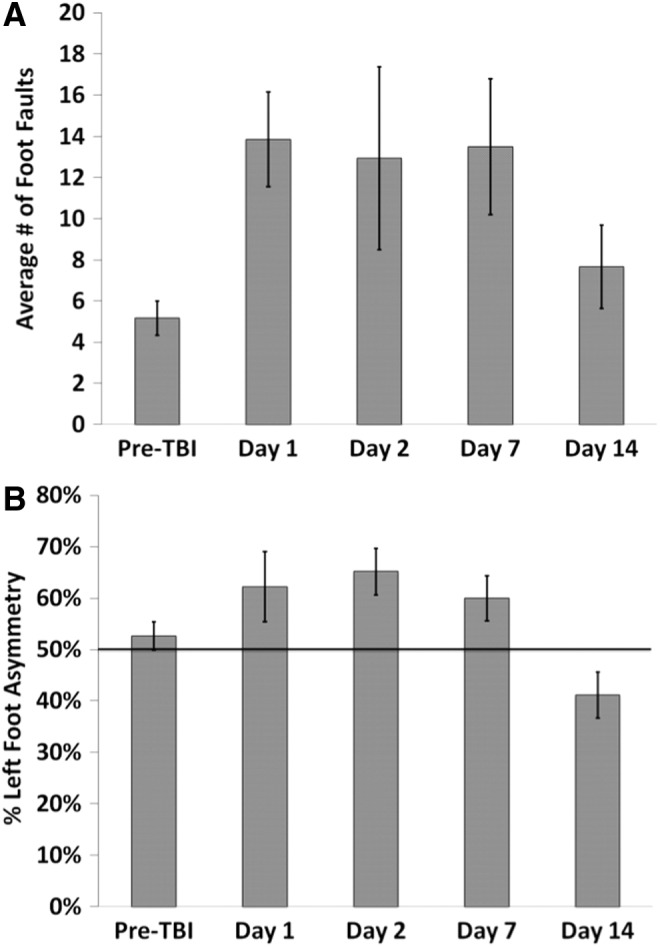
Bar graphs of the (A) foot fault and (B) asymmetry tests for subjects at pre-traumatic brain injury (TBI) and at 1, 2, 7, and 14 d post-TBI (mean±standard error of the mean; n=6 each group).
Correlation of foot fault scores with T2 yielded an R2 value of 0.474 (p=0.014; Fig. 6A), with ADC yielded an R2 value of 0.498 (p=0.009; Fig. 6B), and with FA yielded an R2 value of 0.489 (p=0.011; Fig. 6C).
FIG. 6.
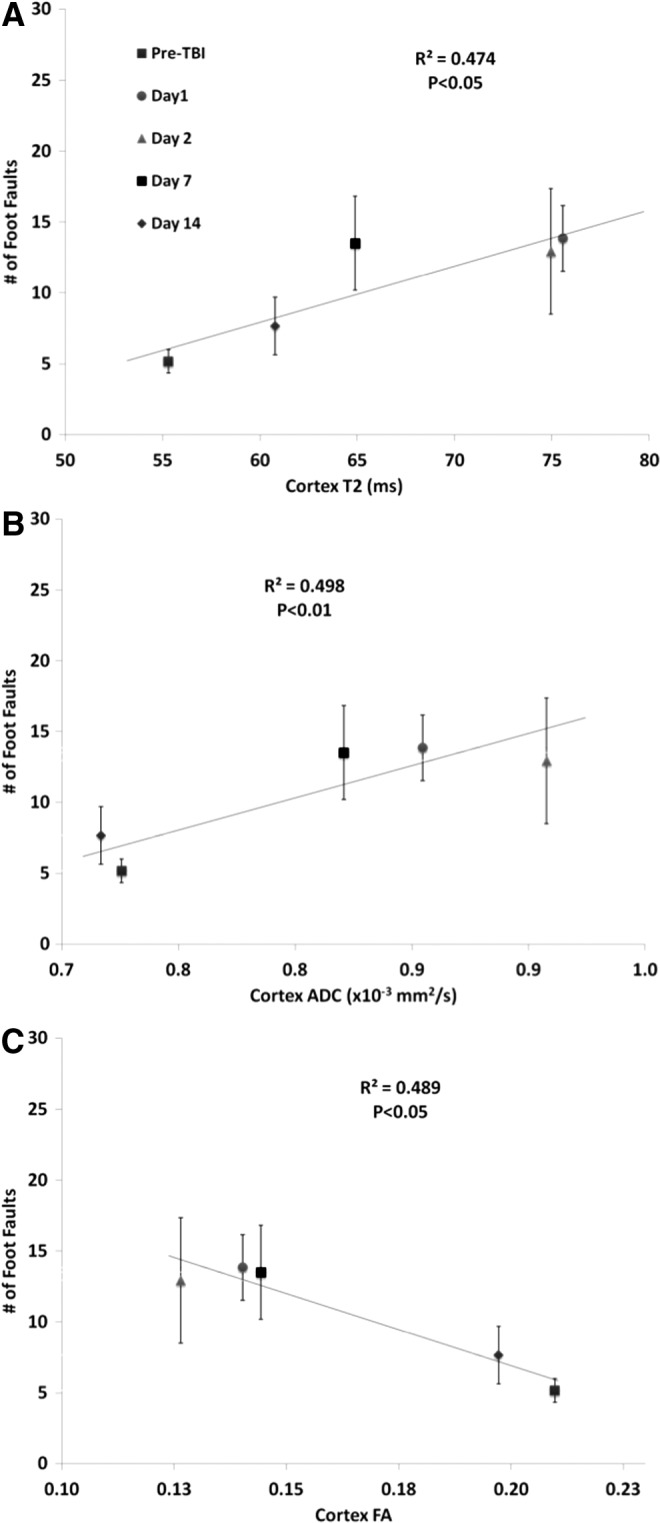
Multiple regression correlation of forelimb asymmetry values versus (A) T2, (B) apparent diffusion coefficient (ADC), and (C) fractional anisotropy (FA). Different symbols indicate data at 3 h and at, 1, 2, 7, and 14 d post-TBI.
Correlation of forelimb asymmetry with T2 yielded an R2 value of 0.512 (p=0.007; Fig. 7A), with ADC yielded an R2 value of 0.605 (p=0.001; Fig. 7B), and with FA yielded an R2 value of 0.547 (p=0.004; Fig. 7C).
FIG. 7.

Multiple regression correlation of foot fault values versus (A) T2, (B) apparent diffusion coefficient (ADC), and (C) fractional anisotropy (FA). Different symbols indicate data at 3 h and at 1, 2, 7, and 14 d post- traumatic brain injury (TBI).
Immunohistology
Nissl and Fluro-Jade B staining was analyzed for the ipsilesional and contralesional primary somatosensory cortex below the impact zone on Day 14 after TBI (Fig. 8). There was some tissue cavitation or tissue loss in the impact region (red arrows) and on the surface lateral to the impact region (white arrows) detectable by Nissl stain. The abnormality on T2 MRI also was evident albeit less apparent. The expanded region of the Nissl stain showed abnormally appearing cells with dark-stained and irregular morphology (red arrows) in the ipsilesional ROI, compared with the contralesional ROI.
The group-averaged number of Nissl dark-stained cells in the ipsilesional S1 cortex (57±2 cells/field) was significantly different from that in the contralesional S1 cortex (38±4 cells/field, mean±SEM; n=6; ***p<0.001; Fig. 8D). Note that Figure 8D underestimated the extent of overall damage because of the cavitation. Similarly, group-averaged number of Fluro-Jade–positive cells detected a significant increase in the ipsilesional S1 cortex (305±39 cells/field) compared to the contralesional S1 cortex (158±14 cells/field; mean±SEM; n=6; ***p<0.001; Fig. 8F).
Discussion
Quantitative multi-parametric MRI was used to systematically characterize the spatiotemporal evolution of TBI in an open-skull CCI model in rats. The major findings are: 1) in the S1FL, increased T2 and decreased fractional anisotropy (FA) were apparent 3 h after TBI and gradually returned toward normal by Day 14; 2) in the S1FL, increased ADC was observed at 3 h, peaked on Day 2, and gradually returned toward normal at Day 14; 3) in the corpus callosum underneath the S1FL, FA was abnormal at 3 h to Day 2 and returned to normal at Days 7 and 14, whereas T2 and ADC were normal throughout; 4) heterogeneous hyperintense and hypointense T2 map intensities likely indicated the presence of hemorrhage but were not independently verified; 5) lesion volumes defined by abnormal T2, ADC, and FA showed similar temporal patterns, peaking around Day 2 and returning toward normal on Day 14; 6) lesion volumes were temporally correlated with behavioral scores by forelimb placement and forelimb foot fault tests; and 7) at 14 d post-TBI, there was substantial tissue recovery by MRI, which could either reflect true recovery or reabsorption of edema. Histology at 14 d post-TBI, however, showed a small cavitation and significant neuronal degeneration surrounding the cavitation in S1FL. Thus, the observed improvement of behavioral scores likely involved both functional recovery and functional compensation.
Minimize susceptibility artifacts
EPI is often used for DTI acquisition due to its high speed of image acquisition. The surgical disruption of the scalp and cranial opening were found to alter magnetic field homogeneity, resulting in signal drop off and image distortion. Thus, the procedure for craniotomy was modified to minimize signal drop off and image distortion. First, the skin was cut at the level of the cerebellum, away from the S1FL region. After the impact, blood emanating from the dura was gently dried with a sterile swab. Bone wax was used to close the hole in the skull. Saline was infused into the undermined space between the soft tissue and the skull. Next, the skin was smoothed to force excess saline and air from the undermined space. Then the skin incision was neatly sutured close to minimize physical disruption of the scalp.
Cortical changes
In the hyper-acute phase (3 h) of TBI, the heterogeneous ADC decreases and increases around the impacted area indicated a combination of cytotoxic and vasogenic edema, respectively. Heterogeneous T2 decreases and increases around the impact areas reflected possible hemorrhage and vasogenic edema, respectively. FA decreases also were observed in the hyper-acute phase, suggesting there were microstructural disruptions. One day after TBI, ADC and T2 increased above normal, suggesting vasogenic edema dominated the lesion site following TBI. Cytotoxic edema (which would have caused reduced ADC, per se) might be present but was masked by the effects of vasogenic edema. FA remained below normal, suggesting perturbed microstructural integrity. ADC, T2, and FA slowly returned toward normal values by Day 14. The lesion volumes were markedly reduced by Day 14. Behavioral outcome strongly correlated with lesion volumes, supporting functional improvement by Day 14. Histological analysis of impact area showed some residual cell death. Although ADC, T2 and FA were mostly normal by Day 14, these parameters might have pseudo-normalized.
Surprisingly, there have been only a few quantitative multimodal MRI studies of animal models of TBI with behavioral and histological correlation, and most of these studies used the fluid percussion injury model21 and some used the CCI model.16 Barzo and colleagues10 observed a transient increase in brain water content and ADC during the first 60 min following experimental impact-acceleration induced closed head injury (450 g brass weight released at a height of 2 m). This transient increase in ADC, however, was followed by a gradual decrease in ADC reaching a minimum value on Days 7 to 14. The brain water content continued to stay elevated through Days 7 and 14. The authors suggested that the decrease in ADC, in conjunction with increased brain water content, is indicative of cytotoxic edema and is considered the main contributing factors in the post-traumatic swelling following diffuse closed head injury. The delayed ADC decrease is in contrast to our data. This is likely a characteristic of the differences between the two experimental TBI models.
Xu and colleagues34 found FA increased and ADC decreased in the ipsilesional cortex at 2 h and 4 h using an open-skull CCI rat model (5 m/sec, 1 mm depth, and 50 msec dwell time). Their finding of ADC decreases following TBI is in contrast to our data. This could be because of the differences in TBI model or severity of injury. The extent of cytotoxic and vasogenic edema could be dependent on the TBI model and injury severity reported across different laboratories.
Pasco and colleagues35 observed massive and rapid edema formation in a model of moderate fluid percussion lateral brain injury over the left auditory cortex (2.0±1 atmospheres). This included a decrease in ADC at 1–2 h post-TBI followed by a gradual increase in ADC starting at 24 h post-TBI until normalization by 72 h post-TBI. At one week post-TBI, a significantly increased ADC was detected. This increase was much less subtle in our CCI experimental model of mild TBI, which could be due to a difference in injury location or perhaps a fundamental difference between moderate fluid percussion and CCI experimental TBI models.
Lescot and colleagues36 studied an experimental moderate fluid percussion TBI model (1.6–1.8 bar) induced lateral to the parietal cortex using T2-weighted and DWI 24 h, 48 h, and 7 d post-TBI. They found that T2 increases and ADC decreases in the ipsilesional cortex at 24 and 48 h post-TBI. At 7 d post-TBI, ADC was slightly elevated but not statistically significant from the contralesional side. This drop in ADC during the first 48 hours post-TBI appears to be characteristic of experimental lateral fluid percussion models and not indicative of CCI TBI models.
Immonen and colleagues21 measured T2, T1ρ, average ADC, lesion hyperintensity, and intracerebral hemorrhages at 3 h, 3 d, 9 d, and 23 d post-TBI, and found that these MRI parameters could predict functional (Morris water maze) and histopathological outcomes six to 12 months following severe fluid percussion injury (2.6–3.3 atm). Additionally, early quantitative MRI predicted final lesion volume and the amount of intracerebral hemorrhage correlated with the amount of final cortical tissue cavitation.
In sum, our findings showed some similarities and differences with published experimental models of TBI, underscoring the variability among different experimental TBI models. These differences further demonstrate the need for multiple methods of analysis within the same animal to gain increased insight into the progression of a TBI.
White matter changes
We found decreased FA in corpus callosum underneath the impact area in the hours and days following injury. The physical impact likely caused disruption of the corpus callosum. ADC and T2, however, were not sensitive to changes within the corpus callosum over the time frame studied, which is not unexpected.
Relative anisotropy (RA) and axial diffusivity (AD) have been found to decrease in experimental animal models, reflecting axonal damage within the first few hours after experimental TBI. Following Marmarou acceleration impact in rats, FA and AD were significantly reduced in different regions after trauma, correlating with immune-histochemical findings at 3, 12, 24, and 72 h.37
MacDonald and colleagues16 made DTI measurements at 4–6 h, 24 h, 4 d, one week, or one month following CCI (5 m/sec, 2.5mm depth, and 100 msec dwell time) in the exposed left parietal cortex (3.0 mm anterior to lambda and 2.7 mm lateral to midline) of mice and compared the values with histological and electron microscopic characteristics of peri-contusional traumatic axonal injury. Both RA and AD decreased in the white matter 6 h to 4 d following TBI. One to four weeks after trauma, RA remained decreased, whereas AD returned to near normal values and radial diffusivity increased. The authors suggested that DTI changes could be used clinically to predict the relative time following a TBI during the acute phase. In our study, we found that in the white matter underneath the S1FL, FA was abnormal from 3 h to Day 2 but returned to normal at Days 7 and 14, whereas T2 and ADC were normal throughout. The differences in white matter disruption duration between our study and the MacDonald's study is likely due to the more severe injury in the MacDonald study.
Correlation with behavioral and immunohistological analyses
Forelimb asymmetry and forelimb foot fault behavioral tests are appropriate for evaluating functional outcome of this TBI model.24,25 We found that the ADC, FA and T2 changes generally correlated well with functional outcomes. However, there were subtle differences. For example, abnormal T2 defined lesions were still present on Days 7 and 14 but forelimb asymmetry scores returned to near normal values. These results imply that there may be functional compensations at these time points in the injury model. Foot fault scores stayed considerably below baseline values on Day 7 but returned closer to normal values on Day 14. The differences between the two behavioral tests suggest that the foot fault test might be more sensitive to mild TBI than the asymmetry test. The foot fault test requires proper limb placement and sensory feedback, whereas the asymmetry test assesses the rodent's voluntary use of the forelimbs during upright exploration.23 Both behavioral tests showed different but complementary sensitivities to TBI injury. Future studies will utilize more sensitive tests as such Vermicelli handling test to further define behavioral outcomes.38
It is challenging to quantitatively compare histology and MRI data because of their grossly different spatial resolutions. Moreover, they also measured different aspects of injury. Nonetheless, qualitative comparison with Nissl and Fluro-Jade was helpful. Nissl staining showed significant tissue cavitation at the site of impact, whereas the cavitation revealed by T2 and ADC MRI were smaller in volume at Day 14. Nissl staining showed substantial abnormal cells (neuronal degeneration) surrounding the cavitation whereas T2 and ADC MRI largely appeared normal at Day 14. This is likely because T2 and ADC pseudo-normalized. Quantitatively, there were more Nissl dark-stained cells in the ipsilesional side than in the contralesional side (Fig. 8D). However, the Nissl dark-stained cell counts underestimated the extent of damage because of the cavitation. Further, Fluro-Jade, a more sensitive measure of neurodegeneration, detected increased numbers of degenerating neurons in the ipsilesional S1 cortex, compared with the contralesional cortex. Taken together, we concluded that there was substantial recovery following mild TBI as detected by MRI. However, such recovery is overestimated because there was some T2 and ADC pseudo-normalization. Histology showed that there was significant substantial cell death. Thus, the recovery in behavior scores was in part the result of functional compensation.
Comparison with stroke
The temporal dynamics of T2, ADC, and FA are in marked contrast to those of ischemic stroke. In ischemic stroke, ADC decreases are apparent within a few minutes, whereas T2 increases are not apparent for several hours to a day after stroke in rats. T2 hyperintensity in ischemic stroke also usually indicates irreversible injury.26,30,39 In our TBI model, T2 increases were apparent by 3 h post-TBI and likely earlier. T2 abnormality reversed after Day 2 and mostly returned toward normal by Day 14, suggesting that the initial presence of vasogenic edema following TBI is mostly reversible. Nissl staining indicated that most tissue did not become infarct, although there were indications of scattered cell death.
Conclusion
Multiparametric MRI provides valuable spatiotemporal information on the progression of structural integrity, cytotoxic and vasogenic edema in mild TBI. T2 and diffusion MRI parameters are sensitive to hyper-acute and subacute changes in TBI. There was substantial recovery 14 d in our mild TBI model as detected by MRI but it was confounded by some T2 and ADC pseudo-normalization. There was significant substantial cell death. Thus, the substantial recovery in behavior scores was in part the result of functional compensation. Serial multi-parametric MRI may prove useful for monitoring the spatiotemporal progression of TBI and novel therapeutic interventions. Future studies will investigate impacts to different brain regions (i.e., the hippocampus) and repeated close skull TBI. In addition, future studies will focus on improvement of MRI sensitivity to subtle injury and will incorporate blood flow MRI, blood volume MRI, evoked fMRI, rsfMRI, and additional behavioral measures (i.e., memory function) to further characterize TBI.
Acknowledgments
The authors wish to thank Timothy Schallert and Theresa Jones of UT Austin for their assistance in the setup of the behavioral assays utilized in this study. This work was supported in part by NIH/NINDS R01 NS45879 (TQD), a TL1 grant (JAL) and KL2 TR001118 (LTW) via the Clinical Translational Science Awards (CTSA, parent grant UL1TR000149 and TL1TR001119). Images were generated in the Core Optical Imaging Facility which is supported by UTHSCSA, NIH/NCI P30CA54174 and NIH/NIA P01AG19316.
Author Disclosure Statement
No competing financial interests exist.
References
- 1.Coronado V.G., McGuire L.C., Sarmiento K., Bell J., Lionbarger M.R., Jones C.D., Geller A.I., Khoury N., and Xu L. (2012). Trends in traumatic brain injury in the U.S. and the public health response: 1995–2009. J. Safety. Res. 43, 299–307 [DOI] [PubMed] [Google Scholar]
- 2.Werner C. and Engelhard K. (2007). Pathophysiology of traumatic brain injury. Br. J. Anaesth. 99, 4–9 [DOI] [PubMed] [Google Scholar]
- 3.Blennow K., Hardy J., and Zetterberg H. (2012). The neuropathology and neurobiology of traumatic brain injury. Neuron 76, 886–899 [DOI] [PubMed] [Google Scholar]
- 4.Gardner A., Kay-Lambkin F., Stanwell P., Donnelly J., Williams W.H., Hiles A., Schofield P., Levi C., and Jones D.K. (2012). A systematic review of diffusion tensor imaging findings in sports-related concussion. J. Neurotrauma 29, 2521–2538 [DOI] [PubMed] [Google Scholar]
- 5.Albensi B.C., Knoblach S.M., Chew B.G., O'Reilly M.P., Faden A.I., and Pekar J.J. (2000). Diffusion and high resolution MRI of traumatic brain injury in rats: time course and correlation with histology. Exp. Neurol. 162, 61–72 [DOI] [PubMed] [Google Scholar]
- 6.Iwamoto Y., Yamaki T., Murakami N., Umeda M., Tanaka C., Higuchi T., Aoki I., Naruse S., and Ueda S. (1997). Investigation of morphological change of lateral and midline fluid percussion injury in rats, using magnetic resonance imaging. Neurosurgery 40, 163–167 [DOI] [PubMed] [Google Scholar]
- 7.Van Putten H.P., Bouwhuis M.G., Muizelaar J.P., Lyeth B.G., and Berman R.F. (2005). Diffusion-weighted imaging of edema following traumatic brain injury in rats: effects of secondary hypoxia. J. Neurotrauma 22, 857–872 [DOI] [PubMed] [Google Scholar]
- 8.Kubin M.Z., Parshley D.L., Din W., Waugh J.Y., Davis-Smith T., Smith C.A., Macduff B.M., Armitage R.J., Chin W., Cassiano L., Borges L., Petersen M., Trinchieri G., and Goodwin R.G. (1999). Molecular cloning and biological characterization of NK cell activation-inducing ligand, a counterstructure for CD48. Eur. J. Immunol. 29, 3466–3477 [DOI] [PubMed] [Google Scholar]
- 9.Ito J., Marmarou A., Barzo P., Fatouros P., and Corwin F. (1996). Characterization of edema by diffusion-weighted imaging in experimental traumatic brain injury. J. Neurosurg. 84, 97–103 [DOI] [PubMed] [Google Scholar]
- 10.Barzo P., Marmarou A., Fatouros P., Hayasaki K., and Corwin F. (1997). Contribution of vasogenic and cellular edema to traumatic brain swelling measured by diffusion-weighted imaging. J. Neurosurg. 87, 900–907 [DOI] [PubMed] [Google Scholar]
- 11.Liu A.Y., Maldjian J.A., Bagley L.J., Sinson G.P., and Grossman R.I. (1999). Traumatic brain injury: diffusion-weighted MR imaging findings. A.J.N.R. Am. J. Neuroradiol. 20, 1636–1641 [PMC free article] [PubMed] [Google Scholar]
- 12.Kou Z., Wu Z., Tong K.A., Holshouser B., Benson R.R., Hu J., and Haacke E.M. (2010). The role of advanced MR imaging findings as biomarkers of traumatic brain injury. J. Head Trauma Rehab. 25, 267–282 [DOI] [PubMed] [Google Scholar]
- 13.Rutgers D.R., Toulgoat F., Cazejust J., Fillard P., Lasjaunias P., and Ducreux D. (2008). White matter abnormalities in mild traumatic brain injury: a diffusion tensor imaging study. A.J.N.R. Am. J. Neuroradiol. 29, 514–519 [DOI] [PMC free article] [PubMed] [Google Scholar]
- 14.Inglese M., Makani S., Johnson G., Cohen B.A., Silver J.A., Gonen O., and Grossman R.I. (2005). Diffuse axonal injury in mild traumatic brain injury: a diffusion tensor imaging study. J. Neurosurg. 103, 298–303 [DOI] [PubMed] [Google Scholar]
- 15.Nakayama N., Okumura A., Shinoda J., Yasokawa Y.T., Miwa K., Yoshimura S.I., and Iwama T. (2006). Evidence for white matter disruption in traumatic brain injury without macroscopic lesions. J. Neurol. Neurosurg. Psychiatry 77, 850–855 [DOI] [PMC free article] [PubMed] [Google Scholar]
- 16.Mac Donald C.L., Dikranian K., Bayly P., Holtzman D., and Brody D. (2007). Diffusion tensor imaging reliably detects experimental traumatic axonal injury and indicates approximate time of injury. J. Neurosci. 27, 11869–11876 [DOI] [PMC free article] [PubMed] [Google Scholar]
- 17.van de Looij Y., Mauconduit F., Beaumont M., Valable S., Farion R., Francony G., Payen J.F., and Lahrech H. (2012). Diffusion tensor imaging of diffuse axonal injury in a rat brain trauma model. N.M.R. Biomed. 25, 93–103 [DOI] [PubMed] [Google Scholar]
- 18.Arfanakis K., Haughton V.M., Carew J.D., Rogers B.P., Dempsey R.J., and Meyerand M.E. (2002). Diffusion tensor MR imaging in diffuse axonal injury. A.J.N.R. Am. J. Neuroradiol. 23, 794–802 [PMC free article] [PubMed] [Google Scholar]
- 19.Cernak I. (2005). Animal models of head trauma. NeuroRx 2, 410–422 [DOI] [PMC free article] [PubMed] [Google Scholar]
- 20.Xiong Y., Mahmood A., and Chopp M. (2013). Animal models of traumatic brain injury. Nat. Rev. Neurosci. 14, 128–142 [DOI] [PMC free article] [PubMed] [Google Scholar]
- 21.Immonen R.J., Kharatishvili I., Grohn H., Pitkanen A., and Grohn O.H. (2009). Quantitative MRI predicts long-term structural and functional outcome after experimental traumatic brain injury. NeuroImage 45, 1–9 [DOI] [PubMed] [Google Scholar]
- 22.Hernandez T.D. and Schallert T. (1988). Seizures and recovery from experimental brain damage. Experimental neurology 102, 318–324 [DOI] [PubMed] [Google Scholar]
- 23.Baskin Y.K., Dietrich W.D., and Green E.J. (2003). Two effective behavioral tasks for evaluating sensorimotor dysfunction following traumatic brain injury in mice. J. Neurosci. Methods 129, 87–93 [DOI] [PubMed] [Google Scholar]
- 24.Soblosky J.S., Matthews M.A., Davidson J.F., Tabor S.L., and Carey M.E. (1996). Traumatic brain injury of the forelimb and hindlimb sensorimotor areas in the rat: physiological, histological and behavioral correlates. Behav. Brain Res. 79, 79–92 [DOI] [PubMed] [Google Scholar]
- 25.Watts L.T., Long J., Chemello J., Van Koughnet S., Fernandez A., Huang S., Shen Q., and Duong T.Q. (2014). Methylene Blue is neuroprotective against mild traumatic brain injury. J. Neurotrauma. 31, 1063–1071 [DOI] [PMC free article] [PubMed] [Google Scholar]
- 26.Shen Q., Ren H., Cheng H., Fisher M., and Duong T.Q. (2005). Functional, perfusion and diffusion MRI of acute focal ischemic brain injury. J. Cereb. Blood Flow Metab. 25, 1265–1279 [DOI] [PMC free article] [PubMed] [Google Scholar]
- 27.Sicard K.M. and Duong T.Q. (2005). Effects of hypoxia, hyperoxia and hypercapnia on baseline and stimulus-evoked BOLD, CBF and CMRO2 in spontaneously breathing animals. NeuroImage 25, 850–858 [DOI] [PMC free article] [PubMed] [Google Scholar]
- 28.Sicard K., Shen Q., Brevard M.E., Sullivan R., Ferris C.F., King J.A., and Duong T.Q. (2003). Regional cerebral blood flow and BOLD responses in conscious and anesthetized rats under basal and hypercapnic conditions: implications for functional MRI studies. J. Cereb. Blood Flow Metab. 23, 472–481 [DOI] [PMC free article] [PubMed] [Google Scholar]
- 29.Danker J.F. and Duong T.Q. (2007). Quantitative regional cerebral blood flow MRI of animal model of attention-deficit/hyperactivity disorder. Brain Res. 1150, 217–224 [DOI] [PMC free article] [PubMed] [Google Scholar]
- 30.Shen Q., Meng X., Fisher M., Sotak C.H., and Duong T.Q. (2003). Pixel-by-pixel spatiotemporal progression of focal ischemia derived using quantitative perfusion and diffusion imaging. J. Cereb. Blood Flow Metab. 23, 1479–1488 [DOI] [PMC free article] [PubMed] [Google Scholar]
- 31.Liu Z.M., Schmidt K.F., Sicard K.M., and Duong T.Q. (2004). Imaging oxygen consumption in forepaw somatosensory stimulation in rats under isoflurane anesthesia. Magn. Reson. Med. 52, 277–285 [DOI] [PMC free article] [PubMed] [Google Scholar]
- 32.Schmued L.C. and Hopkins K.J. (2000). Fluoro-Jade: novel fluorochromes for detecting toxicant-induced neuronal degeneration. Toxicol. Pathol. 28, 91–99 [DOI] [PubMed] [Google Scholar]
- 33.Schmued L.C. and Hopkins K.J. (2000). Fluoro-Jade B: a high affinity fluorescent marker for the localization of neuronal degeneration. Brain Res. 874, 123–130 [DOI] [PubMed] [Google Scholar]
- 34.Xu S., Zhuo J., Racz J., Shi D., Roys S., Fiskum G., and Gullapalli R. (2011). Early microstructural and metabolic changes following controlled cortical impact injury in rat: a magnetic resonance imaging and spectroscopy study. J. Neurotrauma 28, 2091–2102 [DOI] [PMC free article] [PubMed] [Google Scholar]
- 35.Pasco A., Lemaire L., Franconi F., Lefur Y., Noury F., Saint-Andre J.P., Benoit J.P., Cozzone P.J., and Le Jeune J.J. (2007). Perfusional deficit and the dynamics of cerebral edemas in experimental traumatic brain injury using perfusion and diffusion-weighted magnetic resonance imaging. J. Neurotrauma 24, 1321–1330 [DOI] [PMC free article] [PubMed] [Google Scholar]
- 36.Lescot T., Fulla-Oller L., Po C., Chen X.R., Puybasset L., Gillet B., Plotkine M., Meric P., and Marchand-Leroux C. (2010). Temporal and regional changes after focal traumatic brain injury. J. Neurotrauma 27, 85–94 [DOI] [PubMed] [Google Scholar]
- 37.Li S., Sun Y., Shan D., Feng B., Xing J., Duan Y., Dai J., Lei H., and Zhou Y. (2013). Temporal profiles of axonal injury following impact acceleration traumatic brain injury in rats–a comparative study with diffusion tensor imaging and morphological analysis. Int. J. Legal Med. 127, 159–167 [DOI] [PubMed] [Google Scholar]
- 38.Allred R.P., Adkins D.L., Woodlee M.T., Husbands L.C., Maldonado M.A., Kane J.R., Schallert T., and Jones T.A. (2008). The vermicelli handling test: a simple quantitative measure of dexterous forepaw function in rats. J. Neurosci. Methods 170, 229–244 [DOI] [PMC free article] [PubMed] [Google Scholar]
- 39.Shen Q., Fisher M., Sotak C.H., and Duong T.Q. (2004). Effects of reperfusion on ADC and CBF pixel-by-pixel dynamics in stroke: characterizing tissue fates using quantitative diffusion and perfusion imaging. J. Cereb. Blood Flow Metab. 24, 280–290 [DOI] [PMC free article] [PubMed] [Google Scholar]
- 40.Schmidt KF, Ziu M, Schmidt NO, Vaghesia P, Cargioli TG, Doshi S, Albert MS, Black PM, Carroll RS, Sun Y. (2004). Volume reconstruction techniques improve the correlation between histological and in vivo tumor volume measurements in mouse models of human gliomas. J. Neurooncol. 68, 207–215 [DOI] [PubMed] [Google Scholar]