Abstract
A sulfonate-silica hybrid strong cation-exchange (SCX) monolith was synthesized at the proximal end of a capillary zone electrophoresis column and used for on-line solid-phase extraction (SPE) sample preconcentration. Sample was prepared in an acidic buffer and deposited onto the SCX-SPE monolith and eluted using a basic buffer. Electrophoresis was performed in an acidic buffer. This combination of buffers results in formation of a dynamic pH junction, which allows use of relatively large elution buffer volume while maintaining peak efficiency and resolution. All experiments were performed with a 50 µm ID capillary, a 1-cm long SCX-SPE monolith, a 60-cm long separation capillary, and a electrokinetically pumped nanospray interface. The volume of the capillary is 1.1 µL. By loading 21 µL of a 1 × 10⁻⁷ M angiotensin II solution, an enrichment factor of 3000 compared to standard electrokinetic injection was achieved on this platform while retaining efficient electrophoretic performance (N = 44 000 plates). The loading capacity of the sulfonate SCX hybrid monolith was determined to be ~15 pmol by frontal analysis with 10−5 M angiotensin II. The system was also applied to the analysis of a 10−4 mg/mL bovine serum albumin tryptic digest; the protein coverage was 12% and 11 peptides were identified. Finally, by loading 5.5 µL of a 10−3 mg/mL E. coli digest, 109 proteins and 271 peptides were identified in a 20 min separation; the median separation efficiency generated by these peptides was 25,000 theoretical plates.
Keywords: Capillary zone electrophoresis, bottom-up proteomics, large volume injection, strong cation exchange, solid phase extraction
1. Introduction
Capillary zone electrophoresis-tandem mass spectrometry (CZE-MS/MS) provides fast and high-resolution separations [1–5]. However, a major drawback of CZE is its poor concentration detection limit, which is a result of the small injection volume required to preserve separation efficiency; typical injection volumes are a few nanoliters. Several on-line sample preconcentration techniques have been developed to increase injection volume without degradation of separation performance [6–11]. These preconcentration techniques are based on either electrophoretic or chromatographic principles [8,12]. Electrophoretic preconcentration techniques exploit differences in the electrophoretic mobilites of the analytes in different zones [11]. Field amplified sample stacking, transient isotachophoresis (tITP), sweeping, and dynamic pH junction are commonly used electrophoretic preconcentration techniques [13–16].
Chromatographic preconcentration techniques generate a stationary phase at the capillary inlet. Analytes are adsorbed by solid phase extraction (SPE) onto the stationary phase from a large volume of sample solution and are eluted in a much smaller volume of solvent [17]. Chromatography particles have been commonly used as sorbents [18,19]. These particulate stationary phases require a frit to hold the material in place. These frits can be time-consuming to manufacture and can cause bubble formation during electrophoresis. To eliminate frits, a separation capillary can be inserted in a SPE microcartridge where the SPE inner diameter is matched to the outer diameter of the separation capillary. In that way, the separation capillary can hold the sorbent, provided that the particle size is larger than the inner diameter of the separation capillary [20–22]. In one case, an 8-µL aliquot of a mixture of three standard peptides was loaded onto a C18 SPE microcartridge; a nanospray sheathless interface was used to generate detection limits near 2 pg/mL [22].
Alternatively, solid-phase extraction can employ monoliths that are prepared directly inside the capillary and covalently anchored to the capillary wall, eliminating frits [23]. Monoliths fall into three classes: organic polymers, silica, and organic-silica hybrids [24, 25]. Organic polymer monoliths have good pH stability, and their surface chemistry is easily tuned using a wide range of monomers. However, organic monoliths tend to have low surface area, which can limit the SPE loading capacity. To address this problem, nanoparticles can be added to the polymerization mixture and later removed by strong base. This approach has generated a 30-fold increase ion exchange capacity compared with an untemplated monolith of otherwise identical composition [24]. However, limited mechanical stability and the swelling of the monoliths in some organic solvents will limit reproducibility.
Silica-based monoliths demonstrate high mechanical stability and large surface area, but are not stable at basic pH. Modification of silica-based monoliths tends to be time-consuming.
Organic-silica hybrid monoliths combine the simplicity and pH stability of organic monoliths with the mechanical stability and large surface area of silica monoliths. In one example, a sulfo/vinyl biphasic silica hybrid monolithic capillary column was prepared in one step for on-column preconcentration [27]. The sulfo-based segment acted as preconcentration column and a vinyl functionalized segment was modified with a ligand containing a sulfhydryl group via thiol-ene click reaction for capillary electrochromatography. By using a conventional UV detector, an enrichment factor of ~800 compared to standard CZE electrokinetic injection was reported for a single peptide and 20 peaks were observed from a bovine serum albumin (BSA) digest at a concentration of 1 µg/mL with a 3 min electrokinetic injection.
Conventional CZE requires that analyte is eluted from the concentrator using a few nanoliter plug of buffer to minimize sample dilution and peak broadening. Often, larger elution volumes result in improved recovery but at the expense of band broadening. To improve performance, an electrophoretic preconcentration technique can be employed after chromatographic preconcentration. Medina-Casanellas et al. combined tITP with on-line C18 SPE capillary electrophoresis to improve sensitivity of peptide analysis [28]. Detection limits for standard solutions and plasma samples (0.01 and 0.1 ng/mL, respectively) were tenfold better than those obtained without tITP. Wang et al. described a C8 solid phase microextraction, multistep elution, and tITP CZE-MS/MS procedure for the analysis of a moderately complex protein mixture; they reported more peptide identifications compared with direct CZE analysis [29].
In this report, we employ a strong cation exchange (SCX) SPE system wherein samples are loaded in acidic buffer and eluted using a basic buffer. Samples are then analyzed using capillary zone electrophoresis in an acidic buffer. This combination of buffers results in formation of a pH junction [15]. Peptides are negatively charged in the basic elution buffer and move towards the positive (injection) electrode. The sample is neutralized as it comes in contact with the acidic separation buffer, and is concentrated at the proximal end of the elution plug. Once the elution buffer is neutralized, analyte take on a positive charge in the acidic separation buffer and are separated as they migrate to the detector.
2. Materials and methods
2.1 Materials and chemicals
BSA, bovine pancreas TPCK-treated trypsin, poly(ethylene glycol) (PEG, MW=10,000), urea, ammonium bicarbonate (NH4HCO3), dithiothreitol (DTT), iodoacetamide (IAA), tetramethoxysilane (TMOS), vinyltrimethoxysilane (VTMS), 3-sulfopropyl methacrylate potassium salt, 2,2’-azobis(2-isobutyronitrile) (AIBN), acetic acid (HAc) and angiotensin II (human, Asp-Arg-Val-Tyr-Ile-His-Pro-Phe) were purchased from Sigma-Aldrich (St. Louis, MO). Formic acid (FA) was purchased from Fisher Scientific (Pittsburgh, PA). Methanol was purchased from Honeywell Burdick & Jackson (Wicklow, Ireland). Water was deionized by a Nano Pure system from Thermo Scientific (Marietta, OH). Fused capillaries were purchased from Polymicro Technologies (Phoenix, AZ).
2.2 Preparation of the sulfonate-silica hybrid SCX-SPE monolith
Preparation of the sulfonate-silica hybrid SCX-SPE monolithic column was similar to a published method [30]. The fused silica capillary (150 µm o.d.×50 µm i.d.) was pretreated by flushing with 0.1 M NaOH for 2 h, water until the outflow reached pH 7.0, 0.1 M HCl for 24 h, and water until the outflow reached pH 7.0. The capillary was dried with a nitrogen stream for 24 h at room temperature prior to use.
For preparation of the sulfonate SCX hybrid monolithic column, a prehydrolyzed mixture was prepared by mixing and stirring HAc (10 mM, 5.0 mL), PEG (MW = 10,000, 540 mg), urea (450 mg), TMOS (1.8 mL), and VTMS (0.6 mL) for 1 h at 0 °C to form a homogeneous solution. Then, 37 mg of 3-sulfopropyl methacrylate potassium salt and 2 mg of AIBN were added into 0.5 mL of the hydrolyzed mixture for 10 min with sonication. The polymerization mixture was then introduced into a 65 cm long piece of the pretreated capillary (150 µm o.d.×50 µm i.d.) using a syringe until the plug length reached 5 cm; this distance was measured visually and without the use of a microscope. Both ends of the capillary were then sealed with pieces of rubber, and the capillary was incubated first at 37 °C for 12 hr for polycondensation and then at 60 °C for 12 h for polymerization. The sulfonate SCX hybrid column was then flushed with methanol and water to remove the porogen and reactants. Finally, the sulfonate SCX hybrid monolithic column was trimmed to 1 cm while coupled to the 60 cm long separation capillary.
2.3 Measurement of elution volumes and flow rates
Quite low flow rates and elution volumes were used in this experiment. A very simple protocol was developed to accurately determine elution volume and flow rates. A piece of 100-µm ID × 360-µm OD fused silica collection capillary was connected to the column containing the preconcentrator. A simple syphon was used to generate flow, and the length of effluent within the collection capillary was measured. Volume was determined based on the length of the plug and the collection capillary cross-sectional area. As one caveat, it is necessary to flush the reactor flow before rate measurements to ensure that no bubbles are present.
2.4 Column capacity measurement
To determine the dynamic binding capacity of the monolith, angiotensin II was used to saturate the sulfonate SCX hybrid monolithic SPE column by frontal analysis. Briefly, 10−5 M of angiotensin II in 50 mM FA was pumped through the sulfonate SCX hybrid monolithic SPE column at a constant flow rate of 160 nL/min by N2 pressure. The outflow was monitored by a MS detector with spray voltage at 1.5 kV. The porosity of the SCX hybrid monolithic SPE column was assumed to be 68% based on the percentage of porogenic solvent used in the reaction [31]. The void time under the same flow rate was calculated as 7.4 min.
2.5 Sample preparation - BSA digest
BSA was dissolved in 1 mL of denaturing buffer containing 8 M urea and 50 mM ammonium bicarbonate. After addition of 10 µL of DTT (10 mM), the mixture was incubated at 60 °C for 1 h to reduce disulfide bonds. Subsequently, 40 µL of IAA (20 mM) was added to the mixture and incubated in the dark at room temperature for 45 min. Then, the mixture was diluted 10 fold with 50 mM ammonium bicarbonate buffer (pH 8.2) and digested with trypsin at the ratio of enzyme to substrate of 1:40 (w/w) at 37 °C for 16 h. After digestion, the pH of the solution was adjusted to 2.7 with 10% trifluoroacetic acid. The digest was treated with a C18 SepPak column (Waters, Milford, MA), dried in a Speed Vac (Thermo, San Jose, CA, USA), and re-dissovled in 50 mM FA.
2.6 Sample preparation – E. coli digest
Solid lysogeny broth (LB) was used to make the agar plates for E. coli culture. Solid LB was prepared by dissolving 3 g of NaCl, 3 g of tryptone, 1.5 g of yeast extract, and 6 g of agar in 300 mL of deionized water. Liquid LB medium (without agar) was also prepared by mixing 10 g of NaCl, 10 g of tryptone, and 5 g of yeast extract in 1 L of deionized water. All media, plates, and other utensils and flasks were appropriately autoclaved before use. Frozen cultures of E. coli (Dh5-Alpha) were thawed and plated on the prepared agar plates. After incubation at 37 °C for 24 h, single colonies were isolated and grown in tubes with 4 mL of liquid LB medium and incubated in a shaker at 37 °C overnight. When the tubes’ contents turned opaque, the liquid medium was transferred into new flasks and shaken overnight at 37 °C. The liquid LB medium was centrifuged, and the resulting E. coli pellets were washed with PBS three times. Then, the pellets were suspended in 8 M urea and 100 mM Tris-HCl (pH 8.0) buffer supplemented with protease inhibitor and sonicated for 15 min on ice for cell lysis. The lysate was centrifuged at 18,000 g for 15 min, and the supernatant was collected. The protein concentration was measured by the BCA method. An aliquot of protein (900 µg) was precipitated by cold acetone overnight at −20 °C. After centrifugation, the pellet was washed again with cold acetone. The resulting protein pellet was dried at room temperature.
The dried E. coli proteins (900 µg) were dissolved in 300 µL of 100 mM NH4HCO3 (pH 8) with 8 M urea and denatured at 37 °C for 60 min followed by reduction with DTT (8 mM) at 60 °C for 1 h and alkylation with IAA (20 mM) at room temperature for 30 min in dark. Then 1.2 mL of 100 mM NH4HCO3 (pH 8) was added to reduce the concentration of urea to less than 2 M. Finally, an aliquot of 120 µg treated proteins was digested by incubation with trypsin at a trypsin/protein ratio of 1/30 (w/w) for 4 h at 37 °C. The digests were acidified with 0.5% (v/v) FA to terminate the reaction. The tryptic digests were desalted with C18 SepPak columns (Waters, Milford, MA), followed by lyophilisation with a vacuum concentrator (Thermo Fisher Scientific, Marietta, OH). The dried protein digests were dissolved in 50 mM FA for analysis by CZE-ESI-MS/MS or SPE-CZE-ESI-MS/MS.
2.7 Direct CZE-ESI-MS/MS analysis
The capillary electrophoresis system consists of two high-voltage power supplies (Spellman CZE 1000R) and an electrokinetically pumped nanospray interface that coupled the CZE separation capillary to a LTQ-Orbitrap Velos mass spectrometer (Thermo Fisher Scientific) [32–35]. The electrospray emitter was borosilicate glass capillary (1.0 mm o.d. × 0.75 mm i.d., 10 cm long) pulled with a Sutter instrument P-1000 flaming/brown micropipette puller; the emitter inner diameter was 5–10 µm. The electrospray sheath flow buffer was 10% (v/v) methanol with 0.1%aqueous FA. An uncoated fused silica capillary (50 µm i.d.×150 µm o.d., 60 cm long) was used for the CZE separation. The separation buffer was 50 mM FA in water. The sample was loaded by pressure with a ~30 nL injection volume. 19.5 kV was applied at the injection end of the capillary for separation and 1.5 kV on the sheath flow reservoir for electrospray. Voltage programming was controlled by LabView software.
2.8 On-line SCX-SPE CZE-ESI-MS/MS analysis
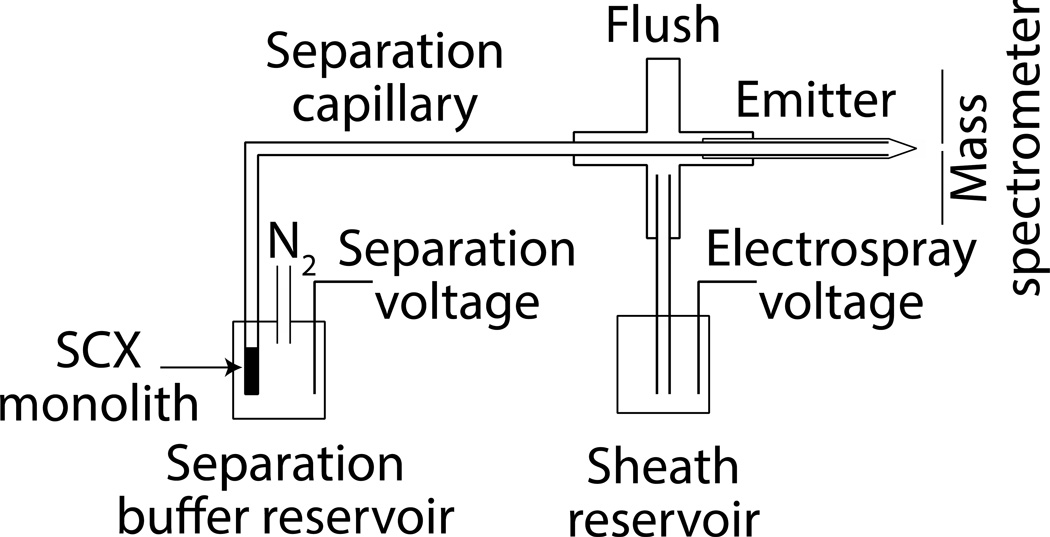
The schematic diagram of the SCX-SPE CZE-ESI-MS/MS system is shown in Figure 1. The injection end of the capillary was held in a block that allowed application of either nitrogen gas to pump fluids or voltage to drive electrophoresis [35]. The monolith was first conditioned by consecutive flushes of 50 mM FA at 20 psi for 10 min. The samples were prepared in 50 mM FA and hydrodynamically injected for varying lengths of time. Unretained components were removed by rinsing with 50 mM FA. The elution was performed by hydrodynamic injection of NH4HCO3 (pH 8). The electrolyte was changed back to 50 mM FA and normal CZE-ESI-MS/MS analysis was carried out by applying a separation voltage of 19.5 kV and a spray voltage of 1.5 kV. Between runs, the capillary was rinsed with a solution of 50 mM NH4HCO3 (pH 8) to minimize carry-over.
Fig 1.
Schematic diagram of the SCX-SPE CZE-ESI-MS/MS system. Provisions are made to use N2 gas pressure to pump analyte and reagents through the monolith. The separation is driven by the difference between the separation voltage and the spray voltage. The sheath liquid is electrokinetically driven by the electrospray voltage.
2.9 Mass spectrometer operating parameters
An LTQ-Orbitrap Velos mass spectrometer (Thermo Fisher Scientific) was used in this experiment. The ion transfer tube temperature was held at 280 °C. The S-Lens RF level was 50.00. The mass spectrometer was programmed in data-dependent mode. A top 10 method was used. Full MS scans were acquired with the Orbitrap mass analyzer over m/z 380–1800 range with resolution of 70,000 (m/z 200) and the number of microscans set to 1. The target value was 1.00E+06, and maximum injection time was 250 ms. For MS/MS scans, the ten most intense peaks with charge state ≥2 were sequentially isolated and further fragmented in the higher-energy-collisional-dissociation cell following one full MS scan. The normalized collision energy was 33%.
2.10 Database searching
Database searching of the raw files was performed in Proteome Discoverer 1.3 with MASCOT 2.2.4. The insulin chain b sequence was added into ipi.bovin.v3.68.fasta to form the database. For E. coli cell lysate, Swiss-Prot database with taxonomy as E. coli DH1 (4160 sequences) was used. The false discovery rate was determined by searching the reversed database. The database searching parameters included full tryptic digestion and allowed up to two missed cleavages, precursor mass tolerance 10 ppm, and fragment mass tolerance 0.05 Da. Carbamidomethylation (C) was set as fixed modifications. Oxidation (M) and deamidated (NQ) were set as variable modifications. On the peptide level, peptide confidence value as high was used to filter the peptide identification, and the corresponding false discovery rate on peptide level was less than 1%. On the protein level, protein grouping was enabled.
3. Results and discussion
3.1 Analysis of a standard peptide
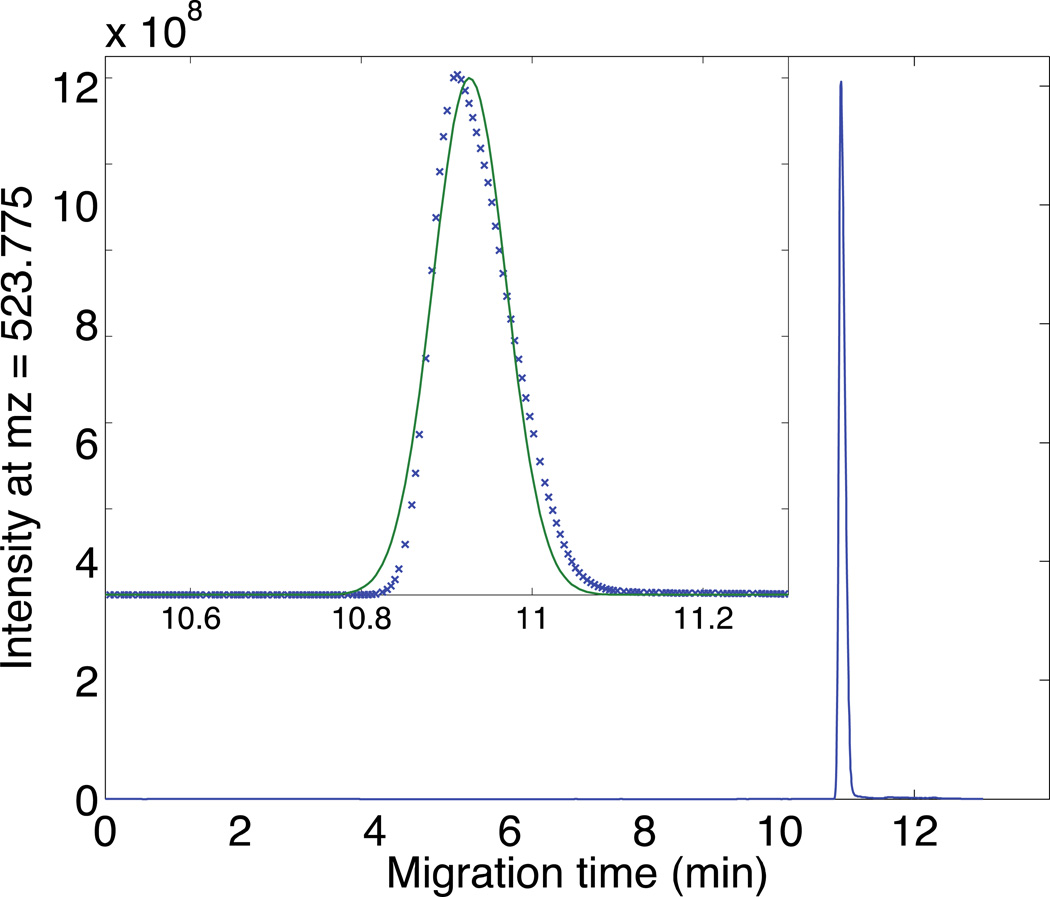
To evaluate the performance of the system, 82 nL of a 10−5 M angiotensin II solution was loaded on the SCX SPE monolith. After flushing with 50 mM FA, the retained angiotensin II was eluted with a 60 nL plug of 50 mM NH4HCO3 (pH 8). Electrophoresis was performed to analyze the eluted peptide, Figure 2. The peak generates exquisite signal-to-noise ratio (s/n ~ 104) and is reasonably sharp (N = 7 × 10⁴ plates, 6 s FWHH) with a very minor amount of tailing. The narrow peak width, despite the 60 nL elution volume, is a result of the pH junction employed in this experiment. Very similar behavior is observed with a higher concentration elution buffer, but with a slightly delayed migration (data not shown).
Fig 2.
Electrophoresis of angiotensin II after elution from the SCX-SPE monolith. Experimental conditions: 50 µm i.d.×150 µm o.d.×1cm SCX-SPE column with 60 cm long separation capillary; 820 fmol of 10−5 M angiotensin II; 50 mM NH4HCO3 (pH=8) elution buffer; 50 nL total elution volume; 50 mM FA separation buffer; 19.5 kV separation voltage; 1.5 kV spray voltage. Intensity extracted with mass resolution of 70,000 at the target m/z. Data treated with a Lowess filter with a span of ten points before plotting. Insert shows the results of a least squares fit of a Gaussian function (smooth curve) to the peak.
3.2 Effect of elution volume
The effect of elution buffer volume on signal intensity was evaluated by loading 82 nL of 10−5 M angiotensin II and using 10 mM NH4HCO3 (pH 8) as the elution buffer. After the sample was loaded, the SPE column was thoroughly flushed with 50 mM FA followed by sequential injection of the elution buffer.
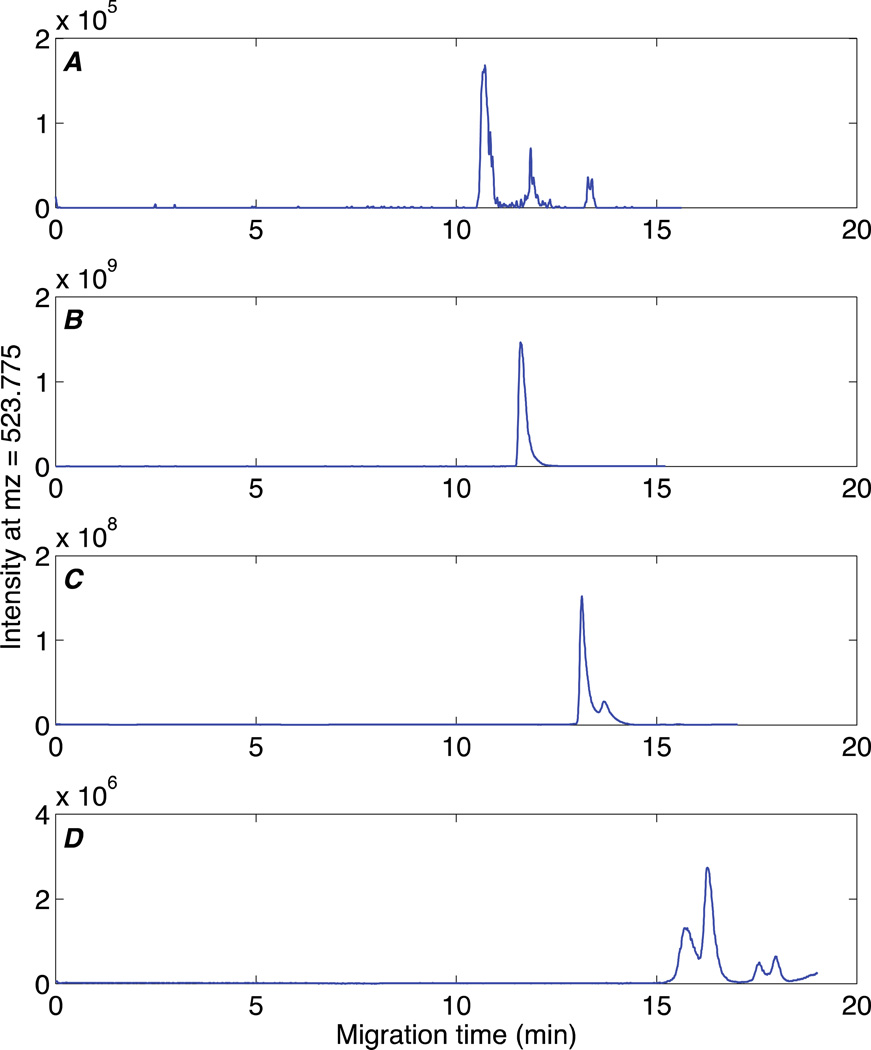
An initial plug of 60 nL NH4HCO3 buffer was pumped through the monolith. This initial plug was unable to elute a significant amount of the angiotensin II from the monolith, Figure 3A. Injection of a second plug of 100 nL of NH4HCO3 buffer (160 nL total) eluted a large fraction of the angiotensin II, generating a four order of magnitude increase in signal compared with the first plug, Figure 3B. Despite the large elution volume, this eluted peak is reasonably sharp, N= 2 × 10⁴, due to the pH junction. A third plug of 140 nL of elution buffer (300 nL total) generated an order of magnitude smaller peak compared with the second plug, Figure 3C. Finally, a fourth plug of 180 nL of elution buffer (480 nL total elution volume) generated a three order of magnitude smaller peak compared with the second plug, Figure 3D.
Fig 3.
Effect of elution volume. Elution buffer, 10 mM NH4HCO3 (pH=8); sequential elution volumes: (A) 60 nL, (B) 100 nL, (C) 140 nL, (D) 180 nL. Other experimental conditions the same as figure 2. Selected ion elecropherograms generated at m/z = 523.775.
Peaks appear at successively later times due to the pH junction. The amount of acidic running buffer required to neutralize the elution buffer increases from A to D in figure 3, resulting in a proportional delay before the appearance of the analyte peak. The difference in retention time between figure 2 and 3 is due to the difference in concentration in buffer strength.
A few anomalous peaks are present in panels A, C, and D. These peaks generate amplitudes that are range from 1% to 0.01% of the amplitude of the main peak in panel B. We assume that these peaks are generated by trace impurities with similar m/z value as the target peptide.
3.3 Column capacity of sulfonate SCX hybrid monolithic column
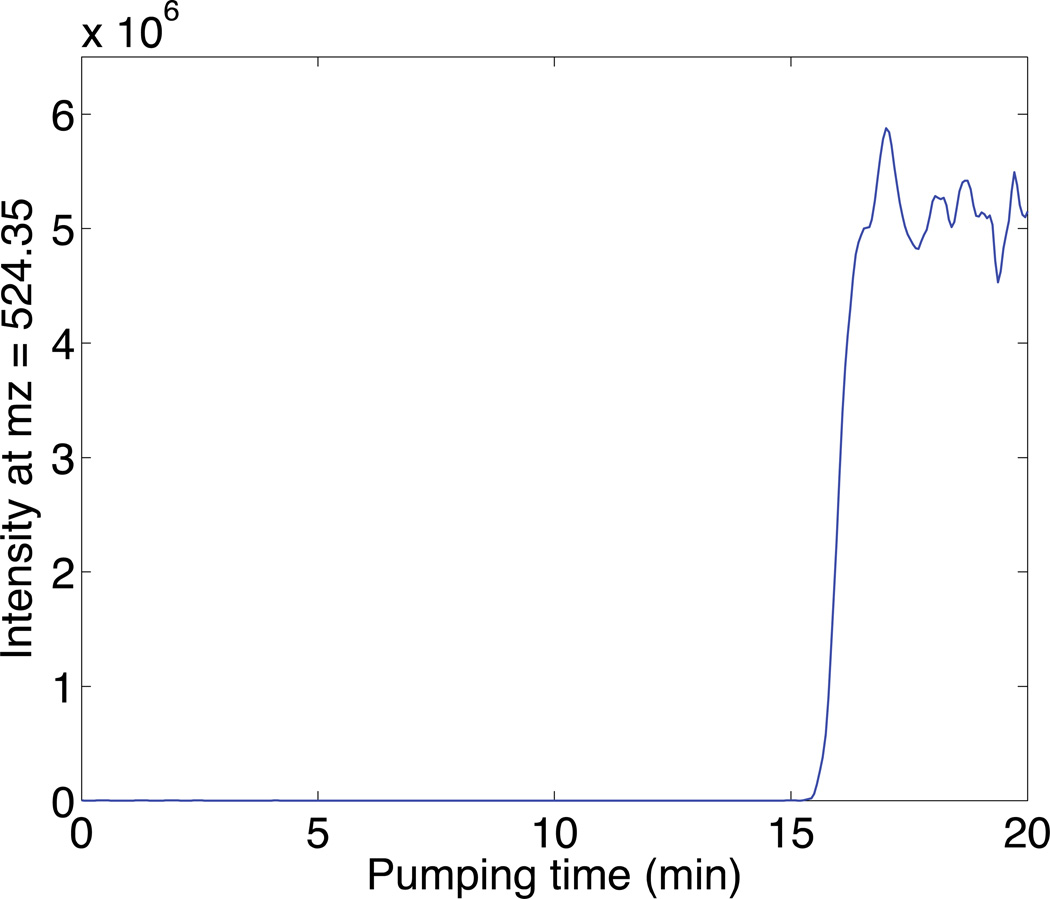
A 10−5 M solution of angiotensin II was used to determine the binding capacity of the sulfonate SCX SPE column (50 µm i.d.×150 µm o.d., 1 cm). The peptide solution was pumped through the column using nitrogen pressure while recording the mass spectrometer signal, Figure 4. A step increase in signal was observed when the SCX-SPE column was saturated (Figure 4). The void time, calculated as 7.4 min, was subtracted from the breakthrough time. The average time for saturation was 8.7 min. At the flow rate of 160 nL/min, the dynamic binding capacity of the SCX SPE column (50 µm i.d.×150 µm o.d., 1 cm) was calculated to be 14 pmol.
Fig 4.
Breakthrough curve of angiotensin II on the SCX-SPE column. Experimental conditions: 50 µm i.d.×150 µm o.d.×1cm SCX-SPE column with 60 cm separation capillary; 10−5 M angiotensin II; 160 nL/min flow rate; 0 kV separation voltage; 1.5 kV spray voltage. Intensity extracted at m/z = 524.4 with a mass accuracy of 5000.
3.4 Repeatability and stability
The run-to-run repeatability was evaluated by loading 280 nL of a 10−6 M angiotensin II solution and eluting using 90 nL of 50 mM NH4HCO3 buffer. The RSD for migration time was 2.9% and for peak area was 0.6% (n=2). Column-to-column reproducibility for the monolithic columns was also evaluated; the RSD of retention time was 2.2% and of peak area was 18% (n=3).
3.5 Linearity, enrichment factor, and detection limit
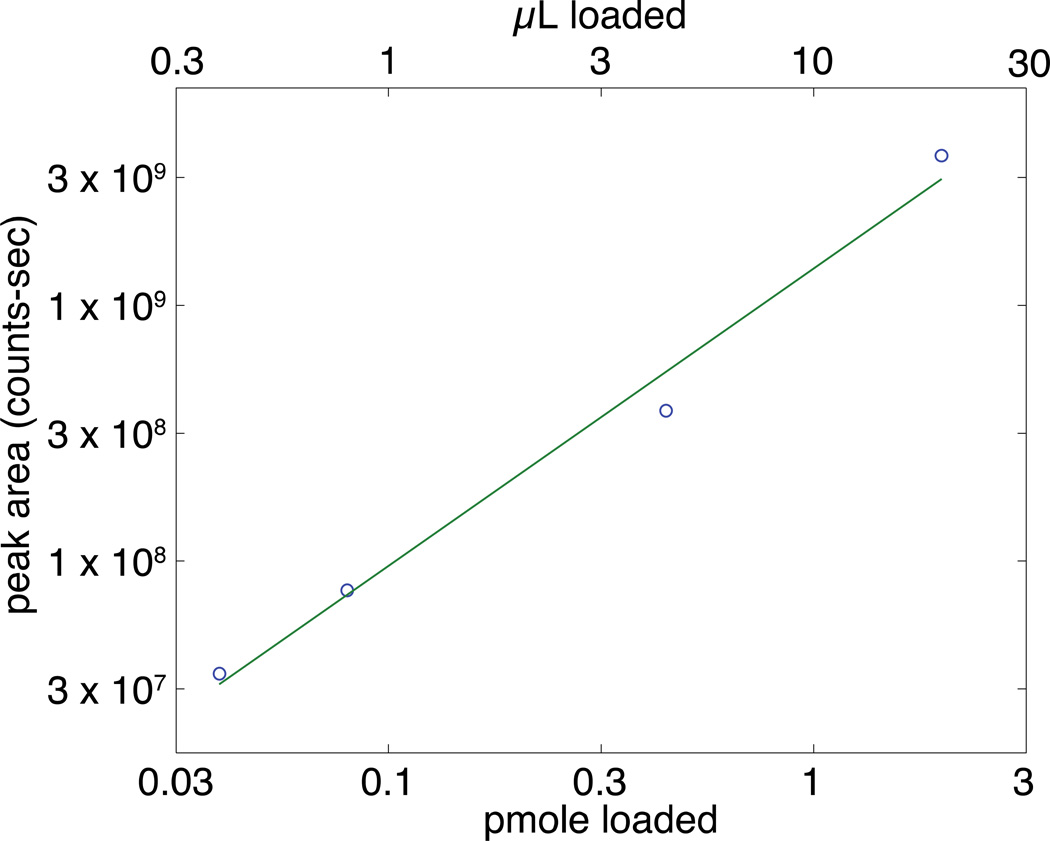
We evaluated the linearity of the system after loading various volumes of 10−7 M angiotensin II and eluting with 80 nL of 70 mM NH4HCO3 (pH 8). The eluted peptide was then analyzed by electrophoresis, the selected ion electropherogram was fit using a Gaussian function, and the product of the peak height and width were used to estimate the peak area. A log-log plot of peak area vs. amount loaded is linear, r = 0.993 with a log-log slope of 1.16 ± 0.10, across roughly two orders of magnitude in loaded amount, corresponding to loading from 300 nL to 21 µL of the target peptide solution, figure 5. The separation efficiency ranged from 2.2 × 10⁴ to 5.0 × 10⁴ plates across this loading range, and the separation efficiency was uncorrelated with loading amount (r = 0.29).
Fig 5.
Log-log plot of the effect of loading amount on angiotensin II signal. Experimental conditions: 50 µm i.d.×150 µm o.d.×1cm sulfonate SCX SPE column with 60 cm long separation capillary; 1 × 10⁻⁷ M angiotensin II sample, 80 nL 70 mM NH4HCO3 (pH 8) elution buffer; 50 mM FA separation buffer; 19.5 kV separation voltage; 1.5 kV spray voltage. Peak area estimated from the product of peak height and width as determined by least squares fit of a Gaussian function to the data.
Extremely large loading volumes can be used with this monolithic preconcentrator. For example, the 21 µL loading volume is 20 times the total capillary volume. Despite this huge loading volume, the resulting electrophoretic peak generated separation efficiency similar to other pH junction experiments (N = 44,000 plates) [16].
We estimated the enrichment factor by comparing the peak area for the SCX-SPE system and conventional CZE. For the 21 µL loading volume, the enrichment factor was 3,000. We observed a ~2.5-fold increase in signal with a 150 nL elution volume, which corresponds to ~7,500-fold enrichment; however, this additional enrichment came at the expense of degraded separation efficiency (N = 8,000).
Detection limits are difficult to estimate using Orbitrap mass spectrometers; the instrument’s standard software truncates low intensity signals, which provides challenges in estimating noise in the baseline. Nevertheless, the detection limits appear to be in the high femtomolar concentration range, corresponding to low pg/mL mass concentration.
3.6 Analysis of BSA tryptic digest
The performance of the SCX-SPE preconcentration system was evaluated using a BSA tryptic digest and compared with CZE-MS/MS. Both systems employed pH junction conditions.
For direct injection, the BSA tryptic digest was prepared in 50 mM NH4HCO3 (pH 8) and a 30 nL aliquot was analyzed by CZE-MS/MS. The system generated 64% coverage (RSD = 5%) and identified an average of 45 peptides (RSD = 5%) from a 0.1 mg/mL BSA tryptic digest (N=2). The protein coverage and the number of unique peptides identified decreased as the BSA tryptic digest concentration decreased; no peptides were identified using a BSA tryptic digest concentration below 10−4 mg/mL.
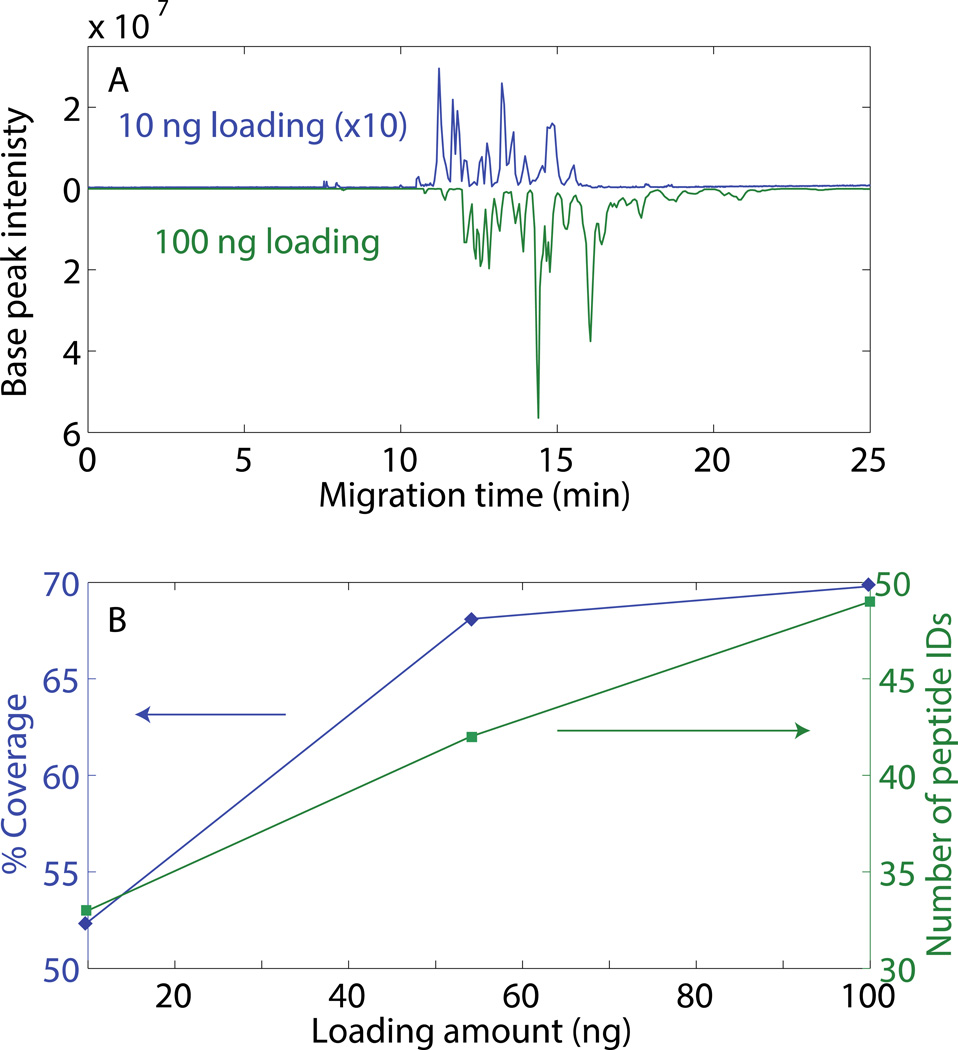
Different volumes of a 0.1 mg/mL BSA tryptic digest dissolved in 50 mM FA were loaded on the SCX-SPE monolith and eluted with 80 nL 70 mM NH4HCO3 (pH 8). Comparison of a 10 ng and 100 ng loading shows that the signal roughly increases in proportion to the loading amount, Figure 6A. In addition, larger loading results in a slight migration shift to later times. As expected, protein coverage and the number of identified unique peptides increased with loading amount, Figure 6B. Over 80% of the identified peptides from direct CZE method were also identified by the SCX SPE preconcentration system, which indicated no obvious discrimination in the retention of the peptides by the SCX SPE coulumn. However, it seems more sample was required for SCX SPE preconcentration system to reach the comparable identification results of CZE. The loss in coverage and peptides identification maybe ascribed to the elution conditions. For loading large amount of sample, larger elution volume or multistep elution was necessary to elute all the enriched sample from the column. In this experiment, we were interested in demonstrating the loading capacity of the SCX column for proteomic analysis, so the elution conditions were kept the same. Optimization of the elution condition for large sample loading amounts will be carried out in future work.
Fig 6.
Effect of sample loading amount on BSA peptide analysis. A. Butterfly plot of base peak electropherograms of a 0.1 mg/mL BSA tryptic digest using the SCX-SPE system. Blue – 10 ng loading amount; signal multiplied by 10×. Green – 100 ng loading amount. B. % coverage and number of peptide IDs as a function of loading amount. Other conditions are same as Figure 5.
To further evaluate the performance of the SCX SPE system for the analysis of low concentration digests, 11 µL of a 10−4 mg/mL BSA tryptic digest was loaded onto the monolith and eluted with 80 nL of 70 mM NH4HCO3 (pH 8). Protein coverage was 12% (RSD=26%) and 11 unique peptides were identified (RSD=28%) from the digest (n=2).
3.7 Analysis of E. coli digest
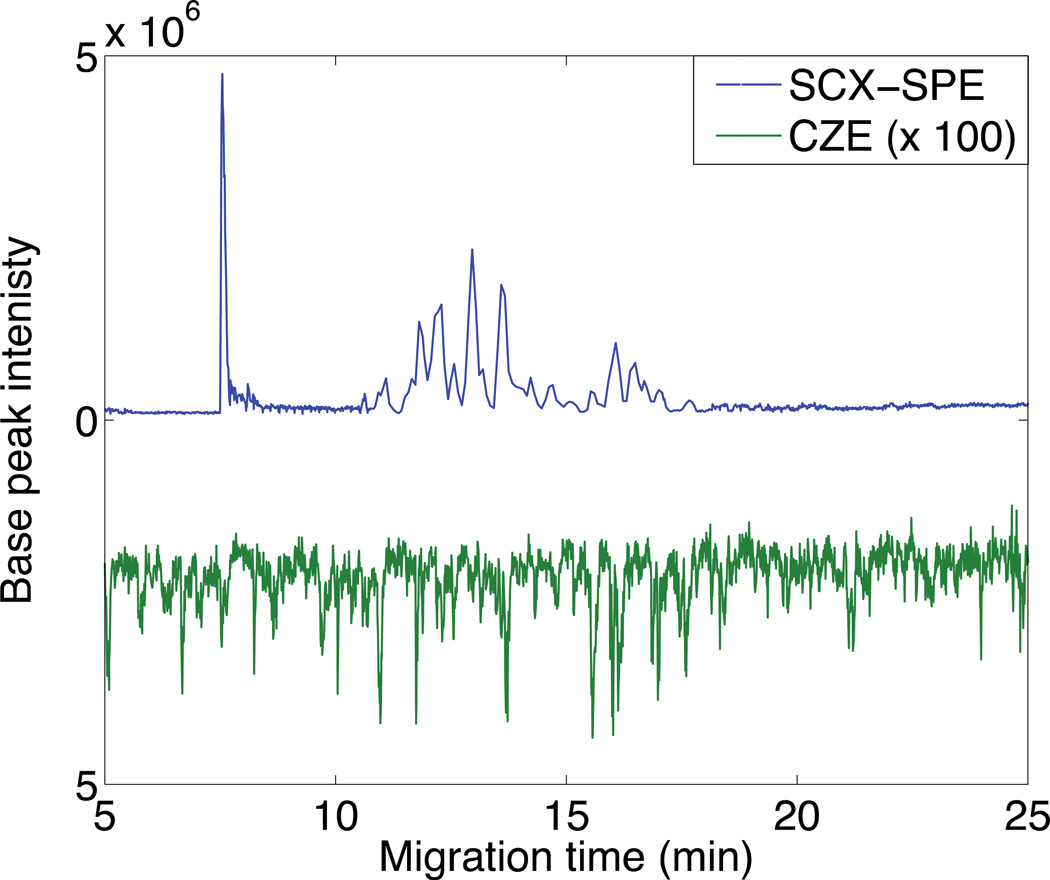
Dilutions of an E. coli tryptic digest were prepared in the elution buffer (50 mM NH4HCO3, pH 8). A 30 nL aliquot of 0.1 mg/mL was analyzed by CZE-MS/MS without the monolithic preconcentrator. 63 proteins (RSD = 8%) and 205 peptides (RSD = 5%) were identified (N=2), which are similar numbers of identifications as in our original pH junction paper [16]. As expected, when the concentration of the E. coli tryptic digest was decreased, the protein coverage and the number of identified proteins and peptides decreased. Analysis by CZE of a 10−3 mg/mL digest identified seven proteins (RSD = 11%) and 12 peptides (RSD = 12%), Figure 7 (N = 2). When the concentration of the E. coli tryptic digest was further decreased to 10−4 mg/mL, no proteins or peptides were identified.
Fig 7.
Butterfly plot of electropherograms generated from 10−3 mg/mL E. coli digests. The blue (top) trace is the analysis of 5.5 µL of the digest using SCX-SPE-CZE-MS/MS. The green (bottom) trace is the analysis of 30 nL of the digest using CZE-MS/MS; this trace has been multiplied by 100. Other conditions are the same as Figure 5.0
To evaluate the performance of the SCX-SPE system, E. coli digests were prepared in 50 mM FA. A 5.5 µL aliquot of a 10−3 mg/mL tryptic digest was hydrodynamically loaded onto the SCX SPE column and eluted with 100 nL of 50 mM NH4HCO3 (pH 8), Figure 7. 109 proteins (RSD = 6%) and 271 peptides (RSD = 6%) were identified (N = 2), which is similar to the results we obtained just using 400 nL injection of a 10−2 mg/mL E. coli digest with only the pH junction [16]. An unsupervised nonlinear least squares algorithm was used to fit a Gaussian function to each peptides selected ion electropherogram. The median peak width, expressed as the standard deviation of the Gaussian function, was 5.2 s, and the median peak efficiency was 25,000 theoretical plates, which are similar to our earlier results on the use of the pH junction alone [16].
4. Conclusions
We have prepared a cation-exchange monolithic solid-phase extraction system and demonstrated its use for peptide concentration in a capillary zone electrophoresis system. This solid-phase extraction system allows injection of over 5 µL sample volumes, which facilitate the analysis of dilute protein digests. The elution of the adsorbed sample employs relatively large volumes of buffer, which would normally lead to unacceptable band broadening. We employed conditions that create a pH junction to concentrate the eluted peptides into a tight band, generating separations with efficiencies greater than 25,000 plates.
Highlights.
We used an strong cation exchange monolith for large volume sample preconcentration in CZE-based proteomics
We used a pH junction to concentrate peptides after elution from the monolith.
We observed a 3,000-fold enrichment for angiotensis II.
We identified over 100 proteins from a 1 µg/mL tryptic digest of E. coli.
ACKNOWLEDGEMENT
We thank Dr. William Boggess in the Notre Dame Mass Spectrometry and Proteomics Facility for his help with this project. This work was funded by the National Institutes of Health (Grant R01GM096767).
Footnotes
Publisher's Disclaimer: This is a PDF file of an unedited manuscript that has been accepted for publication. As a service to our customers we are providing this early version of the manuscript. The manuscript will undergo copyediting, typesetting, and review of the resulting proof before it is published in its final citable form. Please note that during the production process errors may be discovered which could affect the content, and all legal disclaimers that apply to the journal pertain.
REFERENCES
- 1.Fonslow BR, Yates JR., 3rd Capillary electrophoresis applied to proteomic analysis. J. Sep. Sci. 2009;32:1175–1188. doi: 10.1002/jssc.200800592. [DOI] [PMC free article] [PubMed] [Google Scholar]
- 2.Li Y, Champion MM, Sun L, Champion PAD, Wojcik R, Dovichi NJ. Capillary zone electrophoresis-electrospray ionization-tandem mass spectrometry as an alternative proteomics platform to ultraperformance liquid chromatography-electrospray ionization-tandem mass spectrometry for samples of intermediate complexity. Anal. Chem. 2012;84:1617–1622. doi: 10.1021/ac202899p. [DOI] [PMC free article] [PubMed] [Google Scholar]
- 3.Sun L, Zhu G, Zhao Y, Yan X, Mou S, Dovichi NJ. Ultrasensitive and fast bottom-up analysis of femtogram amounts of complex proteome digests. Angew Chem. Int. Ed. Engl. 2013;52:13661–13664. doi: 10.1002/anie.201308139. [DOI] [PMC free article] [PubMed] [Google Scholar]
- 4.Zhu G, Sun L, Yan X, Dovichi NJ. Single-shot proteomics using capillary zone electrophoresis-electrospray ionization-tandem mass spectrometry with production of more than 1250 Escherichia coli peptide identifications in a 50 min separation. Anal. Chem. 2013;85:2569–2573. doi: 10.1021/ac303750g. [DOI] [PMC free article] [PubMed] [Google Scholar]
- 5.Zhao SS, Zhong X, Tie C, Chen DDY. Capillary electrophoresis-mass spectrometry for analysis of complex samples. Proteomics. 2012;12:2991–3012. doi: 10.1002/pmic.201200221. [DOI] [PubMed] [Google Scholar]
- 6.Kitagawa F, Otsuka K. Recent applications of on-line sample preconcentration techniques in capillary electrophoresis. J. Chromatogr. A. 2014;1335:43–60. doi: 10.1016/j.chroma.2013.10.066. [DOI] [PubMed] [Google Scholar]
- 7.Wu XZ. New approaches to sample preparation for capillary electrophoresis. TrAC Trends Anal. Chem. 2003;22:48–58. [Google Scholar]
- 8.Chien RL. Sample stacking revisited: a personal perspective. Electrophoresis. 2003;24:486–497. doi: 10.1002/elps.200390057. [DOI] [PubMed] [Google Scholar]
- 9.Malá Z, Šlampová A, Gebauer P, Boček P. Contemporary sample stacking in CE. Electrophoresis. 2009;30:215–229. doi: 10.1002/elps.200800433. [DOI] [PubMed] [Google Scholar]
- 10.Breadmore MC, Thabano JRE, Dawod M, Kazarian AA, Quirino JP, Guijt RM. Recent advances in enhancing the sensitivity of electrophoresis and electrochromatography in capillaries and microchips (2006–2008) Electrophoresis. 2009;30:230–248. doi: 10.1002/elps.200800435. [DOI] [PubMed] [Google Scholar]
- 11.Simpson SL, Jr, Quirino JP, Terabe S. On-line sample preconcentration in capillary electrophoresis. Fundamentals and applications. J. Chromatogr. A. 2008;1184:504–541. doi: 10.1016/j.chroma.2007.11.001. [DOI] [PubMed] [Google Scholar]
- 12.Saavedra L, Barbas C. Chromatography-based on- and in-line pre-concentration methods in capillary electrophoresis. J. Biochem. Biophys. Methods. 2007;70:289–297. doi: 10.1016/j.jbbm.2006.11.005. [DOI] [PubMed] [Google Scholar]
- 13.Friedberg MA, Hinsdale M, Shihabi ZK. Effect of pH and ions in the sample on stacking in capillary electrophoresis. J. Chromatogr. A. 1997;781:35–42. doi: 10.1016/s0021-9673(97)00583-9. [DOI] [PubMed] [Google Scholar]
- 14.Kazarian AA, Hilder EF, Breadmore MC. Online sample pre-concentration via dynamic pH junction in capillary and microchip electrophoresis. J. Sep. Sci. 2011;34:2800–2821. doi: 10.1002/jssc.201100414. [DOI] [PubMed] [Google Scholar]
- 15.Britz-McKibbin P, Bebault GM, Chen DD. Velocity-difference induced focusing of nucleotides in capillary electrophoresis with a dynamic pH junction. Anal. Chem. 2000;72:1729–1735. doi: 10.1021/ac991104z. [DOI] [PubMed] [Google Scholar]
- 16.Zhu G, Sun L, Yan X, Dovichi NJ. Bottom-up proteomics of Escherichia coli using dynamic pH junction preconcentration and capillary zone electrophoresis-electrospray ionization-tandem mass spectrometry. Anal. Chem. 2014;86:6331–6336. doi: 10.1021/ac5004486. [DOI] [PMC free article] [PubMed] [Google Scholar]
- 17.Kohler I, Schappler J, Rudaz S. Microextraction techniques combined with capillary electrophoresis in bioanalysis. Anal. Bioanal. Chem. 2013;405:125–141. doi: 10.1007/s00216-012-6367-y. [DOI] [PubMed] [Google Scholar]
- 18.Figeys D, Ducret A, Yates JR, 3rd, Aebersold R. Protein identification by solid phase microextraction-capillary zone electrophoresis-microelectrospray-tandem mass spectrometry. Nat. Biotechnol. 1996;14:1579–1583. doi: 10.1038/nbt1196-1579. [DOI] [PubMed] [Google Scholar]
- 19.Figeys D, Ducret A, Aebersold R. Identification of proteins by capillary electrophoresis-tandem mass spectrometry. Evaluation of an on-line solid-phase extraction device. J. Chromatogr. A. 1997;763:295–306. doi: 10.1016/s0021-9673(96)00847-3. [DOI] [PubMed] [Google Scholar]
- 20.Guzman NA. Biomedical applications of online preconcentration-capillary electrophoresis using an analyte concentrator - investigation of design options. J. Liquid Chromatogr. 1995;18:3751–3768. [Google Scholar]
- 21.Benavente F, Vescina MC, Hernández E, Sanz-Nebot V, Barbosa J, Guzman NA. Lowering the concentration limits of detection by on-line solid-phase extraction-capillary electrophoresis-electrospray mass spectrometry. J. Chromatogr. A. 2007;1140:205–212. doi: 10.1016/j.chroma.2006.11.092. [DOI] [PubMed] [Google Scholar]
- 22.Medina-Casanellas S, Domínguez-Vega E, Benavente F, Sanz-Nebot V, Somsen GW, de Jong GJ. Low-picomolar analysis of peptides by on-line coupling of fritless solid-phase extraction to sheathless capillary electrophoresis-mass spectrometry. J. Chromatogr. A. 2014;1328:1–6. doi: 10.1016/j.chroma.2013.12.080. [DOI] [PubMed] [Google Scholar]
- 23.Nema T, Chan ECY, Ho PC. Applications of monolithic materials for sample preparation. J. Pharm. Biomed. Anal. 2014;87:130–141. doi: 10.1016/j.jpba.2013.05.036. [DOI] [PubMed] [Google Scholar]
- 24.Wu MH, Wu RA, Zhang ZB, Zou HF. Preparation and application of organic-silica hybrid monolithic capillary columns. Electrophoresis. 2011;32:105–115. doi: 10.1002/elps.201000349. [DOI] [PubMed] [Google Scholar]
- 25.Ou J, Lin H, Zhang Z, Huang G, Dong J, Zou H. Recent advances in preparation and application of hybrid organic-silica monolithic capillary columns. Electrophoresis. 2013;34:126–140. doi: 10.1002/elps.201200344. [DOI] [PubMed] [Google Scholar]
- 26.Thabano JRE, Breadmore MC, Hutchinson JP, Johns C, Haddad PR. Silica nanoparticle-templated methacrylic acid monoliths for in-line solid-phase extractioncapillary electrophoresis of basic analytes. J. Chromatogr. A. 2009;1216:4933–4940. doi: 10.1016/j.chroma.2009.04.012. [DOI] [PubMed] [Google Scholar]
- 27.Chen Y, Wang K, Yang H, Liu Y, Yao S, Chen B, Nie L, Xu G. Synthesis of sulfo/vinyl biphasic silica hybrid monolithic capillary column and its application to on-column preconcentration for capillary electrochromatography. J. Chromatogr. A. 2012;1233:91–99. doi: 10.1016/j.chroma.2012.01.024. [DOI] [PubMed] [Google Scholar]
- 28.Medina-Casanellas S, Benavente F, Barbosa J, Sanz-Nebot V. Transient isotachophoresis in on-line solid phase extraction capillary electrophoresis time-of-flight-mass spectrometry for peptide analysis in human plasma. Electrophoresis. 2011;32:1750–1759. doi: 10.1002/elps.201100017. [DOI] [PubMed] [Google Scholar]
- 29.Wang Y, Fonslow BR, Wong CCL, Nakorchevsky A, Yates JR., 3rd Improving the comprehensiveness and sensitivity of sheathless capillary electrophoresis-tandem mass spectrometry for proteomic analysis. Anal. Chem. 2012;84:8505–8513. doi: 10.1021/ac301091m. [DOI] [PMC free article] [PubMed] [Google Scholar]
- 30.Zhang Z, Wang F, Xu B, Qin H, Ye M, Zou H. Preparation of capillary hybrid monolithic column with sulfonate strong cation exchanger for proteome analysis. J. Chromatogr. A. 2012;1256:136–143. doi: 10.1016/j.chroma.2012.07.071. [DOI] [PubMed] [Google Scholar]
- 31.Ye M, Hu S, Schoenherr RM, Dovichi NJ. On-line protein digestion and peptide mapping by capillary electrophoresis with post-column labeling for laser-induced fluorescence detection. Electrophoresis. 2004;25:1319–1326. doi: 10.1002/elps.200305841. [DOI] [PubMed] [Google Scholar]
- 32.Wojcik R, Dada OO, Sadilek M, Dovichi NJ. Simplified capillary electrophoresis nanospray sheath-flow interface for high efficiency and sensitive peptide analysis. Rapid Commun. Mass Spectrom. 2010;24:2554–2560. doi: 10.1002/rcm.4672. [DOI] [PubMed] [Google Scholar]
- 33.Wojcik R, Li Y, Maccoss MJ, Dovichi NJ. Capillary electrophoresis with Orbitrap-Velos mass spectrometry detection. Talanta. 2012;88:324–329. doi: 10.1016/j.talanta.2011.10.048. [DOI] [PMC free article] [PubMed] [Google Scholar]
- 34.Sun L, Zhu G, Mou S, Zhao Y, Champion MM, Dovichi NJ. Capillary zone electrophoresis-electrospray ionization-tandem mass spectrometry for quantitative parallel reaction monitoring of peptide abundance and single-shot proteomic analysis of a human cell line. J. Chromatogr A. 2014;1359:303–308. doi: 10.1016/j.chroma.2014.07.024. [DOI] [PMC free article] [PubMed] [Google Scholar]
- 35.Sun L, Hebert AS, Yan X, Zhao Y, Westphall MS, Rush MJ, Zhu G, Champion MM, Coon JJ, Dovichi NJ. Over 10 000 Peptide Identifications from the HeLa Proteome by Using Single-Shot Capillary Zone Electrophoresis Combined with Tandem Mass Spectrometry. Angew Chem Int Ed Engl. 2014;53:13931–13933. doi: 10.1002/anie.201409075. [DOI] [PMC free article] [PubMed] [Google Scholar]
- 36.Krylov SN, Starke DA, Arriaga EA, Zhang Z, Chan NW, Palcic MM, Dovichi NJ. Instrumentation for chemical cytometry. Anal. Chem. 2000;72:872–877. doi: 10.1021/ac991096m. [DOI] [PubMed] [Google Scholar]


