Abstract
Objective:
To evaluate the three-dimensional (3D) skeletal changes in the mandibles of Class III patients treated with bone-anchored maxillary protraction using shape correspondence analysis.
Material and Method:
Twenty-five consecutive patients with skeletal Class III who were between the ages of 9 and 13 years (mean age, 11.10 ± 1.1 years) were treated using Class III intermaxillary elastics and bilateral miniplates (two in the infrazygomatic crests of the maxilla and two in the anterior mandible). Cone-beam computed tomography (CBCT) was performed for each patient before initial loading (T1) and at 1 year out (T2). From the CBCT scans, 3D models were generated, registered on the anterior cranial base, and analyzed using 3D linear distances and vectors between corresponding point-based surfaces.
Results:
Bone-anchored traction produced anteroposterior and vertical skeletal changes in the mandible. The novel application of Shape correspondence analysis showed vectors of mean (± standard deviation) distal displacement of the posterior ramus of 3.6 ± 1.4 mm, while the chin displaced backward by 0.5 ± 3.92 mm. The lower border of the mandible at the menton region was displaced downward by 2.6 ± 1.2 mm, and the lower border at the gonial region moved downward by 3.6 ± 1.4 mm. There was a downward and backward displacement around the gonial region with a mean closure of the gonial angle by 2.1°. The condyles were displaced distally by a mean of 2.6 ± 1.5 mm, and there were three distinct patterns for displacement: 44% backward, 40% backward and downward, and 16% backward and upward.
Conclusion:
This treatment approach induces favorable control of the mandibular growth pattern and can be used to treat patients with components of mandibular prognathism.
Keywords: Skeletal anchorage, Class III, Growth modification, Bone anchor, 3-D
INTRODUCTION
Class III malocclusion can present as hypoplasia of the maxilla, prognathism of the mandible, or a combination of both.1 Early treatment modalities are aimed at maxillary protraction or restraint of mandibular growth. Although animal studies have shown that chin-cup therapy is effective in reducing proliferation of condylar cartilage, ramal growth, and closure of the gonial angle2–4 human studies have been less promising.5,6 Reverse pull facemask and bone-anchored maxillary protraction (BAMP) are designed to orthopedically advance the maxilla, but even in these techniques reciprocal forces directed at the mandible produce displacement in the sagittal and vertical planes.7,8
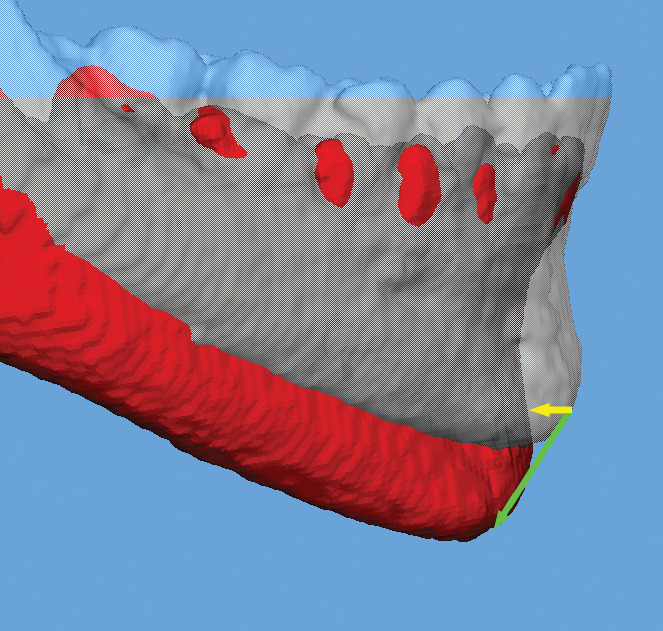
Previous BAMP studies evaluated skeletal and soft tissue changes for the maxilla, midface, mandible, and glenoid fossa using three-dimensional (3D) superimpositions registered at the anterior cranial fossa.9–12 However, the measured outcomes were quantified using color maps with iterative closest point (ICP), which does not report changes at corresponding anatomic regions. Although the difference between measurements of the ICP and corresponding points might be relatively small when there is little displacement of the region of interest, it can be larger when the region of interest presents large or rotational displacements and/or bone remodeling (Figure 1). Furthermore, ICP calculations from commercial and shareware software can erroneously report vertical or lateral displacement rather than the desired anterior posterior change and cannot report vector changes of corresponding anatomic regions.
Figure 1.

Superimposition of mandibles registered on the anterior cranial base. The yellow arrow represents possible measurements using the iterative closest point, and the green arrow shows corresponding anatomical measurement.
Recently, Paniagua et al.13 introduced a novel method using cone-beam computed tomography (CBCT) and 3D structural and statistical spherical harmonics statistical shape analysis (SPHARM-PDM) to quantify surgical outcomes. This study will incorporate SPHARM-PDM tools to report corresponding anatomic changes and displacement in the mandible and condyles after BAMP treatment in growing children.
MATERIALS AND METHODS
Subjects
Twenty-five consecutively treated patients (13 girls and 12 boys) were enrolled in the study. All patients had Class III malocclusion in the mixed or permanent dentitions characterized by an anterior crossbite or incisor end-to-end relationship, Class III molar relationship, and a Wits appraisal of −1 mm or less (mean, −4.8 ± 2.8 mm). All patients were white ancestry and at a prepubertal stage of skeletal maturity according to the cervical vertebral maturation method (CS1 – CS3).14 Mean age for the BAMP sample was 11.9 ± 1.8 years at T1 and 13.1 ± 1.7 years at T2. Mean duration of T1-T2 interval was 1.2 ± 0.3 years. This study was approved by the University of North Carolina Committee for Research on Human Subjects.
BAMP Orthopedic Protocol
Each patient had four miniplates placed, two in the infrazygomatic crest of the maxillary buttress and two between the mandibular lateral incisors and canines. Small mucoperiosteal flaps were elevated, and the modified miniplates (Bollard, Tita-Link, Brussels, Belgium) were secured to the bone by two (mandible) or three (maxilla) screws (2.3-mm diameter, 5-mm length).15 The extensions of the plates perforated the attached gingiva near the mucogingival junction. Three weeks after surgery, the miniplates were loaded using Class III elastics applied at an initial force of 100 g on each side. The force was increased to 200 g after 1 month of traction, and to 250 g after 3 months. The patients were asked to replace the elastics at least once a day and to wear them 24 hours per day. In 14 patients, after 2 to 3 months of intermaxillary traction, a removable bite plate was inserted in the upper arch to eliminate occlusal interference in the incisor region until the anterior crossbite was corrected.
Image Analysis Protocol
Cone-beam computed tomography (CBCT) scans were acquired using an iCAT machine (Imaging Sciences International, Hatfield, PA) at a resolution of 0.3 mm × 0.3 mm × 0.3 mm with a 40-second scan time and a 16 cm × 22 cm field of view. Patients were oriented in a natural head position. After acquisition, CBCT scans were first reformatted to an isotropic resolution of 0.5 mm × 0.5 mm × 0.5 mm to decrease the computational power and time required to compute SPHARM-PDM analysis. Next, 3D virtual models were created from the CBCT scans using ITK-SNAP 2.4 (http://www.itksnap.org). The 3D virtual models were registered on the anterior cranial fossa, specifically the endocranial surfaces of the cribiform plate region of the ethmoidal bone and the frontal bone. These regions were chosen because of their early completion of growth.16 A fully automated voxel-wise rigid registration method was performed with IMAGINE (http://www.ia.unc.edu/dev/download/imagine/index.htm). This method, developed by Cevidanes et al.,17 masks anatomic structures altered by treatment or growth to avoid observer-dependent reliance on subjectively defined anatomic landmarks. After registration, the superimposed images were validated for accuracy, slice by slice in all planes of space, by one examiner. The registered mandibular models were oriented to the Frankfort horizontal/midsagittal plane (Figure 2) and split into hemimandibles for shape correspondence analysis.
Figure 2.
Surface models were oriented to Frankfort horizontal/Transverse planes using the following reference lines: A) porion – orbitale in the sagittal view, B) transorbitale in the coronal view, and C) Crista Galli – middle of basion in the transverse view. D) Shows a surface models of the mandible depicting the landmarks used to measure the gonial angle. These included the most posterior point in the surface of the condyle, anatomic gonion and lower border of the mandibular symphysis at menton.
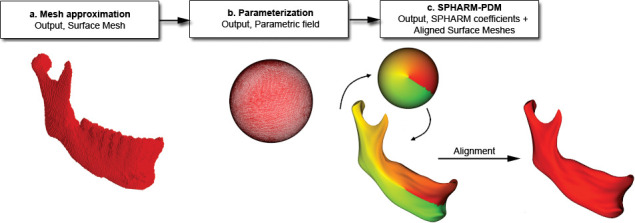
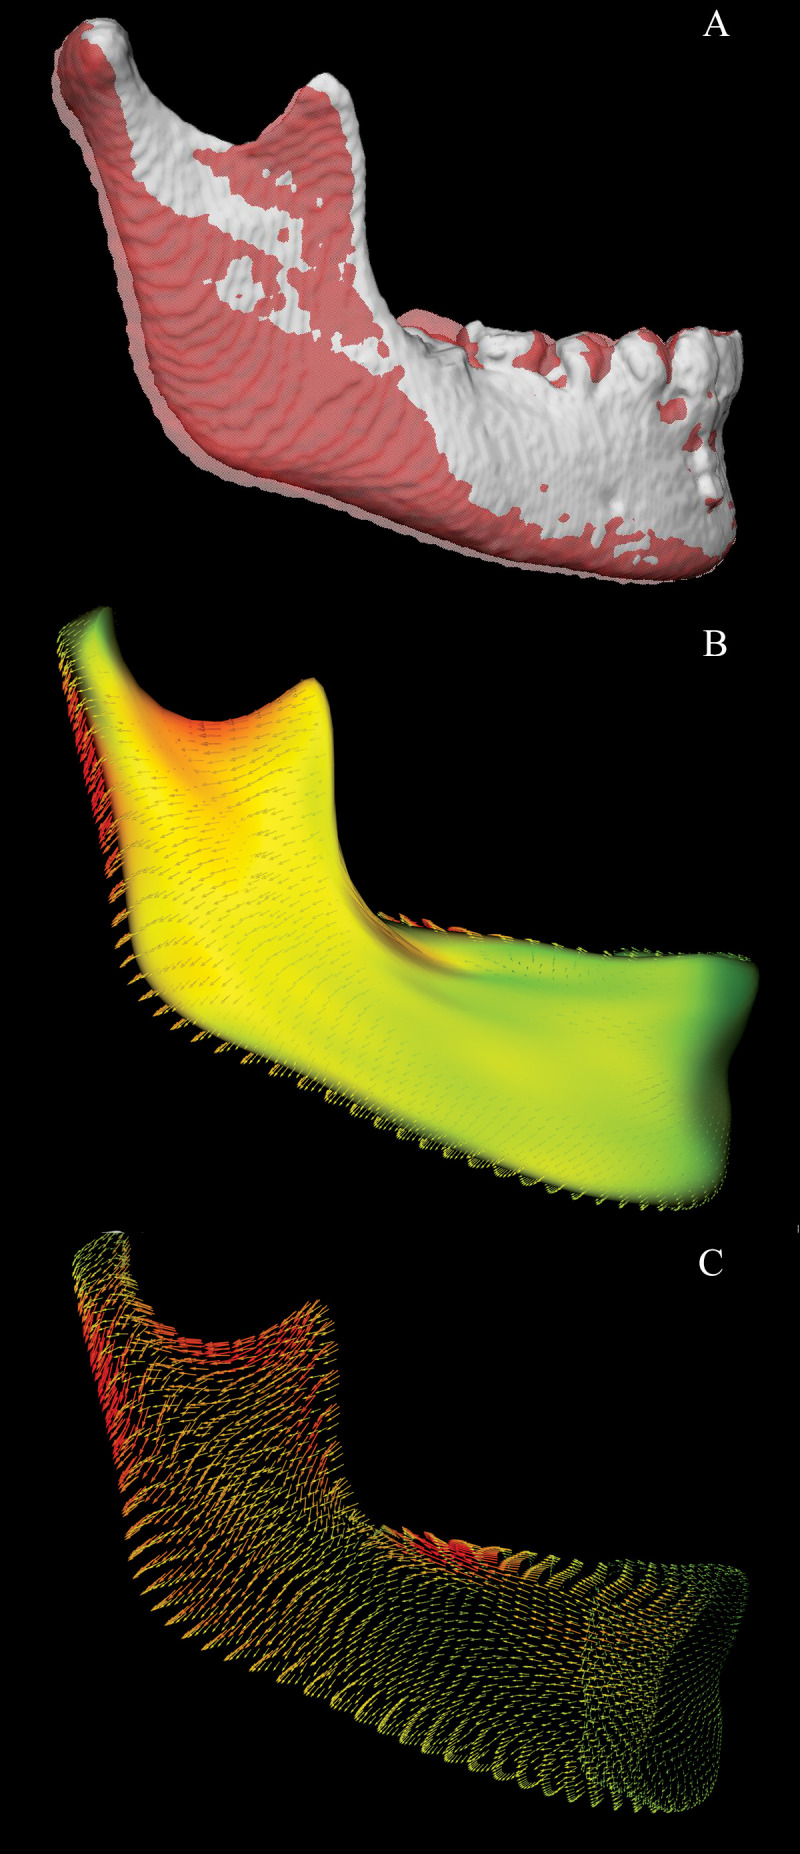
The SPHARM-PDM (http://www.nitrc.org/projects/spharm-pdm) was used to compute unique correspondent point-to-point displacement of the registered hemimandibular models for each patient. The segmented 3D surface models of the hemimandibles were first converted into surface meshes containing 4002 points. These meshed mandibles were then transformed into unit spheres using an area-preserving and distortion-minimizing spherical mapping process called “spherical parameterization.” The spheres have three different axis poles (in this example, a yellow, orange, and green) with unique 3D coordinates for each individual point in the sphere. After T1 and T2, mandibles were converted into parameterized spheres, and first-order ellipsoids from the spherical harmonic coefficients were used to aligned and establish correspondence of individual points from T1 and T2 spheres across all surfaces. The parameterized T1 and T2 spheres were then converted back to surface models (Figure 3). The surface models were rigidly aligned by computing an optimal, linear, geometric transformation that best maps the displacement changes between T1 and T2 hemimandibles (Figure 4C). Vectors at the regions of interest (Table 1) was measured, averaged, and analyzed.
Figure 3.

Surface models of each BAMP patient are a) converted into surface meshes, and b) spherical parameterization is computed. Using the first order ellipsoid from SPHARM coefficients, c) spherical parameterizations establish correspondence across surfaces and corresponding points are computed.
Figure 4.

Cranial based registered mandibular models of a BAMP patient showing A) transparent white T1 mandible with superimposed red T2 mandible, B) color map mandibular model at T1 with corresponding T2 displacement vector map and C) corresponding vector map only.
Table 1.
Definition of the Regions Selected for the Study
Measurements of the gonial angle were recorded at T1 and T2 using registered 3D surface models using the Vectra Analysis Model (Canfield Imaging Systems, Fairfield, NJ) software. The landmarks selected for the measurements included the most posterior point in the surface of the condyle, anatomic gonion, and lower border of the mandibular symphysis at menton (Figure 2). Repeated measurements were performed on 10 random patients within two weeks by the same clinician (Dr Nguyen) to test for reliability of landmark identification. Intraclass correlation statistics showed a high correlation (0.97) for the identification of gonial angle landmarks.
RESULTS
Anatomic corresponding displacement was visualized on vector maps for each patient (Figure 3). In addition, groups of vectors were measured. These measurements are summarized in Table 2, which reports the descriptive statistics for the displacement changes at the chin, lower border of the mandible, posterior ramus, and mandibular condyles for 25 consecutively treated BAMP patients.
Table 2.
Mean Values (Millimeters) and Standard Deviations (SDs) for Displacement of the Mandible at Each Anatomic Region Relative to the Cranial Base Superimposition
The chin, on average, maintained its relative AP position (mean change, −0.45 mm ± 3.92 mm); 14 of the 25 subjects exhibited posterior displacement. The range of response was largely variable, from 6.59 mm of anterior displacement to as much as −8.45 mm of posterior displacement. Measurements at the lower border of the mandible at menton showed a vertical displacement of approximately 2.60 mm (mean right menton, 2.55 mm ± 1.39 mm; mean left menton, 2.77 mm ± 1.44 mm). The inferior border of the mandible at gonion showed a slightly larger degree of vertical and distal displacement (mean right gonion, 3.58 mm ± 1.45 mm; mean left gonion, 3.77 ± 1.44 mm), suggesting a net decrease in mandibular plane angle. The BAMP treatment produced a mean gonial angle closure of 2.12°.
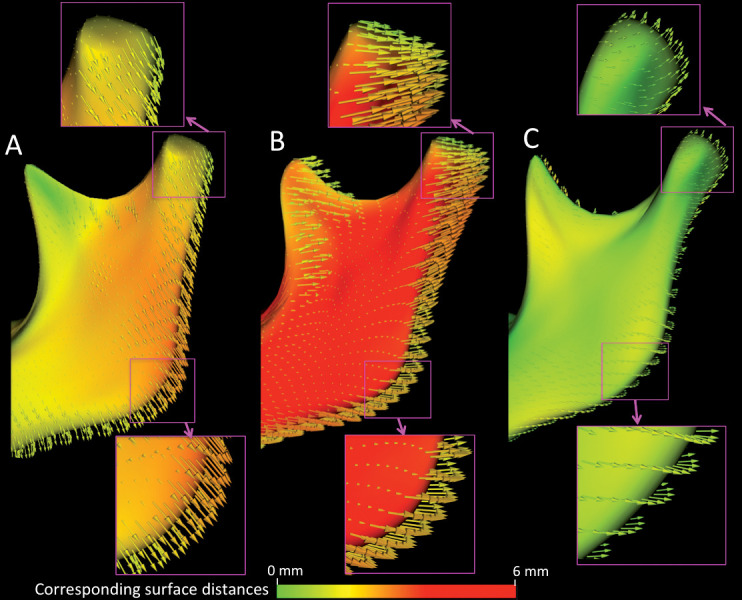
The condyles were displaced posteriorly (mean right condyle, 2.46 mm ± 0.91 mm; mean left condyle, 2.65 mm ± 1.11 mm), but the degree of distal displacement varied considerably between patients. Interestingly, the condyles exhibited three distinct patterns of displacements (down + back, group 1; back, group 2; and up + back, group 3) (Table 3, Figure 5). The majority of the patients in this study exhibited back or down + back movement (44% and 40%m respectively). However, a small percentage displayed the up + back pattern (16%). The average initial gonial angle for the back and the back + down group was approximately 128°, compared with the up + back group, which showed a larger initial gonial angle of 132°. A Wilcoxon Rank test showed that the up + back group had a statistically higher initial gonial angle than the other groups. However, there was no statistical difference between the down + back group and the back group (Table 4). Furthermore, the down + back subjects had a slightly greater closure of the gonial angle (2.4°) compared with the up + back group (1.71°), but this was not statistically significant.
Table 3.
Mean Initial (T1) Gonial Angle, Change in Gonial Angle, and Percent Distribution of the Three Distinct Groups of Condylar Displacement
Figure 5.

Vector maps showing the 3 groups of condylar displacement: A) down + back, B) back, and C) up + back. The maps also show magnified images of the displacement vectors at the condyles and gonial angle. The color scale represents the degree of displacement between corresponding distances.
Table 4.
Wilcoxon Rank Test Evaluation of the Three Groups of Condylar Displacementa
DISCUSSION
This article introduces a novel application of shape analysis to quantify corresponding surface changes on growing patients. This metholology is proposed as an alternative to quantification of changes with closest point surface distances. Closest point surface measurements was introduced into 3D image analysis because of its potential to reduce operator bias and intraexaminer reliability errors during data collection. It is fairly accurate when the region of interest exhibits little growth displacement. For subjects who exhibit increased vertical growth or longitudinal growth studies with a large observation period, ICP measurements can incorrectly report changes or underestimate the degree of displacement because the software algorithms often measure the closest adjacent surface rather than corresponding surfaces. Although 3D point-to-point measurements can potentially reduce the aforementioned errors, it is still subject to operator bias. Furthermore, when the region of interest is actively remodeling, such as the condyles, selecting corresponding points is not always reliable or reproducible. SPHARM-PDM can overcome many of these errors and biases because it evaluates the entire surface and calculates thousands of corresponding points rather than looking for a specific point within a region. It can be a valuable tool to evaluate growth and/or treatment response in longitudinal studies.
Although the results of BAMP therapy have been reported to be approximately 60% in maxillary and 40% in mandibular response,9 complex changes in mandibular morphology with growth, remodeling, and BAMP treatment require further investigation, as elucidated in this study. Despite the fact that SPHARM-PDM analysis has been used to evaluate maxillary changes in surgical patients,18 there are challenges for the application of SPHARM-PDM quantitative image analysis to the maxilla in growing patients. Unlike the mandible, the maxilla is not an isolated bone, and the maxillary boundaries are not visible in surface models constructed from CBCT. One examiner might crop the superior or posterior border of the maxilla differently from another examiner. This could potentially result in errors in calculating the corresponding vectors.
Using SHARM-PDM analysis, we saw that BAMP treatment resulted in a slight posterior movement of the chin by an average of 0.45 mm. This value is slightly larger than our previous published value (0.03 mm);12 which reported AP chin movement using the ICP method. Although a difference of −0.42 mm might appear insignificant, one must consider that in two-dimensional (2D) studies, the average untreated Class III patients exhibited more than 2 mm of forward displacement of the chin during the same time span.9 In that study, response was highly variable between patients; some exhibited a large amount of distal displacement at pogonion, while others continued in the expected forward and downward growth pattern. More studies are needed to see if a specific phenotype or facial pattern is associated with the variability in response at the chin.
All patients exhibited a bilateral closure of the gonial angle and distalization of the posterior ramus. When evaluated alone, closure of the gonial angle produces a counterclockwise rotation of the mandibular corpus, thereby increasing chin projection and overbite. However, when combined with distalization of the ramus, it produces a swing-back effect that minimizes bite deepening while decreasing chin projection. In our previous 2D studies, BAMP treatment resulted in an increase of overbite by 1.4 mm.9 In addition, gonial angle closure produced approximately 38% more vertical displacement at the posterior region by gonion compared with the anterior region at menton, suggesting a closure of the mandibular plane angle (MPA). Bjork19 has shown that intramatrix rotation can produce as much as 3° to 4° of mandibular plane reduction; however, his samples were evaluated for two decades in contrast to the 12-month observation period in this study. This corroborates the findings in our 2D study, which showed that BAMP decreased MPA compared with untreated Class III subjects.9 An advantage of BAMP mechanics is the potential application for the treatment of hyperdivergent Class III patients. Decrease of the mandibular plane angle and closure of the gonial angle with BAMP treatment can help control vertical growth. Reverse pull facemask often produces a clockwise rotation of the mandible and therefore is contraindicated in a high-angle patient.20,21
Few studies to date have evaluated condylar displacement in the treatment of Class III malocclusion.14,22–24 The primate study by Janzen and Bluher22 and the human study by Mimura and DeGuchi23 report an upward and backward displacement of the condyles after chin-cup therapy. An interesting finding from this study is the three distinct patterns of condylar displacement among the patients in this sample. The majority of the subjects treated with BAMP exhibited either a downward and backward or a straight back displacement of the condyle; however, a small percentage (16%; n = 4) showed an up and back direction of movement. The four patients who presented upward and backward displacement showed lesser degree of gonial angle closure, although this was a small subgroup and this finding was not statistically significant. The variability in the patterns of condylar displacement observed in this study might be explained by the point force vector application via Class III elastics. Although this was a small sample, patients who presented upward and backward condylar displacement had a higher gonial angle at the start of treatment. In these patients, the force vector from the elastics would probably be directed at or slightly below the center of resistance of the mandibular corpus and therefore produce translation of the condyle in an upward and backward direction. The patients who presented back and down or back condylar displacement had smaller gonial angles at the start of treatment and more likely experienced a force vector above the center of resistance of the mandible. Larger samples and long-term follow-up are needed to determine whether variability in facial pattern before treatment can predict effectiveness in producing mandibular restraint.
CONCLUSIONS
Use of 3D imaging and SPHARM-PDM allows for the visualization and interpretation of mandibular treatment outcomes from BAMP.
Forward displacement of the chin can be restricted by a combination of swing-back of the ramus and closure of the gonial angle.
Distal displacement of the condyles has three distinct patterns.
SPHARM-PDM can be a valuable tool to evaluate growth and treatment changes.
REFERENCES
- 1.Guyer EC, Ellis EE, III, McNamara JA, Jr, Behrents RG. Components of class III malocclusion in juveniles and adolescents. Angle Orthod. 1986;56:7–30. doi: 10.1043/0003-3219(1986)056<0007:COCIMI>2.0.CO;2. [DOI] [PubMed] [Google Scholar]
- 2.Asano T. The effects of mandibular retractive force on the growing rat mandible. Am J Orthod Dentofacial Orthop. 1986;90:464–474. doi: 10.1016/0889-5406(86)90106-x. [DOI] [PubMed] [Google Scholar]
- 3.Janzen EK, Bluher JA. The cephalometric, anatomic, and histologic changes in Macaca mulatta after application of a continuous-acting retraction force on the mandible. Am J Orthod. 1965;51:823–855. doi: 10.1016/0002-9416(65)90251-4. [DOI] [PubMed] [Google Scholar]
- 4.Joho JP. The effects of extraoral low-pull traction to the mandibular dentition of Macaca mulatta. Am J Orthod. 1973;64:555–577. doi: 10.1016/0002-9416(73)90289-3. [DOI] [PubMed] [Google Scholar]
- 5.Allen RA, Connolly IH, Richardson A. Early treatment of Class III incisor relationship using the chincap appliance. Eur J Orthod. 1993;15:371–376. doi: 10.1093/ejo/15.5.371. [DOI] [PubMed] [Google Scholar]
- 6.Barrett AA, Baccetti T, McNamara JA., Jr Treatment effects of the light-force chincup. Am J Orthod Dentofacial Orthop. 2010;138:468–476. doi: 10.1016/j.ajodo.2008.12.024. [DOI] [PubMed] [Google Scholar]
- 7.Hata S, Itoh T, Nakagawa M, et al. Biomechanical effects of maxillary protraction on the craniofacial complex. Am J Orthod Dentofacial Orthop. 1987;91:305–311. doi: 10.1016/0889-5406(87)90171-5. [DOI] [PubMed] [Google Scholar]
- 8.Westwood PV, McNamara JA, Jr, Baccetti T, et al. Long-term effects of Class III treatment with rapid maxillary expansion and facemask therapy followed by fixed appliances. Am J Orthod Dentofacial Orthop. 2003;123:306–320. doi: 10.1067/mod.2003.44. [DOI] [PubMed] [Google Scholar]
- 9.De Clerck H, Cevidanes L, Baccetti T. Dentofacial effects of bone-anchored maxillary protraction: a controlled study on consecutively treated Class III patients. Am J Orthod Dentofacial Orthop. 2010;138:577–581. doi: 10.1016/j.ajodo.2009.10.037. [DOI] [PMC free article] [PubMed] [Google Scholar]
- 10.Cevidanes L, Baccetti T, Franchi L, McNamara JA, Jr, De Clerck H. Comparison of two protocols for maxillary protraction: bone anchors versus face mask with rapid maxillary expansion. Angle Orthod. 2010;80:799–806. doi: 10.2319/111709-651.1. [DOI] [PMC free article] [PubMed] [Google Scholar]
- 11.Nguyen T, Cevidanes L, Cornelis M, Heymann G, de Paula LK, De Clerck HJ. 3D assessment of maxillary changes associated with bone anchored maxillary protraction. Am J Orthod Dentofacial Orthop. 2011;140:790–798. doi: 10.1016/j.ajodo.2011.04.025. [DOI] [PMC free article] [PubMed] [Google Scholar]
- 12.De Clerck HJ, Nguyen T, de Paula LK, Cevidanes LHS. Mandibular and glenoid fossa changes in 3D following bone anchored Class III intermaxillary traction. Am J Orthod. 2012;142:25–31. doi: 10.1016/j.ajodo.2012.01.017. [DOI] [PMC free article] [PubMed] [Google Scholar]
- 13.Paniagua B, Cevidanes L, Zhu H, Styner M. Outcome quantification using spharm-pdm toolbox in orthognathic surgery. Int J Comput Assist Radiol Surg. 2011;6:617–626. doi: 10.1007/s11548-010-0539-z. [DOI] [PMC free article] [PubMed] [Google Scholar]
- 14.Baccetti T, Franchi L, McNamara JA., Jr The cervical vertebral maturation (CVM) method for the assessment of optimal treatment timing in dentofacial orthopedics. Semin Orthod. 2005;11:119–129. [Google Scholar]
- 15.De Clerck HJ, Cornelis MA, Cevidanes LH, Heymann GC, Tulloch CJ. Orthopedic traction of the maxilla with miniplates: a new perspective for treatment of midface deficiency. J Oral Maxillofac Surg. 2009;67:2123–2129. doi: 10.1016/j.joms.2009.03.007. [DOI] [PMC free article] [PubMed] [Google Scholar]
- 16.Bjork A. The use of metallic implants in the study of facial growth in children: method and material. Am J Phys Anthropol. 1968;29:243–254. doi: 10.1002/ajpa.1330290217. [DOI] [PubMed] [Google Scholar]
- 17.Cevidanes LH, Heymann G, Cornelis MA, DeClerck HJ, Tulloch JF. Superimposition of 3-dimensional cone-beam computed tomography models of growing patients. Am J Orthod Dentofacial Orthop. 2009;136:94–99. doi: 10.1016/j.ajodo.2009.01.018. [DOI] [PMC free article] [PubMed] [Google Scholar]
- 18.de Paula LK, Ruellas ACO, Paniagua B, et al. One-year assessment of surgical outcomes in Class III patients using cone beam computed tomography. Int J Oral Maxillofac Surg. 2013;42:780–789. doi: 10.1016/j.ijom.2013.01.002. [DOI] [PMC free article] [PubMed] [Google Scholar]
- 19.Björk A, Skieller V. Normal and abnormal growth of the mandible. A synthesis of longitudinal cephalometric implant studies over a period of 25 years. Eur J Orthod. 1983;5:1–46. doi: 10.1093/ejo/5.1.1. [DOI] [PubMed] [Google Scholar]
- 20.Baik HS. Clinical results of the maxillary protraction in Korean children. Am J Orthod Dentofacial Orthop. 1995;108:583–592. doi: 10.1016/s0889-5406(95)70003-x. [DOI] [PubMed] [Google Scholar]
- 21.Kapust AJ, Sinclair PM, Turley PK. Cephalometric effects of face mask/expansion therapy in Class III children: a comparison of three age groups. Am J Orthod Dentofacial Orthop. 1998;113:204–212. doi: 10.1016/s0889-5406(98)70141-6. [DOI] [PubMed] [Google Scholar]
- 22.Janzen EK, Bluher JA. The cephalometric, anatomic, and histologic changes in Macaca mulatta after application of a continuous-acting retraction force on the mandible. Am J Orthod. 1965;51:823–855. doi: 10.1016/0002-9416(65)90251-4. [DOI] [PubMed] [Google Scholar]
- 23.Mimura H, Deguchi T. Morphologic adaptation of temporomandibular joint after chincup therapy. Am J Orthod Dentofacial Orthop. 1996;110:541–546. doi: 10.1016/s0889-5406(96)70063-x. [DOI] [PubMed] [Google Scholar]
- 24.Gökalp H, Kurt G. Magnetic resonance imaging of the condylar growth pattern and disk position after chin cup therapy: a preliminary study. Angle Orthod. 2005;75:568–575. doi: 10.1043/0003-3219(2005)75[568:MRIOTC]2.0.CO;2. [DOI] [PubMed] [Google Scholar]


