

Abstract
Peptides and proteins can convert from their soluble forms into highly ordered fibrillar aggregates, giving rise to pathological conditions ranging from neurodegenerative disorders to systemic amyloidoses. It is increasingly recognized that protein oligomers forming early in the process of fibril aggregation represent the pathogenic species in protein deposition diseases. The N-terminal domain of the HypF protein from Escherichia coli (HypF-N) has previously been shown to form, under distinct conditions, two types of HypF-N oligomers with indistinguishable morphologies but distinct structural features at the molecular level. Only the oligomer type exposing hydrophobic surfaces and possessing sufficient structural plasticity is toxic (type A), whereas the other type is benign to cultured cells (type B). Here we show that only type A oligomers are able to induce a Ca2+ influx from the cell medium to the cytosol, to penetrate the plasma membrane, to increase intracellular reactive oxygen species production, lipid peroxidation and release of intracellular calcein, resulting in the activation of the apoptotic pathway. Remarkably, these oligomers can also induce a loss of cholinergic neurons when injected into rat brains. By contrast, markers of cellular stress and viability were unaffected in cultured and rat neuronal cells exposed to type B oligomers. The analysis of the time scales of such effects indicates that the difference of toxicity between the two oligomer types involve the early events of the toxicity cascade, shedding new light on the mechanism of action of protein oligomers and on the molecular targets for the therapeutic intervention against protein deposition diseases.
Keywords: HypF-N aggregate toxicity, calcium dysregulation, membrane lipid peroxidation, cholinergic neuronal death, protein deposition diseases
Introduction
A wide range of human pathologies arises from the failure of a specific peptide or protein to adopt, or remain in, its native functional conformational state. These pathological conditions are generally referred to as protein misfolding diseases and include neurodegenerative disorders, systemic amyloidoses and cystic fibrosis [1, 2]. The largest group of protein misfolding diseases is associated with the conversion of specific peptides or proteins, following mutations, aging or other alterations of the chemical environment, from their soluble functional states into insoluble highly organized fibrillar aggregates, often called amyloid fibrils [1, 2]. There is increasing evidence that the oligomeric assemblies that precede the formation of amyloid fibrils, often kinetic intermediates in the process of amyloid fibril formation or off-pathway species, are the primary pathogenic species in many protein deposition diseases [3–6]. The toxicity of these early oligomers appears to result from their intrinsic ability to impair fundamental cellular processes, for example by interacting with cellular membranes and disassembling the lipid bilayer [7] or by interacting with membrane receptors causing their dysfunction [8].
An increasing number of proteins with no link to protein deposition diseases has been found to form, under various conditions in vitro, fibrillar aggregates that show structural and tinctorial properties similar to those of the amyloid fibrils formed by disease-related proteins and peptides [9–11]. Among these proteins, the globular N-terminal domain of the prokaryotic hydrogenase maturation factor from Escherichia coli (HypF-N) is a valuable model system for investigating the structural basis of the cellular dysfunction caused by misfolded protein oligomers. Indeed, monomeric HypF-N is promptly able to form spherical oligomers, protofibrils and amyloid-like fibrils in vitro, under conditions that destabilize its native state or promote its cooperative unfolding into partially structured states [12–17]. The oligomers formed in the early stages of the aggregation process have the same morphological and tinctorial features as those formed by disease-related peptides and proteins [18, 19]. In particular, two types of spherical oligomers have been formed by HypF-N, following the incubation in distinct experimental conditions that have been designated condition A and condition B, respectively [18]. The resulting oligomers were found to be stable when transferred to physiological conditions, and apparently indistinguishable using atomic force microscopy and ThT binding. However, when studied using site-directed N-(1-pyrene)maleimide labelling and ANS binding, these oligomers were found to have a different degree of structural flexibility and solvent-exposure of the hydrophobic groups. Such different structural properties resulted in different toxic properties of the oligomers, as revealed by the MTT and Hoechst staining tests, with the aggregates displaying a greater flexibility and higher solvent-exposure of the hydrophobic regions (type A oligomers) being more toxic than the others (type B oligomers).
The availability of morphologically indistinguishable protein oligomers differing in submicroscopic structural properties and in their biological properties provides a unique opportunity to study, in addition to the structural determinants of protein toxicity [18], also the mechanism of action through which only one subpopulation elicits deleterious effects on cell viability. By monitoring and comparing the various cellular responses upon treatment with the two types of oligomers, the key steps associated with oligomer-mediated cell dysfunction in the complex cascade of events following the interaction of oligomers with the cell membrane may be identified. In this study we compared the downstream effects following the exposure of cultured cells and rat brains to the previously characterized toxic and non-toxic HypF-N oligomers. We will show that only the toxic oligomers are able to cause the early events associated with cell toxicity, such as the increase of reactive oxygen species (ROS) levels and Ca2+ dysregulation, with the non-toxic species appearing substantially ineffective at the first steps of the cellular toxicity cascade.
Materials and methods
Materials
All reagents were of analytical grade or the highest purity available. Foetal bovine serum (FBS), phosphate buffered saline (PBS), pluronic acid F-127 and other chemicals were from Sigma-Aldrich (St. Louis, MO, USA) unless otherwise stated. Fluo3-AM, Calcein-AM, CM-H2, DCFDA and BODIPY 581/591 C11 were prepared as stock solutions in dimethylsulfoxide (DMSO), purged with nitrogen and stored in light-protected vessels at −20°C until use. HypF-N, expressed and purified as previously reported [18], was converted into stable oligomers by incubation at 48 μM for 4 hrs at 25°C in two different experimental conditions: 50 mM acetate buffer, 12% (v/v) trifluoroethanol (TFE), 2 mM dithiothreitol (DTT), pH 5.5 (condition A) and 20 mM trifluoroacetic acid (TFA), 330 mM NaCl, pH 1.7 (condition B). Both types of HypF-N oligomers were centrifuged at 16,100 rcf, dried under N2 to remove water, TFE, DTT and TFA, dissolved in the appropriate culture media to reach a final HypF-N concentration of 12 μM and immediately added to cultured cells at differing final concentrations. No toxic effect was observed when the cells were incubated in the presence of samples obtained from similar initial solutions containing all reagents except the protein, excluding the possibility that residual TFE, DTT and TFA could induce cytotoxicity. Native HypF-N was tested by diluting the protein stock solution in the same cell media.
Cell cultures and rat model
Human SH-SY5Y neuroblastoma cells (A.T.C.C., Manassas, VA, USA) were cultured in DMEM F-12 Ham with 25 mM HEPES and NaHCO3 (1:1) supplemented with 10% FBS (Sigma-Aldrich) 1.0 mM glutamine and antibiotics. Murine Hend endothelium cells were cultured in DMEM supplemented with 10% FBS, 1.0 mM glutamine and antibiotics. All cell cultures were maintained in a 5% CO2 humidified atmosphere at 37°C.
Three-month-old (230–250 g) male Wistar rats (Harlan Nossan, Correzzana, Italy) were housed in macrolon cages until surgery and maintained on a 12 hrs light/dark cycle at 23°C. All animal manipulations were performed in vivo, according to the European Community guidelines for animal care (DL 116/92). For in vivo studies, native protein and aggregates were suspended in PBS at the final concentrations of 1.0 mg/ml (calculated as monomer protein concentration). In a series of experiments, the monomeric form of HypF-N was labelled with fluorescein-5-isothiocyanate (5-FITC) using AnaTag™ 5-FITC Microscale Protein Labeling Kit (AnaSpec, San Jose, CA, USA) and then converted into the aggregates. The 1.0 μl aliquots of protein solutions containing either native or the two oligomeric forms of HypF-N were injected into the nucleus basalis magnocellularis (NBM) of the basal forebrain of anaesthetized rats as previously described [20].
HypF-N aggregate internalization
The internalization of HypF-N aggregates into the cytosol was monitored in SH-SY5Y and Hend cells seeded on glass cover slips by confocal scanning microscopy as previously described [18]. Cells were incubated for 5, 10, 30, 60 and 180 min at 37°C with 12 μM HypF-N aggregates formed under conditions A or B. The cells were counterstained with 5 μg/ml Alexa Fluor 633-conjugated wheat germ agglutinin (Molecular Probes, Eugene, OR, USA) and the aggregates with 1:1000 diluted rabbit polyclonal anti-HypF-N antibody (Primm S.r.l., Milan, Italy) and then with 1:1000 diluted Alexa Fluor 488-conjugated anti-rabbit secondary antibody (Molecular Probes). Cell fluorescence was analysed by confocal Leica TCS SP5 scanning microscope (Mannheim, Germany) equipped with an argon laser source for fluorescence measurements at 488 nm and 633 nm and a Leica Plan Apo 63× oil immersion objective. A series of optical sections (1024 × 1024 pixels) 1.0 μm in thickness was taken through the cell depth for each examined sample.
ROS production and lipid peroxidation
To detect intracellular ROS production, the cells were exposed for 5, 10, 30 and 60 min at 37°C to 12 μM HypF-N aggregates and native protein in culture medium with or without Ca2+. In a series of experiments, cells were also pre-treated for 24 hrs with 100 μM vitamin E prior to aggregate exposure. 2′,7′-dichlorodihydrofluorescein diacetate (CM-H2, DCFDA, Molecular Probes) dye loading was achieved as previously described [21] and the emitted fluorescence was detected at 488-nm excitation by the confocal scanning system described earlier. Membrane lipid peroxidation was investigated by confocal microscope analysis of the fluorescent probe 4,4-difluoro-3a,4adiaza-s-indacene (BODIPY 581/591 C11, Molecular Probes). SH-SY5Y cells, cultured on glass cover slips, were incubated for 60 min at 37°C with 12 μM native or aggregated HypF-N. Dye loading was achieved as previously reported [21] and the emitted fluorescence was analysed at 581 nm excitation. The lipid peroxidation was also quantified in neuroblastoma cells using a FACSCanto flow cytometer (Beckton Dickinson Bioscences, San Jose, CA, USA). Briefly, the cells were incubated for 24 hrs at 37°C in culture medium containing 12 μM native or aggregated HypF-N and then loaded by adding 2.5 μM fluorescent BODIPY 581/591 C11 for 30 min.
Alteration of membrane permeability and cytosolic Ca2+ dyshomeostasis
To assess membrane integrity disruption, SH-SY5Y cells, plated on glass cover slips, were treated for 20 min at 37°C with 2.0 μM calcein-AM (Molecular Probes) diluted in culture medium, as previously described [22]. The decay in fluorescence was analysed by confocal microscope analysis at 488 nm following cell exposure to 12 μM native or aggregated HypF-N for differing lengths of time (5, 10, 30 and 60 min) at 37°C in culture medium with or without Ca2+. In a series of experiments, the cells were also pre-treated for 24 hrs with 100 μM vitamin E prior to aggregate exposure. Ca2+ dyshomeostasis was evaluated in the same experimental conditions as reported above. SH-SY5Y and Hend cells were then loaded for 30 min at 37°C with 10 μM fluo3-AM (Molecular Probes) and the emitted fluorescence was detected at 488 nm excitation [18].
Apoptotic and necrotic markers
Caspase-3 activity was evaluated on SH-SY5Y cells cultured on glass cover slip after exposure to 12 μM native or aggregated HypF-N for 0.5, 1, 3, 24 and 48 hrs at 37°C in culture medium with or without Ca2+. In a series of experiments, the cells were also pre-treated for 24 hrs with 100 μM vitamin E prior to 3 hrs aggregate exposure. The cells were loaded with FAM-FLICA™ Caspases 3&7 solution [Caspase 3&7 FLICA kit (FAM-DEVD-FMK), Immunochemistry Technologies, LLC, Bloomington, MN, USA] for 60 min and the emitted fluorescence was detected at 488 nm excitation by the confocal scanning system described above. Caspase-3 activity was also quantified by the FACSCanto flow cytometer described earlier. Lactate dehydrogenase (LDH) release into the culture media was measured after cell exposure for 12, 24, 48 and 72 hrs at 37°C to 12 μM native or aggregated HypF-N by the LDH assay kit (Roche Diagnostics, Mannheim, Germany) at 490 nm.
ChAT immunohistochemistry
Rats were killed by decapitation under deep chloral hydrate (400 mg/kg, intraperitoneally) anaesthesia 7 days after the injections. This was considered a reasonable time period to allow us to detect long-term effects of the injected aggregates in light of their likely persistence in tissue. Brains were quickly removed and fixed in phosphate-buffered 4% paraformaldehyde, pH 7.4, at 4°C for 48 hrs, then rinsed in PBS, dehydrated with an automatic machine and paraffin embedded. Ten micrometres coronal sections were cut with a microtome and mounted on slides. The sections were incubated in xylene for 20 min at room temperature to allow the removal of the paraffin and then they were rehydrated. Choline acetyltransferase (ChAT) immunohistochemistry was performed using 1:200 diluted goat polyclonal anti-ChAT antibody (Chemicon, CA, USA), 1:1000 diluted biotinylated anti-goat antibody (Vector Laboratories, Burlingame, CA, USA) and avidin–biotin system (Vectastain; Vector Laboratories) and 3,3′-diaminobenzidine (DAB) plus Nickel (DAB Kit: Vector Laboratories) as previously described [20]. ChAT-positive cells in the NBM were counted under a 10× objective lens of an Olympus Optical (Tokyo, Japan) BX40 microscope with an Olympus Optical DP50 digital camera, using a calibrated eyepiece grid. Five sections per animal, standardized in anteroposterior with respect to the injection site and spaced 50–100 μm from each other, were analysed. Morphometry was conducted by using analySIS 5 software (Soft Imaging System, Münster, Germany). The total number of counted ChAT-positive cells, carried out on five sections per animal, in the injected NBM of three animals for each conditions was averaged, expressed as percentage of that in the contralateral PBS-injected hemisphere of the same section (178 ± 8.4, mean ± S.D.) assumed as 100% and analysed using Prism 3.0 (GraphPad Software, San Diego, CA, USA). The presence of HypF-N 5-FITC-labeled aggregates was detected 24 hrs after protein injection by collecting the emitted fluorescence at 488 nm excitation using the confocal scanning system described earlier.
Determination of rate constants
The different intracellular fluorescence intensities associated with HypF-N aggregate internalization into the cells, ROS, calcein, free Ca2+ and caspase activation were plotted against the time elapsed after type A oligomers addition to the cell medium. A variable number of cells ranging from 10 to 22 were analysed for every fluorescent probe and time point in three different experiments. In all cases the fluorescence arising from untreated cells was subtracted from the fluorescence value observed in the presence of the oligomers. The kinetic plots were analysed with a procedure of best fitting using a single exponential function of the form
where F (∞) is the maximum fluorescence intensity of the processes attained at the end of the exponential phase, A is the amplitude of the fluorescence change and k is the apparent rate constant. The best fitting analysis was performed using the Kaleidagraph software (Synergy Software, Reading, PA, USA).
Statistical analysis
MTT and LDH data are expressed as mean ± S.D. Comparisons between the different groups were performed by anova followed by Bonferroni’s post comparison test. ChAT immunohistochemical data are expressed as mean ± S.D. and were analysed using the one-way ANOVA, followed by the Newman–Keuls multiple comparison test. A p-value less than 0.05 was accepted as statistically significant.
Results
Only toxic HypF-N oligomers are internalized into the cytosol with well-defined kinetics
Our previous results indicated that toxic oligomers formed in condition A and non-toxic oligomers formed in condition B have different abilities to penetrate the cell membrane when transferred to the extracellular medium of cultured SH-SY5Y cells [18]. In particular it was found that only the toxic oligomers were internalized into the cells, whereas the non-toxic ones interacted with the cell surface without crossing the membrane [18]. Here, we investigated the kinetics of oligomer internalization by adding both types of oligomers to the extracellular medium of cultured SH-SY5Y cells and acquiring confocal microscope images at different time points following such a treatment (Fig. 1A). The amount of type A oligomers inside the cells was found to increase quickly following their addition to the cell medium, with a significant quantity of such oligomers detected after 5 min only (Fig. 1A). The plot of the fluorescence associated with internalized HypF-N versus time elapsed after oligomer addition to the cell medium revealed single-exponential kinetics with a rate constant (k1) of 2.33(±0.46) × 10−3 sec−1 (Fig. 1B). On the other hand, type B aggregates were found to interact with the plasma membrane without entering the cytoplasm even after prolonged incubation of the oligomers with the cells (Fig. 1A). These findings confirm that only the toxic type A oligomers can cross the cell membrane, indicating that the absence of type B oligomer cellular internalization is not determined by the period of incubation of the cells with these oligomers. Accordingly, imaging different optical sections of Hend cells, including basal, apical and intermediate median planes, revealed the presence of HypF-N aggregates inside the cells (median planes) only when these were treated with the toxic oligomers formed under condition A (Fig. 1C). No fluorescence associated with HypF-N was detected in untreated cells and in cells incubated for 60 min with native HypF-N (Fig. 1A and C).
Fig 1.
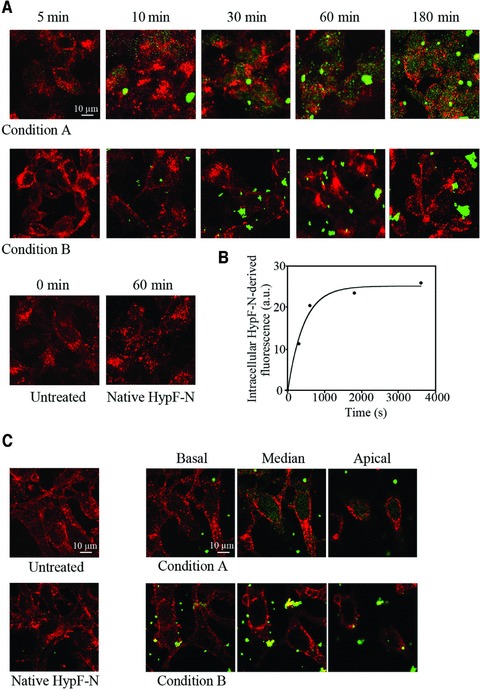
(A) Representative confocal microscope images showing SH-SY5Y cells exposed to 12 μM HypF-N oligomers grown in conditions A (upper panels) and B (middle panels) for the indicated time lengths. Untreated cells and cells exposed to the native protein are also shown (lower panels). After plasma membrane permeabilization with a 3% glycerol solution, counterstaining was performed with wheat germ agglutinin to detect plasma membrane profiles (red) and with anti-HypF-N antibody to detect the oligomers (green). (B) Kinetic plot reporting the fluorescence associated with internalized HypF-N versus time elapsed after oligomer addition to the cell medium. The intracellular fluorescence measured for untreated cells was subtracted from all values. A variable number of cells ranging from 10 to 22 were analysed for every time point in three different experiments. The continuous line through the data represents the best fit to a single-exponential function. (C) Representative confocal microscope images showing Hend cells after 60 min. exposure to culture medium with or without 12 μM native HypF-N. Optical sections taken through the cells by confocal scanning microscopy after treatment for 60 min. with HypF-N oligomers formed in condition A and B at basal, median and apical focal lengths.
Only cytotoxic HypF-N oligomers induce ROS production and membrane lipid peroxidation
The generation of intracellular ROS is one of the earliest biochemical changes that cells exposed to deleterious protein oligomers undergo [23–25]. HypF-N oligomers formed under condition A and added to the medium of cultured SH-SY5Y cells induced a rapid increase of ROS levels in the cells, clearly detectable after only 5 min incubation and reaching a plateau after 30–60 min (Fig. 2A). The time course of the ROS increase followed apparent single exponential kinetics, with a rate constant (k2) of 1.98(±0.24) × 10−3 sec−1 (Fig. 2B). By contrast, cells treated with type B oligomers showed an intracellular redox status similar to that found in untreated cells or in cells treated with native HypF-N for 60 min (Fig. 2A). Interestingly, an almost complete inhibition of ROS production in cells treated with type A oligomers was achieved by pre-incubating the cells with 100 μM vitamin E for 24 hrs, before the addition of the oligomers, or by using a Ca2+-free medium (Fig. 2A).
Fig 2.
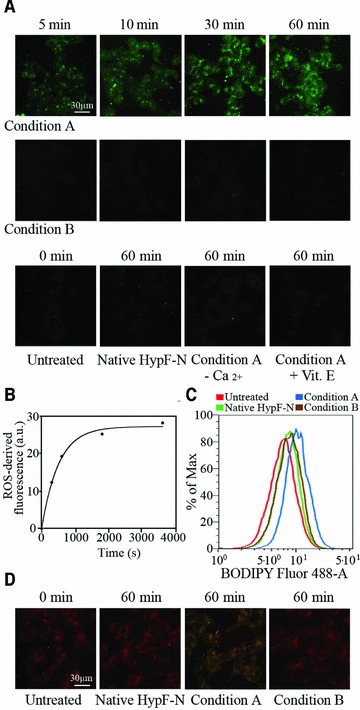
(A) Representative confocal microscope images showing intracellular ROS levels in SH-SY5Y cells exposed for the indicated time lengths to oligomers formed under conditions A (upper panels) or B (middle panels). The figure also shows images obtained with untreated cells, cells exposed to the native protein, cells exposed to type A oligomers in a Ca2+-free medium or following a 24 hrs pre-incubation with vitamin E (lower panels). All images were acquired by simultaneously incubating cells with oligomers and CM-H2, DCFDA in the last 10 min. of exposure to the oligomers. (B) Kinetic plot showing the fluorescence associated with ROS versus time elapsed after oligomer addition to the cell medium. The fluorescence measured for untreated cells was subtracted from all values. A variable number of cells ranging from 15 to 25 were analysed for every time point in three different experiments. (C) Flow cytometric analyses of lipid peroxidation in SH-SY5Y untreated cells (red), cells treated for 24 hrs with native HypF-N (green), or with oligomers grown under conditions A (blue) or B (brown). After oligomer exposure single-cell suspensions were incubated with the fluorescent probe BODIPY 581/591 C11. (D) Representative confocal microscope images illustrating lipid peroxidation in untreated SH-SY5Y cells, cells exposed for 60 min. to native HypF-N or oligomers grown under conditions A or B, as assessed using BODIPY 581/591.
Membrane lipid peroxidation in cultured SH-SY5Y cells was also evaluated after addition of type A and type B oligomers, using both flow cytometric and confocal microscopy analyses. The fluorescence intensity distributions detected in flow cytometry after treating the cells for 24 hrs with native HypF-N and type B oligomers were superimposable with that obtained with untreated cells (Fig. 2C). By contrast, the fluorescence intensity distribution determined with cells treated for 24 hrs with type A oligomers was shifted to higher values (Fig. 2C). This shift indicated an increase in membrane lipid peroxidation after prolonged exposure of the cultured cells to type A oligomers. Accordingly, the red fluorescence signal observed with confocal microscopy from cells exposed for 60 min to native HypF-N and type B oligomers did not differ significantly relative to untreated cells; a considerable shift to green fluorescence signal was indeed observed only in cells exposed to type A oligomers for 60 min, indicating an increase in membrane oxidative injury (Fig. 2D).
Only cytotoxic HypF-N oligomers induce an influx of extracellular Ca2+ into the cytosol
The influx of Ca2+ ions from the extracellular space into the cytosol across the cell membrane has been recognized to be an early insult in cells exposed to deleterious protein oligomers [26–29]. The level of intracellular Ca2+ ions was evaluated, by means of confocal microscopy, at different time points after the addition of type A and type B oligomers to the extracellular medium of SH-SY5Y and Hend cells. Oligomers formed under condition A induced a rapid and sharp increase in cytosolic free Ca2+ in both cell lines (Fig. 3A and B). The increase was evident already after 5 min and increased further later on. The kinetic analysis revealed that the increase of intracellular Ca2+ levels in SH-SY5Y and Hend cells followed apparent single-exponential kinetics with rate constants (k3 and k4) of 5.06(±0.87) × 10−3 sec−1 and 4.0(±0.22) × 10−3 sec−1, respectively (Fig. 3A and B). In contrast, treating both cell lines with HypF-N oligomers formed under condition B did not cause any increase in intracellular Ca2+ ions even after prolonged incubation with the cells. Similarly, no increase in intracellular Ca2+ ions was observed in SH-SY5Y and Hend cells exposed to native HypF-N (Fig. 3A and B). The sharp increase of cytosolic Ca2+ caused by the addition of type A oligomers was inhibited when the cells were cultured in a Ca2+-free medium, suggesting that the observed increase of intracellular Ca2+ ions was caused by an influx from the extracellular medium (Fig. 3A and B). The pre-treatment of the cells with 100 μM vitamin E also prevented the cytosolic Ca2+ spike (Fig. 3A and B).
Fig 3.
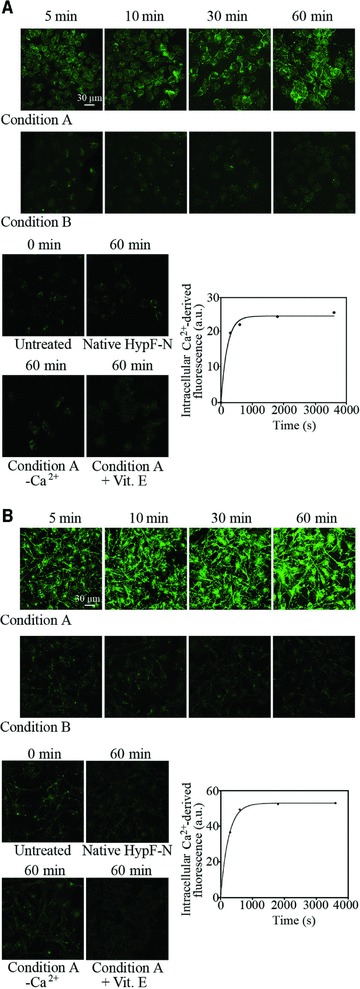
Representative confocal microscope images showing intracellular Ca2+ levels in SH-SY5Y (A) and Hend (B) cells exposed for the indicated time lengths to oligomers formed under conditions A or B. The figure also shows images obtained with untreated cells, cells exposed to the native protein and cells exposed to type A oligomers in a Ca2+-free medium or following a 24 hrs pre-incubation with vitamin E. After oligomer exposure cells were treated with Fluo-3-AM. Kinetic plots showing the fluorescence associated with intracellular Ca2+versus time elapsed after oligomer addition to the SH-SY5Y and Hend cell media, after subtracting the fluorescence measured for untreated cells. A variable number of cells ranging from 20 to 30 were analysed for every time point in three different experiments.
Cytotoxic HypF-N oligomers disrupt plasma membrane integrity
We next loaded SH-SY5Y cells with the calcein-AM fluorescent probe. A time-dependent decrease in intracellular calcein-derived fluorescence was observed when the cells were exposed to HypF-N oligomers formed under condition A (Fig. 4A). However, the decay in calcein fluorescence appeared to be slower than the increase of intracellular Ca2+ and ROS levels following oligomer addition, with an apparent rate constant (k5) of 7.54(±2.25) × 10−4 sec−1 (Fig. 4B). By contrast, no decrease in calcein fluorescence was observed in cells treated with HypF-N oligomers formed under condition B or with the native protein (Fig. 4A). The decay in calcein fluorescence resulting from the exposure to type A oligomers was prevented when the cells were cultured in a Ca2+-free medium or pre-treated with 100 μM vitamin E for 24 hrs (Fig. 4A).
Fig 4.
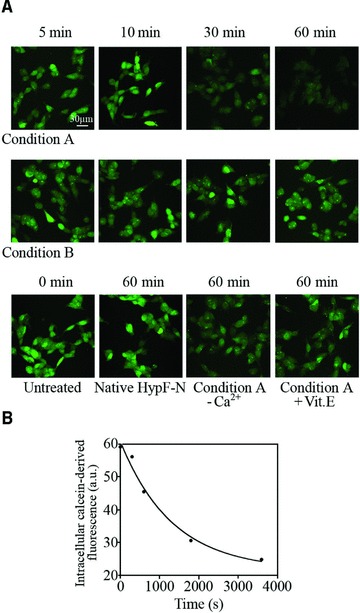
(A) Representative confocal microscope images showing SH-SY5Y cells pre-loaded with calcein-AM and then exposed for the indicated time lengths to oligomers formed under conditions A (upper panels) or B (middle panels). The figure also shows images obtained with untreated cells, cells exposed to the native protein and cells exposed to type A oligomers in a Ca2+-free medium or following a 24 hrs pre-incubation with vitamin E (lower panels). The cells were pre-loaded with calcein-AM (green) for 20 min. and then treated with the oligomers. (B) Kinetic plot showing the fluorescence associated with intracellular calcein versus time elapsed after oligomer addition to the cell medium. A variable number of cells ranging from 10 to 20 were analysed for every time point in four different experiments.
Cytotoxic HypF-N oligomers trigger apoptotic pathways
We then evaluated whether the different ability of type A and type B oligomers to induce cytosolic ROS production and Ca2+ influx resulted in cell death. This analysis was achieved by measuring the caspase-3 activity, a well-recognized apoptotic marker [30], and using confocal microscopy and flow cytometry. In the confocal microscope images, the caspase-3 activity was already evident in SH-SY5Y cells after 3 hrs and appeared to be markedly increased after a 24 hrs treatment with oligomers formed under condition A. The kinetic analysis revealed that the increase in caspase-3 activation in SH-SY5Y cells followed apparent single-exponential kinetics with a rate constant (k6) of 8.35(±3.04) × 10−5 sec−1 (Fig. 5B). On the other hand, negligible caspase-3 activation was detected when cells were treated for different lengths of time with HypF-N oligomers formed under condition B (Fig. 5A). A negligible caspase-3 activation was also detected when the cells were treated with native HypF-N (Fig. 5A). The early increase (3 hrs) in caspase-3 activity caused by the addition of type A oligomers was reduced when the cells were cultured in a Ca2+-free medium, suggesting a primary role of extracellular Ca2+ influx in the apoptotic pathway (Fig. 5A). Cell pre-treatment with 100 μM vitamin E also reduced caspase-3 activation (Fig. 5A). In agreement with these results, the flow cytometric analysis showed a marked increase of fluorescence associated with caspase-3 activity in cells treated for 24 hrs with type A oligomers (Fig. 5C).
Fig 5.
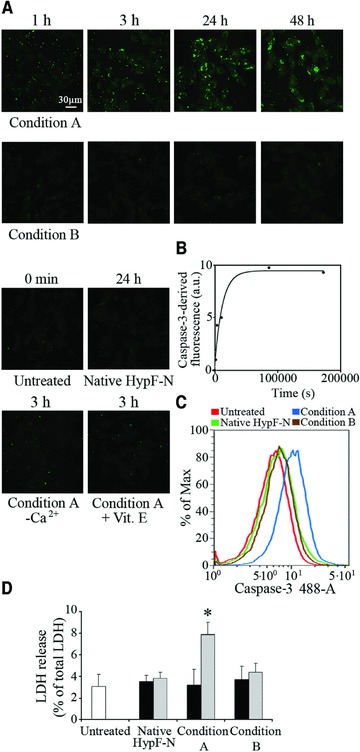
(A) Representative confocal microscope images showing caspase-3 activation in SH-SY5Y cells treated for the indicated time lengths with type A (upper panels) and B (middle panels) HypF-N oligomers. The figure also shows images obtained with untreated cells, cells exposed for 24 hrs to the native protein, cells exposed for 3 hrs to type A oligomers in a Ca2+-free medium or following a 24 hrs pre-incubation with vitamin E (lower panels). Caspase-3 activity was assessed using the fluorescent probe FAM-FLICA™ Caspase 3&7 (green). (B) Kinetic plot showing the fluorescence associated with caspase-3 versus time elapsed after oligomer addition to the cell medium, after subtracting the fluorescence measured for untreated cells. A variable number of cells ranging from 15 to 20 were analysed for every time point in two different experiments. (C) Flow cytometric analyses of caspase-3 activity in SH-SY5Y untreated cells (red), cells treated for 24 hrs with native HypF-N (green), or with oligomers formed in condition A (blue) or B (brown). (D) SH-SY5Y cell viability checked by LDH release into the culture medium after 24 hrs (black bars) and 48 hrs (grey bars) treatment with native HypF-N or with oligomers formed under conditions A and B. The values shown are means ± S.D. of three independent experiments, each performed in triplicate. The asterisk (*) refers to P values lower than 0.05.
We then investigated whether cells exposed to HypF-N oligomers also underwent necrotic cell death. The analysis was performed by measuring the release of LDH, a widely used necrotic marker, in the medium of cultured SH-SY5Y cells treated for 24 and 48 hrs with type A and type B oligomers. After 24 hrs treatment, cells exposed to type A and type B oligomers displayed an LDH release similar to that of untreated cells or cells treated with native HypF-N (Fig. 5D). A significant, albeit weak, increase in LDH release was observed only in cells exposed to type A oligomers for 48 hrs, supporting the presence of a minor and late necrotic outcome in this case (Fig. 5D). The comparison between caspase-3 and LDH data suggests that a necrotic outcome follows the apoptotic pathway and that necrosis occurs only in a small percentage of SH-SY5Y cells at the latest time point studied here.
Cytotoxic HypF-N oligomers affect ChAT immunoreactivity in rat brains
To assess whether the different abilities of type A and type B oligomers to cause dysfunction of cultured cells can be reproduced in an animal model, both types of aggregates were labelled with the fluorophore 5-FITC and then microinjected into the NBM of rat brains. Figure 6A shows representative confocal microscope images of the forebrain NBM from rats obtained 24 hrs after the injection. The images show that both aggregate species remained in the tissue for sufficient lengths of time to potentially induce substantial effects. The number of ChAT-positive neurons, an inverse correlate of the degree of neuronal stress produced by the oligomers to cholinergic neurons, was detected by an immunohistochemical analysis 7 days after HypF-N injection. A high intensity of staining in the magnocellular neurons confirmed the presence of ChAT immunoreactivity in this region of the brain when only PBS buffer was injected in the NBM (Fig. 6B). No reduction of ChAT immunoreactivity was observed when the forebrain NBM was injected with native HypF-N (Fig. 6B). However, the number of ChAT-positive neurons appeared to be significantly reduced after injection with HypF-N oligomers formed in condition A (Fig. 6B). The ChAT-positive neurons were 39 ± 3.1% of those counted in the NBM of the contralateral hemisphere injected with PBS (Fig. 6C). By contrast, the number of ChAT-positive neurons appeared to be only slightly reduced after injection of the aggregates formed under condition B (87 ± 3.7%), relative to the contralateral hemisphere injected with PBS (Fig. 6B and C). These results indicate that the two types of stable oligomers analysed here have different abilities to affect cholinergic neuronal cells in rat models, in agreement with their different toxicities observed in neuroblastoma cultured cells.
Fig 6.
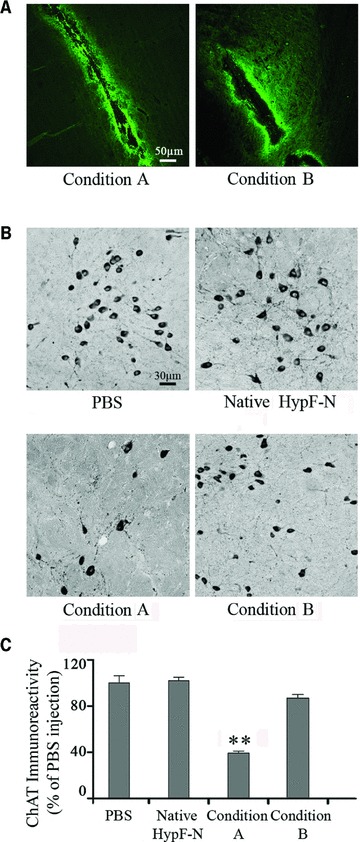
Analysis of ChAT-positive immunoreactivity in the NBM of 3-month-old (230–250 g) male Wistar rats. (A) Representative confocal microscope images (10× magnification) of the sites of microinjection in rat NBM obtained 24 hrs after injection of HypF-N 5-FITC-labelled oligomers formed under condition A (left) or B (right). (B) Representative photomicrographs (20× magnification) obtained 7 days after injection of 1.0 μl PBS (top-left), 1.0 μg native HypF-N (top-right), 1.0 μg HypF-N oligomers formed under condition A (bottom-left) and B (bottom-right). ChAT immunoreactivity was localized in intensely labelled NBM neurons located at the border between the internal capsule and the globus pallidus. (C) Quantification of ChAT immunoreactivity in the NBM after the injections (5 sections per animal). The values shown are means ± S.D. of the measurements carried out on three animals for each conditions, each analysed in five sections. Statistical analysis on the mean was performed by one-way ANOVA, followed by the Newman–Keuls multiple comparison test (F= 26.07; P < 0.05). The reported data and experimental errors refer to the mean ± S.D. The double asterisk (**) refer to P values lower than 0.001 relative to treatment with PBS, native HypF-N and type B oligomers.
Discussion
A number of biochemical modifications, eventually leading to cell death, have been reported in cells exposed to toxic protein aggregates of several different peptides and proteins either in whole animals or in different cultured cell lines [30–36]. Previous reports have shown that prefibrillar aggregates of proteins that are not associated with disease are toxic to cells in a manner similar to early aggregates of disease-related proteins and peptides by impairing the same biochemical parameters [13, 15, 35]. In this study, we have compared the effects of two different types of HypF-N oligomers, one of which is benign when added to cell cultures whereas the other one is toxic [18]. We have studied different biochemical modifications caused by the two types of protein oligomers and measured their time scales, with an aim of identifying the stage at which the toxic oligomers cause cellular dysfunction. Under our experimental conditions, two different cell lines were similarly injured by toxic HypF-N aggregates, suggesting a general mechanism by which these oligomers can affect different types of cells.
The toxic oligomers (type A) were found to cause a rapid influx of Ca2+ ions from the extracellular space into the cytosol of both cell lines, with an apparent rate constant of ca. 5 × 10⁻³ sec−1. This early modification is associated with a slower increase of ROS levels and cellular internalization of protein oligomers, both events found to occur with an apparent rate constant of ca. 2 × 10⁻³ sec−1. The permeabilization of the membrane to an extent sufficient to allow the release of intracellular calcein was found to occur on a slower time scale, with an apparent rate constant of ca. 7 × 10⁻⁴ sec−1. Finally, such biochemical modifications resulted in caspase-3 activation, with an apparent rate constant of ca. 8 × 10⁻⁵ sec−1. None of such effects was found to be caused by the non-toxic oligomers (type B), indicating that the difference between toxic and non-toxic oligomers in the mechanism of action by which toxicity is mediated involve the early stages of the cell dysfunction process. The increases of oxidative stress and Ca2+ influx caused by the toxic oligomers are both inhibited when the cells were pre-incubated with either vitamin E or in a Ca2+-free medium. Usually, the intracellular rise of free Ca2+ is associated with the elevation of ROS, possibly following the activation of the oxidative metabolism to respond to the increased need for ATP by the calcium pumps [37]. Oxidative damage may further exacerbate oligomer-mediated toxicity [38]. Indeed, Aβ is reported to accumulate faster in membranes containing oxidatively damaged phospholipids than in membranes containing only unoxidized or saturated phospholipids [39]. For this reason, the cultured cells do not experience any of the two deleterious effects when they are pre-treated with vitamin E or with a Ca2+-free medium. Indeed, the absence of extracellular Ca2+ prevents the influx of the ions into the cytosol and thus the oxidative metabolism required to re-store the Ca2+ homeostasis and responsible for the accumulation of ROS. Similarly, the treatment of the cells with vitamin E effectively tackles the increase of ROS levels and prevents the damaging effects caused by ROS, allowing the cells to restore the Ca2+ homeostasis.
The alteration of the intracellular free Ca2+ levels is considered a key modification determining the fate of a cell in terms of life or death; indeed, an increase of free Ca2+ may trigger apoptosis indirectly, by affecting mitochondrial functionality, and/or directly, by activating caspases and calpains [26]. Accordingly, caspase-3 levels are markedly increased in cells exposed to type A oligomers. Therefore, our results suggest that cell treatment with HypF-N type A oligomers, showing a low degree of packing of the hydrophobic residues within their cores and a high structural flexibility of such residues, induces initially intracellular Ca2+ dyshomeostasis, then aggregate internalization coupled to oxidative stress and finally membrane damage, which triggers the apoptotic pathway. In contrast, cell exposure to native HypF-N or to the more structurally packed type B oligomers prevents Ca2+ dyshomeostasis, protein internalization, oxidative attack, membrane damage, and ultimately apoptosis. The biochemistry of cell death following exposure to the toxic amyloid aggregates is still under investigation [30, 40]. Our results suggest that the early increase in caspase-3 activity may trigger necrosis as a later outcome of cell death, at least in a minor proportion of cells.
We also showed that the two types of HypF-N oligomers have different abilities to change the normal lifespan of ChAT-positive neurons of rats in vivo, suggesting a different degree of neuronal stress produced by these injected species into the NBM of rat brains. In particular, only the type A aggregates are able to induce a loss of cholinergic neurons, whereas the type B oligomers show no toxic effect on cholinergic neurons, similarly to the native protein. It thus appears that the difference in the ability of type A and type B oligomers to cause cell dysfunction is not restricted to cultured cell lines but also appears to be a fundamental difference in complex organisms as well.
In conclusion, our data indicate that the exposure and flexibility of hydrophobic residues on the surface of protein oligomers correlate with the ability of such species to cause cell dysfunction by acting at the early stages of the toxicity cascade, i.e. by compromising the Ca2+ homeostasis. Such detailed knowledge of the early toxic events caused by amyloid-like oligomers contributes to the identification of new valuable targets for therapeutic interventions aimed at preventing the onset of protein deposition diseases.
Acknowledgments
This study has been supported by grants from the Italian MIUR (PRIN2008R25HBW) and from the Fondazione Cassa di Risparmio di Pistoia e Pescia (project no. 2009.0202).
Conflict of interest
The authors confirm that there are no conflicts of interest.
References
- 1.Selkoe DJ. Folding proteins in fatal ways. Nature. 2003;426:900–4. doi: 10.1038/nature02264. [DOI] [PubMed] [Google Scholar]
- 2.Chiti F, Dobson CM. Protein misfolding, functional amyloid, and human disease. Annu Rev Biochem. 2006;75:333–66. doi: 10.1146/annurev.biochem.75.101304.123901. [DOI] [PubMed] [Google Scholar]
- 3.Merlini G, Bellotti V. Molecular mechanisms of amyloidosis. N Engl J Med. 2003;349:583–96. doi: 10.1056/NEJMra023144. [DOI] [PubMed] [Google Scholar]
- 4.Silveira JR, Raymond GJ, Hughson AG, et al. The most infectious prion protein particles. Nature. 2005;437:257–61. doi: 10.1038/nature03989. [DOI] [PMC free article] [PubMed] [Google Scholar]
- 5.Rahimi F, Shanmugam A, Bitan G. Structure-function relationships of pre-fibrillar protein assemblies in Alzheimer’s disease and related disorders. Curr Alzheimer Res. 2008;5:319–41. doi: 10.2174/156720508784533358. [DOI] [PMC free article] [PubMed] [Google Scholar]
- 6.Cookson MR, van der Brug M. Cell systems and the toxic mechanism(s) of alpha-synuclein. Exp Neurol. 2008;209:5–11. doi: 10.1016/j.expneurol.2007.05.022. [DOI] [PMC free article] [PubMed] [Google Scholar]
- 7.Yip CM, McLaurin J. Amyloid-β peptide assembly: a critical step in fibrillogenesis and membrane disruption. Biophys J. 2001;80:1359–71. doi: 10.1016/S0006-3495(01)76109-7. [DOI] [PMC free article] [PubMed] [Google Scholar]
- 8.Kelly BL, Ferreira A. Beta-Amyloid-induced dynamin 1 degradation is mediated by N-methyl-D-aspartate receptors in hippocampal neurons. J Biol Chem. 2006;281:28079–89. doi: 10.1074/jbc.M605081200. [DOI] [PubMed] [Google Scholar]
- 9.Dobson CM. Protein misfolding, evolution and disease. Trends Biochem Sci. 1999;24:329–32. doi: 10.1016/s0968-0004(99)01445-0. [DOI] [PubMed] [Google Scholar]
- 10.Stefani M, Dobson CM. Protein aggregation and aggregate toxicity: new insights into protein folding, misfolding diseases and biological evolution. J Mol Med. 2003;81:678–99. doi: 10.1007/s00109-003-0464-5. [DOI] [PubMed] [Google Scholar]
- 11.Uversky VN, Fink AL. Conformational constraints for amyloid fibrillation: the importance of being unfolded. Biochim Biophys Acta. 2004;1698:131–53. doi: 10.1016/j.bbapap.2003.12.008. [DOI] [PubMed] [Google Scholar]
- 12.Chiti F, Bucciantini M, Capanni C, et al. Solution conditions can promote formation of either amyloid protofilaments or mature fibrils from the HypF N-terminal domain. Protein Sci. 2001;10:2541–7. doi: 10.1110/ps.10201. [DOI] [PMC free article] [PubMed] [Google Scholar]
- 13.Bucciantini M, Giannoni E, Chiti F, et al. Inherent toxicity of aggregates implies a common mechanism for protein misfolding diseases. Nature. 2002;416:507–11. doi: 10.1038/416507a. [DOI] [PubMed] [Google Scholar]
- 14.Relini A, Torrassa S, Rolandi R, et al. Monitoring the process of HypF fibrillization and liposome permeabilization by protofibrils. J Mol Biol. 2004;338:943–57. doi: 10.1016/j.jmb.2004.03.054. [DOI] [PubMed] [Google Scholar]
- 15.Cecchi C, Baglioni S, Fiorillo C, et al. Insights into the molecular basis of the differing susceptibility of varying cell types to the toxicity of amyloid aggregates. J Cell Sci. 2005;118:3459–70. doi: 10.1242/jcs.02473. [DOI] [PubMed] [Google Scholar]
- 16.Calloni G, Taddei N, Plaxco KW, et al. Comparison of the folding processes of distantly related proteins. Importance of hydrophobic content in folding. J Mol Biol. 2003;330:577–91. doi: 10.1016/s0022-2836(03)00627-2. [DOI] [PubMed] [Google Scholar]
- 17.Marcon G, Plakoutsi G, Canale C, et al. Amyloid formation from HypF-N under conditions in which the protein is initially in its native state. J Mol Biol. 2005;347:323–35. doi: 10.1016/j.jmb.2005.01.034. [DOI] [PubMed] [Google Scholar]
- 18.Campioni S, Mannini B, Zampagni M, et al. A causative link between the structure of aberrant protein oligomers and their ability to cause cellular dysfunction. Nat Chem Biol. 2010;6:140–7. doi: 10.1038/nchembio.283. [DOI] [PubMed] [Google Scholar]
- 19.Campioni S, Mossuto MF, Torrassa S, et al. Conformational properties of the aggregation precursor state of HypF-N. J Mol Biol. 2008;379:554–67. doi: 10.1016/j.jmb.2008.04.002. [DOI] [PubMed] [Google Scholar]
- 20.Baglioni S, Casamenti F, Bucciantini M, et al. Prefibrillar amyloid aggregates could be generic toxins in higher organisms. J Neurosci. 2006;26:8160–7. doi: 10.1523/JNEUROSCI.4809-05.2006. [DOI] [PMC free article] [PubMed] [Google Scholar]
- 21.Pensalfini A, Zampagni M, Liguri G, et al. Membrane cholesterol enrichment prevents Abeta-induced oxidative stress in Alzheimer’s fibroblasts. Neurobiol Aging. 2011;32:210–22. doi: 10.1016/j.neurobiolaging.2009.02.010. [DOI] [PubMed] [Google Scholar]
- 22.Cecchi C, Rosati F, Pensalfini A, et al. Seladin-1/DHCR24 protects neuroblastoma cells against Abeta toxicity by increasing membrane cholesterol content. J Cell Mol Med. 2008;12:1990–2002. doi: 10.1111/j.1582-4934.2008.00216.x. [DOI] [PMC free article] [PubMed] [Google Scholar]
- 23.Canevari L, Abramov AY, Duchen MR. Toxicity of amyloid beta peptide: tales of calcium, mitochondria, and oxidative stress. Neurochem Res. 2004;29:637–50. doi: 10.1023/b:nere.0000014834.06405.af. [DOI] [PubMed] [Google Scholar]
- 24.Cecchi C, Pensalfini A, Baglioni S, et al. Differing molecular mechanisms appear to underlie early toxicity of prefibrillar HypF-N aggregates to different cell types. FEBS J. 2006;273:2206–22. doi: 10.1111/j.1742-4658.2006.05234.x. [DOI] [PubMed] [Google Scholar]
- 25.Lovell MA, Markesbery WR. Amyloid beta peptide, 4-hydroxynonenal and apoptosis. Curr Alzheimer Res. 2006;3:359–64. doi: 10.2174/156720506778249506. [DOI] [PubMed] [Google Scholar]
- 26.Orrenius S, Zhovotovsky B, Nicotera P. Regulation of cell death: the calcium-apoptosis link. Nat Rev. 2003;4:552–65. doi: 10.1038/nrm1150. [DOI] [PubMed] [Google Scholar]
- 27.Demuro A, Mina E, Kayed R, et al. Calcium dysregulation and membrane disruption as a ubiquitous neurotoxic mechanism of soluble amyloid oligomers. J Biol Chem. 2005;280:17294–300. doi: 10.1074/jbc.M500997200. [DOI] [PubMed] [Google Scholar]
- 28.Canale C, Torrassa S, Rispoli P, et al. Natively folded HypF-N and its early amyloid aggregates interact with phospholipid monolayers and destabilize supported phospholipid bilayers. Biophys J. 2006;91:4575–88. doi: 10.1529/biophysj.106.089482. [DOI] [PMC free article] [PubMed] [Google Scholar]
- 29.Bojarski L, Herms J, Kuznicki J. Calcium dysregulation in Alzheimer’s disease. Neurochem Int. 2008;52:621–33. doi: 10.1016/j.neuint.2007.10.002. [DOI] [PubMed] [Google Scholar]
- 30.Bucciantini M, Calloni G, Chiti F, et al. Prefibrillar amyloid protein aggregates share common features of cytotoxicity. J Biol Chem. 2004;279:31374–82. doi: 10.1074/jbc.M400348200. [DOI] [PubMed] [Google Scholar]
- 31.Morishima Y, Gotoh Y, Zieg J, et al. Beta-amyloid induces neuronal apoptosis via a mechanism that involves the c-Jun N terminal kinase pathway and the induction of Fas ligand. J Neurosci. 2001;21:7551–60. doi: 10.1523/JNEUROSCI.21-19-07551.2001. [DOI] [PMC free article] [PubMed] [Google Scholar]
- 32.Velez-Pardo C, Arroyave ST, Lopera F, et al. Ultrastructure evidence of necrotic neural cell death in familial Alzheimer’s disease brains bearing presenilin-1 E280A mutation. J Alzheimers Dis. 2001;3:409–15. doi: 10.3233/jad-2001-3408. [DOI] [PubMed] [Google Scholar]
- 33.Zhang Y, McLaughlin R, Goodyer C, et al. Selective cytotoxicity of intracellular amyloid beta peptide1–42 through p53 and Bax in cultured primary human neurons. J Cell Biol. 2002;156:519–29. doi: 10.1083/jcb.200110119. [DOI] [PMC free article] [PubMed] [Google Scholar]
- 34.Bhagat YA, Obenaus A, Richardson JS, et al. Evolution of beta-amyloid induced neuropathology: magnetic resonance imaging and anatomical comparisons in the rodent hippocampus. Magn Reson Mater Phy. 2002;14:223–32. doi: 10.1007/BF02668216. [DOI] [PubMed] [Google Scholar]
- 35.Kranenburg O, Kroon-Batenburg LMJ, Reijerkerk A, et al. Recombinant endostatin forms amyloid fibrils that bind and are cytotoxic to murine neuroblastoma cells in vitro. FEBS Lett. 2003;539:149–55. doi: 10.1016/s0014-5793(03)00218-7. [DOI] [PubMed] [Google Scholar]
- 36.Iijima K, Liu HP, Chiang AS, et al. Dissecting the pathological effects of human Aβ40 and Aβ42 in Drosophila: a potential model for Alzheimer’s disease. Proc Natl Acad Sci USA. 2004;101:6623–8. doi: 10.1073/pnas.0400895101. [DOI] [PMC free article] [PubMed] [Google Scholar]
- 37.Squier TC. Oxidative stress and protein aggregation during biological aging. Exp Gerontol. 2001;36:1539–50. doi: 10.1016/s0531-5565(01)00139-5. [DOI] [PubMed] [Google Scholar]
- 38.Kinnunen PKJ. Amyloid formation on lipid membrane surfaces. Open Biol J. 2009;2:163–75. [Google Scholar]
- 39.Murray IV, Liu L, Komatsu H, et al. Membrane-mediated amyloidogenesis and the promotion of oxidative lipid damage by amyloid beta proteins. J Biol Chem. 2007;282:9335–45. doi: 10.1074/jbc.M608589200. [DOI] [PMC free article] [PubMed] [Google Scholar]
- 40.Yu JT, Chang RC, Tan L. Calcium dysregulation in Alzheimer’s disease: from mechanisms to therapeutic opportunities. Prog Neurobiol. 2009;89:240–55. doi: 10.1016/j.pneurobio.2009.07.009. [DOI] [PubMed] [Google Scholar]