

Abstract
Despite tremendous efforts in disclosing the pathophysiological and epidemiological factors associated with liver fibrogenesis, non-invasive diagnostic measures to estimate the clinical outcome and progression of liver fibrogenesis are presently limited. Therefore, there is a mandatory need for methodologies allowing the reasonable and reliable assessment of the severity and/or progression of hepatic fibrogenesis. We here performed proteomic serum profiling by matrix-assisted laser desorption ionization time-of-flight mass spectrometry in 179 samples of patients chronically infected with hepatitis C virus and 195 control sera. Multidimensional analysis of spectra allowed the definition of algorithms capable to distinguish class-specific protein expression profiles in serum samples. Overall about 100 peaks could be detected per single spectrum. Different algorithms including protein peaks in the range of 2000 and 10,000 Da were generated after pre-fractionation on a weak cation exchange surface. A specificity of 93% with a sensitivity of 86% as mean of the test set results was found, respectively. The nature of three of these protein peaks that belonged to kininogen-1 and thymosin-β4 was further analysed by tandem mass spectrometry (MS)/MS. We further found that kininogen-1 mRNA was significantly down-regulated in cirrhotic livers. We have identified kininogen-1 and thymosin-β4 as potential new biomarkers for human chronic hepatitis C and conclude that serum profiling is a reliable technique to identify hepatitis-associated expression patterns. Based on the high throughput capability, the identified differential protein panel may serve as a diagnostic marker and warrants further validation in larger cohorts.
Keywords: proteomics, serum profiling, fibrosis, inflammation, hepatitis C, mass spectrometry, kininogen-1, thymosin-β4
Introduction
Worldwide, 170 million people are infected with hepatitis C virus (HCV) and more than 350 million people by the hepatitis B virus (HBV) [1, 2]. Routine screening for HBV and HCV using second- or third-generation enzyme linked immunosorbent assay (ELISA) assays or novel sol-gel-based antigen microarray systems allow the sensitive detection of respective viral hepatitis antigens or antibodies with high diagnostic accuracy, sensitivity and specificity [3]. Nevertheless, the absence of detectable antibodies during the acute phase of infection in several chronically infected patients and the lack of reliable, organ- and disease-specific, non-invasive biomarkers of hepatic fibrosis are presently diagnostic challenges. More importantly, the accurate assessment of severity of histopathological lesions, inflammation and fibrosis in patients with chronic hepatitis infection that are key parameters to assess prognosis and indicators of antiviral treatments is mainly based on the pathological evaluation of needle liver biopsies. Although imaging techniques such as ultrasound, transient elastography (e.g. FibroScan), computerized tomography scans, magnetic resonance imaging or even 3D-whole liver perfusion magnetic resonance imaging are able to diagnose cirrhosis with high specificity, they have important drawbacks in detecting and differentiation of less advanced stages of fibrosis [4–8]. Therefore, new technologies for isolation of appropriate specific and sensitive biomarkers for estimation of hepatic injury are currently in progress. In hepatology research, promising developments in proteomic array technology as well as serum and plasma profiling that couple special surface-ligated protein chip technology with surface-enhanced laser desorption ionization (SELDI) or matrix-assisted laser desorption ionization (MALDI) time-of-flight (TOF) mass spectrometry have already been in focus for the diagnosis of hepatocellular carcinoma (HCC) [9, 10], non-alcoholic fatty liver disease [11], HCV-induced fibrogenesis [12, 13] and other. One HCV-based study was also performed with the SELDI approach with HCC and fibrosis patient sera to distinguish between low stage fibrosis versus cirrhosis and HCC [14]. In a recent report using a traditional and very time consuming 2D-polyacrylamide gel electrophoresis/LC-MS/MS platform, seven individual protein spots were identified as either significantly increased (α2-macroglobulin, haptoglobin, an albumin fragment) or decreased (complement C-4, serum retinol binding protein, apolipoprotein A-I, and two isoforms of apolipoprotein A-IV) in serum of HCV patients with advanced fibrosis [15]. However, these proteins are highly abundant and their overall disease specificity is questionable. In fact, only 1% of the entire protein content of serum is made up of proteins that are considered to be in low abundance and of great interest in proteomic studies in search of potential biomarkers [16].
A more recent proteomic-based study has identified a fragment of the complement component C3a as a potential marker for the early detection of HCV-related liver insults [17]. The HCV core protein itself that is involved in viral pathogenesis was also found in a 2D polyacrylamide gel electrophoresis proteome approach to affect the steady-state levels of a special subset of mitochondrial proteins including prohibitin, which may lead to an impaired function of the mitochondrial respiratory chain with the overproduction of oxidative stress [18].
A major obstacle in screening for diagnostic relevant biomarkers for assessment of hepatitis infection and its association with liver damage (i.e. inflammation, fibrosis) is the tremendous molecular heterogeneity in viral genetic, viral load and patient’s susceptibility. Therefore, it is likely that the simultaneous screening of multiple biomarkers and the definition of mathematical algorithms that imply diagnostic validity is necessary to improve the overall reliability of disease diagnosis from serum samples.
In this study, we analysed serum samples of 179 patients suffering from chronic HCV infection that were enrolled by the German Competence Network in Hepatitis (Hep-Net) and 195 non-infected control samples by MALDI-TOF-MS. Protein signatures were clustered and obtained multidimensional analysis of spectra resulted in the definition of algorithms allowing the identification of specific hepatitis-associated serum protein profiles with high sensitivity and specificity. We further selected individual peaks and performed MS/MS experimentation and found that the concentrations of kininogen-1 fragments were decreased while thymosin-β4 was increased in serum obtained from HCV-infected patients.
Materials and methods
Serum samples
The serum samples of HCV-infected patients (n = 179) used in this study were obtained from the central serum-/DNA-bank of the Hep-Net without any further selection [19]. Control samples (n = 195) were drawn from healthy individuals under strict routine protocols as outlined elsewhere [20]. All samples were collected using a standardized protocol for uniform diagnostic, thus reducing artificial results by biased sample pre-treatment. To protect protein integrity, repeated freeze/thaw cycles were avoided. The study as presented was approved by the Advisory board of the Hep-Net consortium and all patients gave informed consent. For details about the Hep-Net program’s objectives and basic research questions please refer to http://www.kompetenznetz-hepatitis.de.
Liver biopsies
For determination of stage and grade of hepatic fibrosis, liver biopsies were taken from all patients by percutaneous liver needle were obtained from the central Hep-Net tissue bank. These were stained by Gomori and hemalaun/eosin. All specimens were independently evaluated by two pathologists highly experienced in liver pathology at the German reference centre and the quality control centre of the viral hepatitis consortium (HepNet). Only biopsies with at least 10 portal tracts were included in our study. The severity of liver biopsy lesions and overall immunological activity were graded and staged according to routine scoring guidelines [21]. Corresponding patient’s serum samples were obtained from the central serum archive located at the Institute of Virology (Essen, Germany). Staging (inflammation) and grading (fibrosis) was performed according to the Desmet–Scheuer score by an experienced pathologist, who was blinded to any experimental data.
Results were validated in liver samples (liver biopsy or explanted diseased liver after organ transplantation) collected by the Internal Medicine III, University Hospital Aachen as independent validation set of patients with chronic liver diseases. This cohort included patients with HCV (n= 12), HBV (n= 8), primary sclerosing cholangitis (PSC; n= 11) or alcoholic disease (n= 11) comprising 42 samples in total as well as n= 5 control samples. All patients in this cohort were characterized by liver biopsy and blood tests.
Quantitative gene expression analysis
RNA was isolated from liver tissue stored at –80°C by pegGOLD (peqLab, Erlangen, Germany), and complementary DNA was generated from 1 μg RNA using complementary DNA synthesis kit (Roche, Mannheim, Germany). Quantitative real-time polymerase chain reaction (qRT-PCR) was performed with SYBR Green Reagent (Invitrogen, Karlsruhe, Germany). Primer sequences for kininogen-1 were 5′-GAA ACA ACT GTA AGT CCA CCC C-3′ and 5′-CAT GCC CTT GGT CAC GTT CAT-3′ and thymosin-β4 for 5′-CAG ACC AGA CTT CGC TCG A-3′ and 5′-GCT TCT CCT GTT CAA TCG T-3′. β-actin expression values were used to normalize gene expression that was expressed by arbitrary relative expression [22].
Immunohistochemistry
Fixed human liver pieces were embedded in paraffin. Sections were blocked against endogenous peroxidases using 3% H2O2. Kininogen (sc-25799) or thymosin-β4 (sc-67114) expression were detected with rabbit polyclonal antibodies (1:100) that were obtained from Santa Cruz Biotechnology (Santa Cruz, CA, USA) and a secondary biotinylated anti-rabbit IgG (Vector Laboratories, Burlingame, CA, USA), diluted 300-fold, followed by treatment with an avidin-conjugated peroxidase (Vectastain ABC-Elite Kit, Vector Laboratories) that was detected with a diaminobenzidine substrate (DAKO, Hamburg, Germany). The tissue sections were briefly counterstained with methyl green. Positive controls used were normal kidney (kininogen-1) or colon carcinomas (thymosin-β4).
Sample fractionation and MALDI-TOF-MS processing of serum samples profiling
Prior to the mass spectrometric analysis itself, serum samples were prefractionated using magnetic beads based weak cation exchange (MBWCX) ClinProt Beads (Bruker Daltonics, Bremen, Germany) according to the manufacturer’s recommendations. These magnetic beads are microparticles with functionalized surfaces providing weak cation exchange interactions that allow specific interactions with peptides and proteins. Chromatographically retained proteins were eluted using 5 μl elution solution. Prefractionated protein solution (1 μl) was applied onto a 600 μm spot of an AnchorChip™ MALDI target (Bruker Daltonics). Triplicates were used in turn to prevent sample preparation bias. After air drying, the addition of 1 μl of matrix (saturated α-cyano-4-hydroxycinnamic acid (CHCA) in 50% acetonitrile (ACN) with 0.5% trifluoroacetic acid [TFA]) finished the preparation. Special care was taken to standardize every detail of the protocol to avoid artificial results due to biased sample proceeding. All target preparations steps were performed in a precisely air-conditioned room to obviate differences in matrix crystallization. MALDI-TOF-MS was performed with the Reflex IV mass spectrometer (Bruker Daltonics). The Reflex IV was equipped with a scout™ MTP MALDI target. Spectra were acquired using the linear positive mode with a target voltage of 20 kV and a pulsed ion extraction of 17.25 kV. Matrix suppression up to 1000 Da was performed measuring a range between 1000 and 20,000 Da. Per spot, 400 satisfactory shots were collected. Calibration parameters from an external calibration were assumed using purchasable protein and peptide standards in the range of 1046.54 to 8565.89 m/z (Bruker Daltonics). All measurements were done in a blinded manner including patient and control sera in one mixed approach. The standard deviations (and variation coefficients) in triplicate experiments were calculated to be 2.5 (17.4) in healthy (n= 21) and 3 (21.6) in HCV-infected patients (n= 26).
MS/MS sequence analysis
MALDI MS/MS measurements of selected proteins were performed with an Ultraflex II MALDI-TOF/TOF mass spectrometer (Bruker Daltonics). Fragmentation was done directly from pooled WCX fractionated serum samples. Sample (0.5 μl) and matrix (0.5 μl of 10 mg/ml CHCA in 50% ACN with 0.5% TFA) were mixed and allowed to dry on an AnchorChip™ MALDI target (Bruker Daltonics) together. Each protein was selected separately and fragmented manually. Processing of MS/MS spectra was performed with the FlexAnalysis 3.0 software (Bruker Daltonics). Therefore, 25 cycles of a Savitzky–Golay smoothing algorithm and baseline subtraction were applied. Utilizing the SNAP (sophisticated numerical annotation procedure) peak picking algorithm, monoisotopic peaks with S/N (signal to noise) >7 were identified in each spectrum. Each processed MS/MS spectrum was loaded into a MASCOT (Matrix Science, Boston, MA, USA) search engine and run against the Swiss-Prot database.
Data mining and definition of serum protein profile algorithms
Spectra were analysed using the ClinProTools 2.2 software (Bruker Daltonics). This program uses a standard data preparation workflow including spectra pre-treatment, peak picking and peak calculation operation. Therefore, automatic baseline subtraction is performed at first. Normalization (based on the total ion count of each spectrum) of spectra and additionally calculation of an overall average spectrum of each spectra group is done subsequently. A random split training set containing 50 samples (approximately one third of all samples) of patients chronically infected with hepatitis and the same assemblage of control samples was used to determine specific algorithms for the later applied test set (the other two thirds of all samples). The proportion of different stages was similar distributed in both groups. Three different algorithms were used to generate information about data specificity and sensitivity, respectively. Sensitivity is defined as the probability that the test is positive when given to a group of patients with the disease whereas specificity is defined as the probability that the test will be negative among patients who do not have the disease. The supervised neural network (SNN) algorithm is a prototype-based classification algorithm and tries to identify some characteristic spectra for each class. The quick classifier (QC) generates a sum spectrum of both classes and arranges an unknown spectrum with respect to its differences to the sum spectra. The genetic algorithm (GA) randomly selects five peaks, which are tested for their classifying capability. Iterant one peak of the selection is replaced by another until a good classifying selection (‘classifying model’) is generated resulting in defined algorithms with high sensitivity (referring to the proportion of infected patients who were correctly classified as such) and specificity (referring to the proportion of healthy persons who were identified as such).
Statistical analysis
To discriminate differential expressed protein peaks in the ClinProTools 2.2 software the P-value of Wilcoxon test was performed for a maximum of two classes (for >2 classes the Kruskal–Wallis test was performed). Therefore, the data set do not depend on the normal distribution assumption and ranges from 0: good to 1: bad [23]. A P-value ≤0.05 is defined as significant. The null hypothesis tested is that a sample is symmetrically distributed around a specified centre. Scores exactly equal to the central point are excluded and the absolute values of the deviations from the central point of the remaining scores are ranked such that the smallest deviation has a rank of 1. ClinProTools calculates a receiver operating characteristic (ROC) curve for each peak within peak calculation. The ROC curve gives a graphical overview about specificity and sensitivity of a test or, within ClinProTools, an evaluation of the discrimination quality of a peak. The sensitivity represents the true positive fraction (TPF) and the specificity the true negative fraction (TNF). The fraction of false negatives (FNF) together with the TPF give a sum of 1 (100%) and the fraction of the false positives (FPF) together with the TNF also give a sum of 1 (100%). The best possible prediction method would yield a graph that was a point in the upper left corner of the ROC space, i.e. 100% sensitivity (all TP are found) and 100% specificity (no FP are found). A completely random predictor would give a 45 degree diagonal, the so-called no-discrimination line.
Results
General aspects and study population
A total of 179 patients (84 women and 95 men) were included in this study. Their mean age was 57 ± 14.2 years (range 10–90 years). Biopsies were scored for inflammation and fibrosis following international guidelines [21]. Representative specimens are shown in Figure 1. Fibrotic stage was 1 in 53 patients (portal fibrosis; grading: 26 patients G1, 27 patients G2), 2 in 78 patients (expanded portal fibrosis; grading: 18 patients G1, 57 patients G2 and 3 G3), 3 in 39 patients (bridging fibrosis; grading: 28 patients G2, 11 patients G3) and 4 in 9 patients (cirrhosis; grading: 4 patients G2, 5 patients G3). Based on this classification, the mean values for stage and grade of this cohort was calculated to 2.02 and 1.86, respectively. The control group contained 195 samples taken from healthy controls with similar distribution of gender (94 woman and 101 men) and age (mean age of 48 ± 14.8 years, range: 15–87 years).
Fig 1.
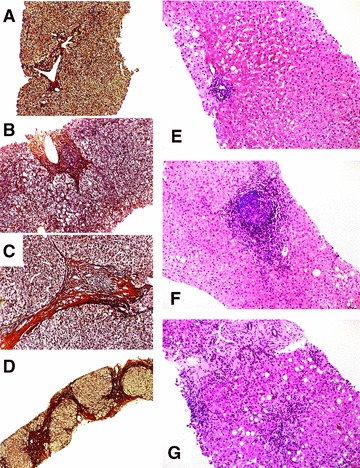
Representative liver histology from HCV-infected patients. Grading of the necroinflammatory activity and staging of the manifested fibrosis was done according to well-established scoring systems (see ‘Materials and methods’). Representative biopsies stained by Gomori (A–D) or by hemalaun and eosin (E–G) were graded (G) and staged (S) to: (A) G2/S1, (B) G2/S2, (C) G2/S3, (D) G2/S4, (E) G1/S1, (F) G2/S2, and (G) G3/S3, respectively. Magnification: (A)–(C) and (E)–(G): 100×; (D): 40×.
Serum protein profiling
In this study 179 serum samples from patients that were chronically infected by HCV and 195 samples taken from healthy control patients were assayed. In most cases, the serum was drawn around the time-point of liver biopsy. Each sample was profiled by MALDI-TOF-MS analysis after fractionation using WCX magnetic beads in three replicates. Usage of the outlined workflow resulted in the overall identification of 100 peaks (78 significant referring to P-value of Wilcoxon or Kruskal–Wallis test ≤ 0.05) in the molecular range of 2000 to 10,000 Da. The sum spectra of all HCV patient spectra (in red) compared to all control spectra (in green) are shown in Figure 2.
Fig 2.
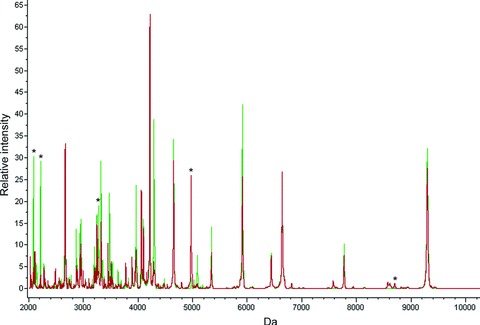
Representative MALDI-TOF mass spectra. In experiments using the WCX surfaces, 100 individual peaks were detected. A sum of all sera spectra from normal healthy controls (peaks in green) in comparison to patients with HCV infection (peaks in red) is shown using the ClinProTool Software 2.2. Protein peaks that are marked with an asterisk were used in the GA-based model to distinguish between sera from HCV infected patients and controls.
Identification of specific hepatitis-associated expression patterns
We next analysed if it is possible to create algorithms that are appropriate to discriminate between HCV-infected and control (non-infected) samples. Using different algorithms (see Table 1) implemented in the ClinProTools 2.2 software, a small sample set (the ‘training set’) of 50 HCV patient sera (16 patients stage 1, 18 patients stage 2, 12 patients stage 3 and 4 patients stage 4) in comparison to 50 control sera was generated first to train the classifier for the new created SNN (implicated peaks: 2079.82, 2477.97, 3272.87, 6799.95 and 8804.42 Da), QC applied peaks (2209.38, 2477.92, 3272.87, 4962.42 and 6799.95 Da) and GA (utilized peaks: 2079.82, 2209.38, 3272.87, 4962.42 and 8686.41 Da) algorithm. The training set showed very sensitive and specific separation results in all three classification algorithms suggesting that infected and non-infected patients could be classified by all three classification algorithms. Subsequently, the created models were proven in a larger sample set (the ‘test set’) that contained 129 patients and 145 control sera. An overall mean specificity of 93% with a sensitivity of 86% for the larger test set considering all three models could be confirmed by the generated models. Results for the three different models that were applied to the two data sets (i.e. the ‘training’ and the ‘test’ set) are shown in Table 1. To contemplate the results generated by applying the GA, selected peaks were used to assemble the GA-based model and peak associated ROC curves are presented in Figure 3. The shown data reveal the great benefit of multibiomarker analysis as conducted using the mentioned MALDI-TOF-MS approach. The same analysis was done with a weak anion exchange surface (WAX, Bruker Daltonics), but the higher variations coefficient on this surface gave rise to exclude this surface from the entire experiment (data not shown).
Table 1.
Algorithm for separation of HCV-infected cases and non-infected normal controls
| Sensitivity (%) | Specificity (%) | Algorithm | |
|---|---|---|---|
| Training set | 98.9 | 90.1 | GA |
| 97.8 | 92.6 | SNN | |
| 95.5 | 98.8 | QC | |
| Test set | 87.7 | 91.8 | GA |
| 86.1 | 91.0 | SNN | |
| 82.8 | 95.9 | QC | |
| Stage 1 | 87.9 | 91.8 | GA |
| Stage 2 | 91.5 | 91.8 | GA |
| Stage 3 | 94.1 | 91.8 | GA |
| Stage 4 | 100.0 | 91.8 | GA |
Different mathematical algorithms for the discovery of complex biomarker pattern models that allow separation of HCV-infected and non-infected control samples were generated using the ClinProTool 2.2 software. The algorithms were first created in a training set that included a lower number of spectra obtained from 50 HCV- and 50 non-infected individuals. Afterwards, the algorithms were validated in a larger test set (patients, n= 129; controls, n= 145). A separation of single fibrosis stages (stages 1–4) from the healthy control group was measured using the GA. GA: genetic algorithm; SNN: supervised neural network; QC: quick classifier. The obtained values for ‘sensitivity’ and ‘specificity’ were only marginally different to those depicted when comparing normal controls and samples taken from patients with different values for grade and stage.
Fig 3.
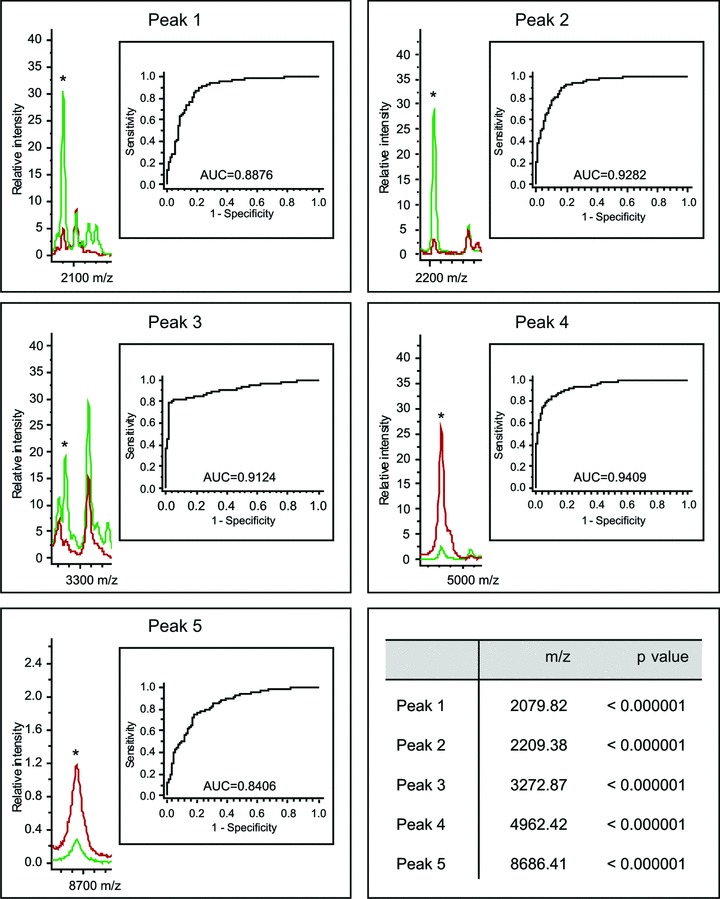
Definition of a genetic-based model to discriminate sera from infected patients and non-infected controls. A 5D GA was determined using the ClinProTools 2.2 software. In the GA, five individual protein peaks with the depicted m/z ratios are included. The chosen indicator proteins have estimated molecular masses ranging from 2000 to 10,000 Da. This selection (‘model’) was sufficient to distinguish between HCV-infected patients (peaks in red) and normal controls (peaks in green). ROC curves for each selected spot are shown.
Applicability of the defined algorithms to discriminate between mild and severe fibrosis
However, when we next tested if these models were suitable to discriminate between samples that were taken from patients with mild or severe fibrosis, we found that the overall values for specificity and sensitivity were highly variable when comparing different stages and grades (Table 2).
Table 2.
Applicability of the defined algorithms to discriminate between patients with mild and severe fibrosis
| Sensitivity (%) | Specificity (%) | Algorithm | ||
|---|---|---|---|---|
| Staging | F1–2 (n= 131) versus F3–4 (n= 48) | 30.1 | 80.5 | New GA1 |
| F1 (n= 53) versus F2 (n= 78) | 9.3 | 94.4 | New GA1 | |
| F1 (n= 53) versus F3 (n= 39) | 55.6 | 94.4 | New GA1 | |
| F1 (n= 53) versus F4 (n= 9) | 60.0 | 94.4 | New GA1 | |
| F2 (n= 78) versus F3 (n= 39) | 55.9 | 90.7 | New GA1 | |
| F2 (n= 78) versus F4 (n= 9) | 60.0 | 90.7 | New GA1 | |
| F3 (n= 39) versus F4 (n= 9) | 60.0 | 44.4 | New GA1 | |
| Grading | G1 (n= 44) versus G2 (n= 116) | 81.0 | 33.7 | New GA2 |
| G1 (n= 44) versus G3 (n= 19) | 76.2 | 70.0 | New GA2 | |
| G2 (n= 116) versus G3 (n= 19) | 76.2 | 3.6 | New GA2 |
Identification of selected peptides/proteins
Identification of three peptides/ proteins utilized in the GA-based model was successful via MS/MS. Analysis of the 2080 and 2209 Da peptides (peaks 1 and 2 in Fig. 3) that were decreased in serum drawn from HCV-infected patients were identified both with high probability as fragments of kininogen 1 (Fig. 4). Details are shown in Table 3 and in the Supporting Information. Additionally, we were able to identify the proteomic feature at 4962 Da (peak 4 in Fig. 3) that showed increased concentration in serum from HCV-infected probands. The respective protein (thymosin-β4) has been previously identified as a candidate biomarker and rigorously studied in the Mass Spectrometry Research Center [24, 25].
Fig 4.
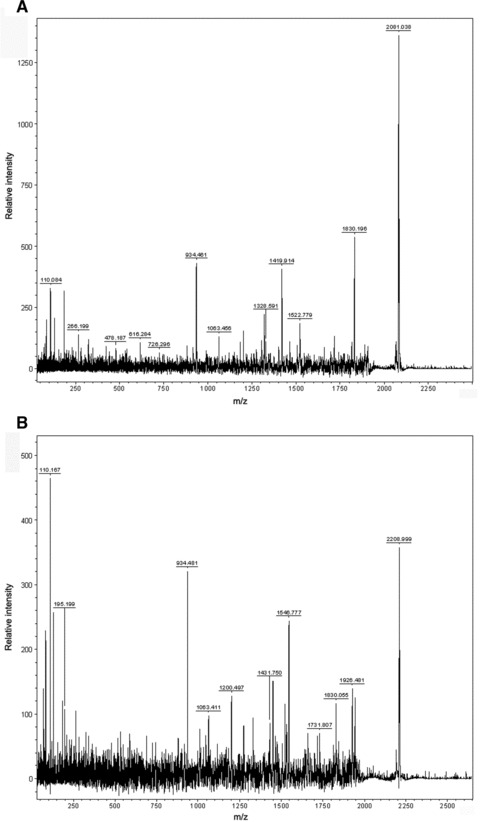
Representative MS/MS spectra of identified peptides. The identified peaks at 2080 Da (A) and 2209 Da (B) were processed and MS/MS spectra recorded. The resulting fragments indicated that both peaks correspond to kininogen-1. Details about the analysis are given in the Supporting Information.
Table 3.
Identification of peptides
| 2080 Da | 2209 Da | |
|---|---|---|
| Ions score | 72 | 103 |
| Expect | 0.00015 | 2e -07 |
| Start–end | 439–456 | 438–456 |
| Sequence | HNLGHGHKHERDQGHGHQ | KHNLGHGHKHERDQGHGHQ |
Quantitative real-time PCR data from human liver biopsies
We next addressed the question if the observed elevated expression of thymosin-β4 and decreased expression of kininogen-1 in patients suffering liver disease was found at mRNA expression in respective liver biopsies. Moreover, we addressed the question if hepatic expression of thymosin-β4 and kininogen-1 is influenced by the aetiology that is causative for liver disease. To do so, we isolated mRNA from livers of an independent cohort that contained 42 patients (11 alcoholics, 11 PSC, 12 HCV, 8 HBV) and five healthy controls and performed qRT-PCR for thymosin-β4 and kininogen-1 (Fig. 5). This analysis revealed that the suppression of kininogen-1 was significant in patients with fibrosis/cirrhosis (P= 0.0319) and with inflammation (P= 0.0099) also at the level of hepatic gene expression. Furthermore, there is a tendency that the suppression of hepatic kininogen-1 is independent from the aetiology of the disease. Although mRNA expression of thymosin-β4 was elevated in patients with hepatic diseases, the differences were not significant and not dependent from the degree of fibrosis and the underlying aetiology of the disease.
Fig 5.
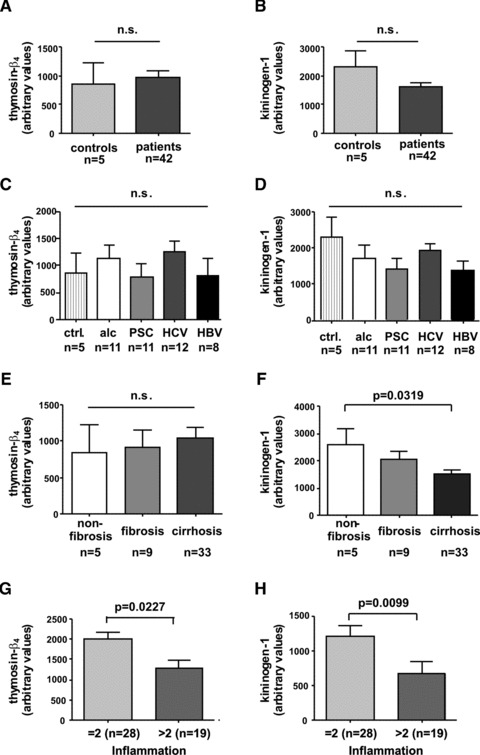
Thymosin-β4 and kininogen-1 expression in human liver biopsies. For quantitative analysis of thymosin-β4 (A, C, E, G) and kininogen-1 (B, D, F, H) expression in liver, RNA was isolated from biopsies isolated from 42 patients and 5 healthy controls and subjected to q-RT-PCR. The relative expression values of thymosin-β4 and kininogen-1 were correlated to (A, B) health status (healthy versus diseased), (C, D) aetiology, (E, F) degree of fibrosis and (G, H) inflammation (as given according to Desmet–Scheuer score).
Thymosin-β4 and kininogen-1 protein expression in liver
We next performed immunocytochemistry to determine the potential hepatic cellular subpopulation that produce thymosin-β4 and kininogen-1. Staining with a polyclonal antiserum directed against full-length thymosin-β4 demonstrated that in line with a previous publication [26] some non parenchymal liver cells, i.e. the Kupffer cells, were strongly positive for this peptide (Fig. 6). In this analysis, sections from a patient suffering from colon carcinoma were taken as a positive control. Although we were able to confirm previous results [27] demonstrating a strong expression of kininogen-1 at the mRNA level in total liver extracts (Fig. 5), we could not assign the respective protein to any specific hepatic subpopulation (not shown).
Fig 6.
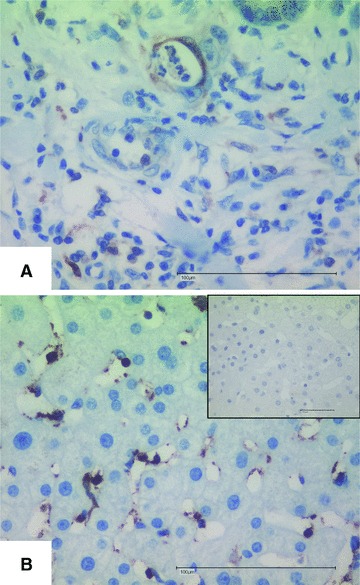
Hepatic expression of thymosin-β4. Sections from colon carcinoma (A) or HCV-infected patients (B) were stained for thymosin-β4 following the protocol outlined in the ‘Materials and methods’ section. The inlet in (B) depicts a stain with the second antibody only as a negative control. Space bars represent 100 μM.
Discussion
In this study, we comparatively analysed serum samples from normal controls and HCV-infected patients by MALDI-TOF-MS. The clustering of the recorded protein signatures resulted in the definition of algorithms that allow the identification of HCV-samples with high sensitivity and specificity. By use of MS/MS experimentation we were further able to separate and identify two proteins (i.e. kininogen-1, thymosin-β4) that are part of these algorithms. Subsequent validation further revealed that the expression of respective genes in liver extracts significantly correlated with the degree of inflammation. In addition, we were able to demonstrate elevated hepatic expression of thymosin-β4 in Kupffer cells in patients suffering from liver disease. Although we were further able to demonstrate expression of kininogen-1 in quantitative RT-PCR, we failed to assign the production of this protein to any specific cellular subpopulation of the liver.
Presently, the severity of hepatic injury during chronic viral hepatitis infection is classified in liver biopsy which is still considered as a ‘Gold Standard’ tool. Additionally, recent advances in the field of hepatic imaging and identification of novel biomarkers that can be measured by routine laboratory testing will be helpful to quantitate the architectural changes during chronic hepatic injury. However, all these techniques have three specific limitations: (i) invasive biopsy sampling is burdening, representativeness of needle biopsy is doubtful and intra- and interoperator reproducibility of pathological classifications is potentially prone to error [5, 6], (ii) although non-invasive transient elastography is suitable to detect progressive deposit of hepatic fibrosis it failed to monitor less advanced stages of fibrosis reproducibly, is incapable to evaluate fibrosis in patients with morbid obesity and is further insufficient to score histological activity and (iii) current serological marker tests have not circumstantiated the usefulness in tracking changes in fibrosis progression, additionally available tests distinguish only two stages of the fibrosis spectrum with appropriate accuracy [7].
However, in principle, serum testing per se should reflect the status of the entire liver functionality and should therefore be more accurate than needle biopsy, whereas different markers follow different pathophysiological concepts and have diverse clinical implications [28, 29]. Thus several markers inform about the grade of fibrogenic activity, others indicate the stage of fibrosis. Therefore, the necessity to perform a cluster analysis in which the attributes of the different markers are considered is conceivable. As a result different biochemical scores and multi-parameter combinations (biomarker panels) which were selected by various statistical models and mathematical algorithms have been introduced [28, 29]. This development has culminated in screening and profiling of complex biomarker patterns in clinical proteomics to detect a molecular fingerprint that is specific for one disease. In hepatology, proteomic profiling were already successful in the assessment of cholangiocarcinoma [30], HCC [9, 31, 32], and non-alcoholic fatty liver disease [11]. In an exploratory study using serum samples from HCV-infected patients in a SELDI-TOF-MS approach, the authors used an elaborating pre-fractionation process following additional cationic pre-fractionation [13]. In comparison to our results the authors focused on differences in disease progression without comparison to healthy controls whereas our focus was defined as discovery of a potential clinical tool to detect fibrosis of all stages with high sensitivity and specificity. A recent publication based on 2D gel electrophoresis showed novel but high abundant proteins that were associated with fibrosis progression in HCV patients [15]. Unfortunately, the technique is not applicable for clinical usage due to difficult procedures and long lasting experiments. However, it suggests that serum profiling is suitable to identify patients chronically infected by hepatitis.
Therefore, we recorded serum protein profiles of HCV patients with known stage and grade of hepatic damage and compared them to those obtained from healthy volunteers. Using different bioinformatics tools, we were able to define three defined bioinformatic algorithms that were appropriate to distinguish class-specific protein expression profiles in the different collectives (non-infected versus infected). Each algorithm included four to five low molecular weight protein peaks in the range from 2000 to 10,000 Da. Using these models, an overall specificity 93% with a sensitivity of 86% to discriminate between HCV-infected patients and healthy controls was found for the WCX surface. However, these models showed lower values when patients with mild and severe fibrosis were compared (Table 2). Taken together, the established models are suitable for discrimination of patients with HCV infection and healthy controls (Table 1) but were not able to discriminate patients with mild fibrosis from those with severe fibrosis with such high sensitivity (Table 2).
It is well accepted that protein expression profiling approaches using MS is a powerful tool to prove combinations of different marker molecules in one approach. Nevertheless being aware of the severe critics relating to serum profiling analysis [33], special care was taken to process samples in an unbiased way. A chip-based MALDI approach named SELDI in comparison to the described MALDI-TOF-MS with antedated bead fractionation showed inhomogeneous results so that further analysis were focused on the non chip approach (data not shown). Additionally, different models with high classifying capability were generated to get multidimensional information. Being in possession of a quite large sample collective, we were able to validate a classifying model with a so called test set. The defined model was developed using a smaller training set, whereas the test set was classified afterwards. After generation of a model using the training set (n= 50/group), the test set (HCV patients n= 129; controls n= 145) provided information about sensitivity 86% with a specificity of 93% of the generated models.
Furthermore, we were successful to identify peaks that were included in the model. The peaks at m/z 2079.82 and 2209.38 (peaks 1 and 2 in Fig. 3) that were suppressed in HCV-infected patients both derived from kininogen-1 encoded by the KNG1 gene that belongs to the plasma kallikrein–kinin system which further comprise factor XII, prekallikrein, and factor XI. In this system kininogen serves as a cofactor of Bradykinin release that is a potent inflammatory mediator. The KNG1 gene generates both high-molecular-weight-kininogen (HMWK) and low molecular weight kininogen (LMWK) that are prototypes of modular plasma proteins that results through alternative splicing. Interestingly, a former study reported that patients with cirrhosis had significantly lower plasma levels of both HMWK and LMWK [34]. Because kininogens are synthesized by hepatocytes, the reduction in HCV-infected patients may reflect a generalized protein synthesis defect in injured hepatic tissue. Notably, the former study showed that the degree of reduction in plasma kininogen was directly related to the severity of impaired liver function and not merely the result of the decrease in total plasma proteins.
Moreover, we found a peak at m/z 4962.42 (peak 4 in Fig. 3) that was elevated in patients suffering from HCV infection corresponds to thymosin-β4 that is a highly conserved peptide of 43 amino acids that belongs to the thymosin family of proteins with critical role in modulating the dynamics of actin polymerization and depolymerization. Typically, high concentrations of this peptide are found in peritoneal macrophages, suggesting that its occurrence in other tissues may be related to the presence of macrophages or macrophage-like cells in these tissues [35]. Moreover, it is known that thymosin-β4 is a potent wound healing factor with multiple biological activities [36]. In regard to liver, it has been recently demonstrated that this pleiotropic polypeptide increases the expression of hepatocyte growth factor and suppresses the expression of platelet-derived growth factor-β receptor mRNA in hepatic stellate cells suggesting that it might have antifibrogenic potential [37]. Overall, it is therefore tempting to speculate that the increased concentration of thymosin-β4 in patients infected by HCV might be a physiological defence mechanisms to sequester detrimental high concentration of actin or fragments derived thereof or even more to interfere with the process of scarring. This small ubiquitous protein contains a 4 amino acid stretch at its amino-terminal site that generally blocks inflammation and reduces fibrosis [38]. Therefore, the elevated serum concentration might be a defence mechanism counteracting ongoing inflammation and fibrogenesis. In contrast to the elevated serum thymosin-β4 concentrations that we observed in serum drawn from diseased patients, the hepatic expression of thymosin-β4 was only marginal (not significant) elevated (Fig. 5A) and, moreover, significant (P= 0.0227) lowered in patients with strong intrahepatic inflammation (staged >2 in liver biopsy) (Fig. 5G). Immunocytochemical staining further revealed that non parenchymal liver cells, most likely Kupffer cells, are the major source of thymosin-β4 in liver (Fig. 6). This result is in agreement with two recent reports demonstrating that expression of thymosin-β4 is found in activated Kupffer cells [26, 39]. However, it is known that thymosin-β4 is expressed in many organs and tissues [26] and represents a general sentinel of the cell oxidative stress. Therefore, it is most likely that the elevated serum concentrations of thymosin-β4 expression may not solely be the result of elevated hepatic expression of this versatile actin binding protein but may be also be linked to the stress response in other organs that might be induced during hepatic injury. In line with this hypothesis is the finding that the expression of thymosin-β4 at mRNA level is highest in patients with low grades of inflammation (Fig. 5G).
In regard to kininogen-1 we confirmed previous findings [27] that respective mRNA is detectable by qRT-PCR techniques (Fig. 5) but we were unable to specify hepatic cell subpopulations that express this component of the kallikrein–kinin system by immunohistochemistry. Based on our data and on other immunohistochemical-based findings that are deposited for KNG-1 in the human protein atlas repository databank (http://www.proteinatlas.org/), we would therefore suggest that this protein is only present at low concentrations in the liver.
However, there is no doubt that the current proteomics technologies are still under development and show certain technical limitations that might provoke potential drawbacks and pitfalls. In particular, the algorithms defined in our study are not appropriate to discriminate different grades and stages. Therefore, it is obvious that this study will not have any direct impact on diagnosis and is not an alternative for the measurement of virus-specific antigens or RNAs. However, the study adds kininogen-1 and thymosin-β4 to the increasing list of peptides and proteins that might be relevant for the initiation and progression of inflammatory hepatic lesions [15, 17, 18].
In summary, we have demonstrated that the serum concentration of fragments of kininogen-1 and thymosin-β4 is different in patients with chronic hepatitis C infection and conclude that serum profiling after magnetic bead prefractionation by MALDI-TOF-MS is a robust, valid and promising screening tool to detect development of inflammatory lesions in the liver. Surely, the equipment for proteome analysis is expensive, the performance requires extensive training of personal and cheaper biochemical tests or methods like transient elastography and real-time tissue elastography technologies for the assessment of liver damage are available and it remains to be seen how (and if) proteomic profiling will improve the diagnosis of hepatic injury [40].
It will be the aim of future studies to investigate if kininogen-1 or thymosin-β4 that were identified in this study, are indeed suitable biomarkers to reflect the fibrogenic response of liver and in particular during HCV infection.
Acknowledgments
This work was supported by the Hep-Net. K.S. and C.H. are supported by a START grant from the University Hospital Aachen. The authors thank Nadine Reulen for excellent technical assistance and Prof. Dr. M. Roggendorf (University Hospital Essen, Department of Virology, Germany) and his colleagues for sending of serum samples.
Conflict of interest
The authors confirm that there are no conflicts of interest.
Supporting Information
Additional Supporting Information may be found in the online version of this article:
Mascot Search Results
References
- 1.Poynard T, Yuen MF, Ratziu V, et al. Viral hepatitis C. Lancet. 2003;362:2095–100. doi: 10.1016/s0140-6736(03)15109-4. [DOI] [PubMed] [Google Scholar]
- 2.Lai CL, Ratziu V, Yuen MF, et al. Viral hepatitis B. Lancet. 2003;362:2089–94. doi: 10.1016/S0140-6736(03)15108-2. [DOI] [PubMed] [Google Scholar]
- 3.Kwon JA, Lee H, Lee KN, et al. High diagnostic accuracy of antigen microarray for sensitive detection of hepatitis C virus infection. Clin Chem. 2008;54:424–8. doi: 10.1373/clinchem.2007.090464. [DOI] [PubMed] [Google Scholar]
- 4.Hagiwara M, Rusinek H, Lee VS, et al. Advanced liver fibrosis: diagnosis with 3D whole-liver perfusion MR imaging–initial experience. Radiology. 2008;246:926–34. doi: 10.1148/radiol.2463070077. [DOI] [PubMed] [Google Scholar]
- 5.Ratziu V, Charlotte F, Heurtier A, et al. Sampling variability of liver biopsy in nonalcoholic fatty liver disease. Gastroenterology. 2005;128:1898–906. doi: 10.1053/j.gastro.2005.03.084. [DOI] [PubMed] [Google Scholar]
- 6.Regev A, Berho M, Jeffers LJ, et al. Sampling error and intraobserver variation in liver biopsy in patients with chronic HCV infection. Am J Gastroenterol. 2002;97:2614–8. doi: 10.1111/j.1572-0241.2002.06038.x. [DOI] [PubMed] [Google Scholar]
- 7.Rockey DC, Bissell DM. Noninvasive measures of liver fibrosis. Hepatology. 2006;43:S113–20. doi: 10.1002/hep.21046. [DOI] [PubMed] [Google Scholar]
- 8.Sandrin L, Fourquet B, Hasquenoph JM, et al. Transient elastography: a new noninvasive method for assessment of hepatic fibrosis. Ultrasound Med Biol. 2003;29:1705–13. doi: 10.1016/j.ultrasmedbio.2003.07.001. [DOI] [PubMed] [Google Scholar]
- 9.Paradis V, Degos F, Dargere D, et al. Identification of a new marker of hepatocellular carcinoma by serum protein profiling of patients with chronic liver diseases. Hepatology. 2005;41:40–7. doi: 10.1002/hep.20505. [DOI] [PubMed] [Google Scholar]
- 10.Schwegler EE, Cazares L, Steel LF, et al. SELDI-TOF MS profiling of serum for detection of the progression of chronic hepatitis C to hepatocellular carcinoma. Hepatology. 2005;41:634–42. doi: 10.1002/hep.20577. [DOI] [PubMed] [Google Scholar]
- 11.Younossi ZM, Baranova A, Ziegler K, et al. A genomic and proteomic study of the spectrum of nonalcoholic fatty liver disease. Hepatology. 2005;42:665–74. doi: 10.1002/hep.20838. [DOI] [PubMed] [Google Scholar]
- 12.Diamond DL, Jacobs JM, Paeper B, et al. Proteomic profiling of human liver biopsies: hepatitis C virus-induced fibrosis and mitochondrial dysfunction. Hepatology. 2007;46:649–57. doi: 10.1002/hep.21751. [DOI] [PubMed] [Google Scholar]
- 13.Gangadharan B, Antrobus R, Dwek RA, et al. Novel serum biomarker candidates for liver fibrosis in hepatitis C patients. Clin Chem. 2007;53:1792–9. doi: 10.1373/clinchem.2007.089144. [DOI] [PubMed] [Google Scholar]
- 14.Gobel T, Vorderwulbecke S, Hauck K, et al. New multi protein patterns differentiate liver fibrosis stages and hepatocellular carcinoma in chronic hepatitis C serum samples. World J Gastroenterol. 2006;12:7604–12. doi: 10.3748/wjg.v12.i47.7604. [DOI] [PMC free article] [PubMed] [Google Scholar]
- 15.White IR, Patel K, Symonds WT, et al. Serum proteomic analysis focused on fibrosis in patients with hepatitis C virus infection. J Transl Med. 2007;5:33. doi: 10.1186/1479-5876-5-33. [DOI] [PMC free article] [PubMed] [Google Scholar]
- 16.Tirumalai RS, Chan KC, Prieto DA, et al. Characterization of the low molecular weight human serum proteome. Mol Cell Proteomics. 2003;2:1096–103. doi: 10.1074/mcp.M300031-MCP200. [DOI] [PubMed] [Google Scholar]
- 17.Kanmura S, Uto H, Sato Y, et al. The complement component C3a fragment is a potential biomarker for hepatitis C virus-related hepatocellular carcinoma. J Gastroenterol. 2010;45:459–67. doi: 10.1007/s00535-009-0160-5. [DOI] [PubMed] [Google Scholar]
- 18.Tsutsumi T, Matsuda M, Aizaki H, et al. Proteomics analysis of mitochondrial proteins reveals overexpression of a mitochondrial protein chaperon, prohibitin, in cells expressing hepatitis C virus core protein. Hepatology. 2009;50:378–86. doi: 10.1002/hep.22998. [DOI] [PubMed] [Google Scholar]
- 19.Manns MP, Meyer S, Wedemeyer H. The German network of excellence for viral hepatitis (Hep-Net) Hepatology. 2003;38:543–4. doi: 10.1002/hep.510380302. [DOI] [PubMed] [Google Scholar]
- 20.Schwamborn K, Krieg R, Grosse J, et al. Serum proteomic profiling in patients with bladder cancer. Eur Urol. 2010;56:989–97. doi: 10.1016/j.eururo.2009.02.031. [DOI] [PubMed] [Google Scholar]
- 21.Desmet VJ. Knodell RG, Ishak KG, et al. Formulation and application of a numerical scoring system for assessing histological activity in asymptomatic chronic active hepatitis [Hepatology 1981; 1: 431–5] J Hepatol. 2003;38:382–6. doi: 10.1016/s0168-8278(03)00005-9. [DOI] [PubMed] [Google Scholar]
- 22.Karlmark KR, Weiskirchen R, Zimmermann HW, et al. Hepatic recruitment of the inflammatory Gr1+ monocyte subset upon liver injury promotes hepatic fibrosis. Hepatology. 2009;50:261–74. doi: 10.1002/hep.22950. [DOI] [PubMed] [Google Scholar]
- 23.Wilcoxon F. Individual comparisons by ranking methods. Biometrics Bulletin. 1945;1:80–3. [Google Scholar]
- 24.Reyzer ML, Caldwell RL, Dugger TC, et al. Early changes in protein expression detected by mass spectrometry predict tumor response to molecular therapeutics. Cancer Res. 2004;64:9093–100. doi: 10.1158/0008-5472.CAN-04-2231. [DOI] [PubMed] [Google Scholar]
- 25.Xu BJ, Shyr Y, Liang X, et al. Proteomic patterns and prediction of glomerulosclerosis and its mechanisms. J Am Soc Nephrol. 2005;16:2967–75. doi: 10.1681/ASN.2005030262. [DOI] [PubMed] [Google Scholar]
- 26.Paulussen M, Landuyt B, Schoofs L, et al. Thymosin beta 4 mRNA and peptide expression in phagocytic cells of different mouse tissues. Peptides. 2009;30:1822–32. doi: 10.1016/j.peptides.2009.07.010. [DOI] [PubMed] [Google Scholar]
- 27.Merkulov S, Zhang WM, Komar AA, et al. Deletion of murine kininogen gene 1 (mKng1) causes loss of plasma kininogen and delays thrombosis. Blood. 2008;111:1274–81. doi: 10.1182/blood-2007-06-092338. [DOI] [PMC free article] [PubMed] [Google Scholar]
- 28.Gressner OA, Weiskirchen R, Gressner AM. Biomarkers of hepatic fibrosis, fibrogenesis and genetic pre-disposition pending between fiction and reality. J Cell Mol Med. 2007;11:1031–51. doi: 10.1111/j.1582-4934.2007.00092.x. [DOI] [PMC free article] [PubMed] [Google Scholar]
- 29.Poynard T, McHutchison J, Manns M, et al. Biochemical surrogate markers of liver fibrosis and activity in a randomized trial of peginterferon alfa-2b and ribavirin. Hepatology. 2003;38:481–92. doi: 10.1053/jhep.2003.50319. [DOI] [PubMed] [Google Scholar]
- 30.Scarlett CJ, Saxby AJ, Nielsen A, et al. Proteomic profiling of cholangiocarcinoma: diagnostic potential of SELDI-TOF MS in malignant bile duct stricture. Hepatology. 2006;44:658–66. doi: 10.1002/hep.21294. [DOI] [PubMed] [Google Scholar]
- 31.Kanmura S, Uto H, Kusumoto K, et al. Early diagnostic potential for hepatocellular carcinoma using the SELDI ProteinChip system. Hepatology. 2007;45:948–56. doi: 10.1002/hep.21598. [DOI] [PubMed] [Google Scholar]
- 32.Zinkin NT, Grall F, Bhaskar K, et al. Serum proteomics and biomarkers in hepatocellular carcinoma and chronic liver disease. Clin Cancer Res. 2008;14:470–7. doi: 10.1158/1078-0432.CCR-07-0586. [DOI] [PubMed] [Google Scholar]
- 33.Baggerly KA, Morris JS, Edmonson SR, et al. Signal in noise: evaluating reported reproducibility of serum proteomic tests for ovarian cancer. J Natl Cancer Inst. 2005;97:307–9. doi: 10.1093/jnci/dji008. [DOI] [PubMed] [Google Scholar]
- 34.Cugno M, Scott CF, Salerno F, et al. Parallel reduction of plasma levels of high and low molecular weight kininogen in patients with cirrhosis. Thromb Haemost. 1999;82:1428–32. [PubMed] [Google Scholar]
- 35.Hannappel E, Xu GJ, Morgan J, et al. Thymosin β4: a ubiquitous peptide in rat and mouse tissues. Proc Natl Acad Sci USA. 1982;79:2172–5. doi: 10.1073/pnas.79.7.2172. [DOI] [PMC free article] [PubMed] [Google Scholar]
- 36.Malinda KM, Sidhu GS, Mani H, et al. Thymosin β4 accelerates wound healing. J Invest Dermatol. 1999;113:364–8. doi: 10.1046/j.1523-1747.1999.00708.x. [DOI] [PubMed] [Google Scholar]
- 37.Barnaeva E, Nadezhda A, Hannappel E, et al. Thymosin β4 upregulates the expression of hepatocyte growth factor and downregulates the expression of PDGF-β receptor in human hepatic stellate cells. Ann NY Acad Sci. 2007;1112:154–60. doi: 10.1196/annals.1415.035. [DOI] [PubMed] [Google Scholar]
- 38.Sosne G, Qiu P, Goldstein AL, et al. Biological activities of thymosin β4 defined by active sites in short peptide sequences. FASEB J. 2010;24:2144–51. doi: 10.1096/fj.09-142307. [DOI] [PubMed] [Google Scholar]
- 39.Nemolato S, Cabras T, Cau F, et al. Different thymosin beta 4 immunoreactivity in foetal and adult gastrointestinal tract. PLoS ONE. 2010:e9111. doi: 10.1371/journal.pone.0009111. [DOI] [PMC free article] [PubMed] [Google Scholar]
- 40.Morra R, Munteanu M, Bedossa P, et al. Diagnostic value of serum protein profiling by SELDI-TOF ProteinChip compared with a biochemical marker, FibroTest, for the diagnosis of advanced fibrosis in patients with chronic hepatitis C. Aliment Pharmacol Ther. 2007;26:847–58. doi: 10.1111/j.1365-2036.2007.03427.x. [DOI] [PubMed] [Google Scholar]
Associated Data
This section collects any data citations, data availability statements, or supplementary materials included in this article.
Supplementary Materials
Mascot Search Results