

Abstract
The expression and significance of cathepsin L (CTSL) has been extensively studied in solid tumours. However no such information in chronic myeloid leukaemia (CML) was available. We investigated the activity and expression of this protease in peripheral blood mononuclear cells (PBMCs) of 47 adult CML patients. Thirty adults suffering from systemic diseases and 50 healthy volunteers served as controls. The mRNA levels of CTSL, its specific endogenous inhibitor cystatin C and transcriptional up-regulator vascular endothelial growth factor (VEGF) were quantitated by real-time qPCR. CTSL protease activity and its mRNA expression were significantly higher in CML chronic phase (CP) patients compared to CML accelerated phase/blast crisis (AP/BC) patients and controls (P≤ 0.001). VEGF whose expression was most pronounced in CP and declined (P≤ 0.001) in the advanced phases of the malignancy exhibited a strong positive correlation with CTSL expression (r= 0.97; P≤ 0.001). Cystatin C expression was significantly lower (P≤ 0.001) in CML and displayed inverse correlation with CTSL (r=−0.713; P≤ 0.001) activity. CTSL promoter was significantly hypomethylated in CML CP compared to CML AP/BC patients as well as controls. K562, a BC CML cell line displayed CTSL activity, expression and methylation status of CTSL promoter that was comparable to CML AP/BC patients. Treatment of these cells or PBMCs isolated from CML AP/BC patients with 5′-aza-cytidine resulted in a dramatic increase in CSTL activity and/or expression thereby demonstrating the role of promoter methylation in the stage specific expression of CTSL in CML. Differential expression of CTSL in CML at various stages of malignancy may prove useful in identification of the high-risk patients thereby facilitating better management of disease.
Keywords: cathepsin L (CTSL), chronic myeloid leukaemia (CML), vascular endothelial growth factor (VEGF), promoter methylation, K562 cells
Introduction
Chronic myeloid leukaemia (CML) is a clonal disorder in which cells of the myeloid lineage undergo unregulated proliferation. The leukemic cells progressively lose their ability to differentiate as they pass through chronic phase (CP), accelerated phase (AP) and finally blast crisis (BC) [1, 2]. This disease is characterized by Philadelphia chromosome created due to a reciprocal translocation between the long arms of chromosomes 9 and 22 (t (9; 22) (q34; q11). The consequence of this signature translocation is the generation of the fusion protein Bcr-Abl, a constitutively activated tyrosine kinase. Several studies have clearly demonstrated that Bcr-Abl is sufficient for causing CML [3–6].
Possible pathogenic roles of proteases in the progression of leukaemia have long been speculated. Excessive egression of leukemic cells from bone marrow into peripheral blood followed by infiltration of organs is often seen in leukaemia. These movements are supposedly facilitated by proteases due to their capability of catalytic modification of extracellular matrix components. While studying the pathogenesis of CML, it was found that matrix metalloproteases mainly MMP-9 and MMP-2 along with vascular endothelial growth factor (VEGF) stimulate angiogenesis in CML [7]. Sun et al. [8] have reported membrane type 1-MMP (MT1-MMP) as a novel downstream target of Bcr-Abl/Abl signalling.
Cathepsin L (CTSL), a lysosomal cysteine protease, primarily responsible for the normal degradation and turnover of intracellular proteins, is overexpressed by malignant tumours [9–12]. The expression of this protease is also elevated by pro-inflammatory cytokines, oncogenes and tumour promoters [13–17]. In addition our laboratory has previously demonstrated transcriptional up-regulation of CTSL by VEGF in glioblastoma cells [18]. A majority of CTSL synthesized by tumour cell is secreted out for which its intact carboxy terminus is essential [19]. The secreted protease confers invasive ability to the tumour cells. High levels of CTSL have been associated with poor prognosis of meningiomas [20], non-small cell lung cancer [21], breast cancer [22] and pancreatic adenocarcinoma [23]. Human CTSL is encoded by multiple mRNA species generated by the alternate splicing of the same primary mRNA transcribed from the single gene located on chromosome 9q 21–22 [24, 25]. Altered expression of genes located on the long arm of chromosome 9 has been demonstrated in CML [26]. Similarly, the overexpression of VEGF, a transcriptional regulator of CTSL [18] is also documented in this type of leukaemia. However, there was no information about the expression of CTSL in this malignancy. Hence, the present study was designed and carried out in two steps that aimed first, at assessing the activity and expression of CTSL in CML patients and secondly investigating the factors that might be regulating its expression in this malignancy.
Results of the present study for the first time demonstrate that leukaemia patients in CP display significantly higher enzymatic activity and mRNA levels of CTSL compared to healthy controls and patients suffering from systemic infections. We present experimental evidence to demonstrate that this elevation in the expression of CTSL is due to the hypomethylated state of its promoter. However, in the AP/BC the expression of this protease again decreases owing to its promoter hypermethylation. The differential expression of this protease in CP and BC may prove useful in the management of CML.
Materials and methods
Patients
Newly diagnosed previously untreated CML patients ≥18 years of age, registered from October 2006 to January 2009 at our cancer centre were recruited in the present study. Likewise, 30 adult patients suffering from systemic diseases other than cancer and registered during the same time period at our hospital were recruited for the study as patient controls (PCs). Fifty adult normal and healthy volunteers participated in the study to serve as a set of normal controls (NCs). The study was approved by the institute ethics committee and informed consent was taken from the patients prior to sampling. Peripheral blood mononuclear cells (PBMCs) were isolated from whole peripheral blood samples using red cell lysis buffer. Cells were counted and pellets containing equal number of cells were made and stored at −80°C till further use.
Cell culture
K562, a human leukaemia cell line originally established by Lozzio and Lozzio [27], from a chronic myelogenous leukaemia patient in terminal BC was obtained from National Centre for Cell Science, Pune, India. It was maintained in IMDM (Iscove’s modified Dulbecco’s medium; Sigma-Aldrich, St. Louis, MO, USA) enriched with 25 mM Hepes, 4 mM L- Glutamine and supplemented with 10% foetal bovine serum (Gibco Life Technologies, Karlsruhe, Germany) and Ciprofloxacin (20 μg/ml) in a humidified atmosphere containing 5% CO2 at 37°C.
Treatment with recombinant VEGF
PBMCs isolated from CML patients and controls were induced with 40 ng/ml of recombinant VEGF 165 (Peprotech Inc., Rocky Hill, NJ, USA) for 48 hrs in serum free Roswell Park Memorial Institution (RPMI) 1640 medium containing 0.1% bovine serum albumin as described earlier [18]. Cell lysate prepared from treated or untreated cells was further used for CTSL assay.
Cathepsin L assay
Equal number (3 × 10⁷) of PBMCs were lysed in Tris HCl buffer (50 mM Tris HCl, pH 6.8; 150 mM NaCl; 10% glycerol; 1% Nonidet P-40) followed by two freeze thaw cycles. The cell lysate was centrifuged at 10,000 ×g at 4°C for15 min. to remove the cell debris. Thereafter, total protein in the supernatant was estimated [28]. Then CTSL activity in the cell lysate containing 50 μg of total protein was assayed, in the presence of 5 μM CA074 (Sigma-Aldrich), a specific cathepsin B inhibitor as described earlier [29]. The enzymatic activities were expressed as arbitrary units/min./mg protein (AU).
RNA isolation and real-time qPCR
Total cellular RNA from PBMCs was isolated using TRI Reagent BD™ (Sigma-Aldrich) according to manufacturer’s protocol. Then 3.0 μg of total RNA was reverse transcribed using RevertAid™ M-MuLV Reverse Transcriptase (MBI Fermentas, Vilnius, Lithuania) and random hexamers according to the manufacturer’s protocol. An aliquot containing 200 ng of the total cDNA was subjected to PCR using primers specific for CTSL, VEGF, Bcr-Abl or cystatin C (Table 2) on a Bio-Rad I-cycler (Bio-Rad, Hercules, CA, USA). PCR reactions were carried out in a final volume of 25 μl containing 1.5 mM Magnesium chloride, 20 μM of each of the primers, 0.2 mM dNTP mix, 1UTaq Polymerase (Invitrogen Corporation, Carlsbad, CA, USA), 1×PCR Buffer and 1× SYBER green (Invitrogen Corporation). PCR conditions comprised 40 cycles of denaturation 94°C for 30 sec., annealing at 59°C for 45 sec., extension at 72°C for 1 min and fluorescence recording at 80°C for 30 sec. Similarly 18S and Bcr-Abl cDNAs were amplified using specific primers which served as internal controls. Melting curve analysis confirmed no primer–dimer formation for human CTSL, Bcr-Abl, VEGF, cystatin C, 18S or Abl cDNAs under the above-mentioned conditions. The expected sizes of the PCR products were confirmed by agarose gel electrophoresis. Cycle threshold (Ct) values were calculated for each PCR and relative fold abundance was calculated using 2−ΔΔCt method [30].
Table 2.
List of primers used in this study
| Target gene | Primers | Size of the amplified fragment |
|---|---|---|
| CTSL | 5′-GACTCTGAGGAATCCTATCCA-3′ (forward) 5′-AAGGACTCATGACCTGCATCAA-3′ (reverse) | 179 bp |
| VEGF | 5′-ATGAACTTTCTGCTGTCTTGGG-3′ (forward) 5′-GGGTCTCGATTGGATGGCAG-3′ (reverse) | 172 bp |
| Cystatin C | 5′-CAGCAACGACATGTACCACAG-3′ (forward) 5′-TTCCTTTTCAGATGTGGCTGGT-3′ (reverse) | 180 bp |
| 18S | 5′-GTAACCCGTTGAACCCCATT-3′ (forward) 5′-CCATCCAATCGGTAGTAGCG-3′ (reverse) | 151 bp |
Genomic DNA isolation and bisulphite genomic sequencing
Methylation analysis of the genomic DNA isolated from PBMCs of leukaemia patients and controls was performed with EZ DNA Methylation-Gold™ Kit (Zymo Research, Orange, CA, USA) according to the manufacturer’s instructions. Briefly, 1.0 μg of EcoRI digested DNA was denatured; mixed with CT conversion reagent (Zymo Research) and heated at 98°C for 10 min. Then it was incubated at 64°C for 2.5 hrs to facilitate the conversion of unmethylated cytosine to uracil. Modified DNA was afterwards desulphonated with the help of NaOH and column purified. Two nested PCRs were realized to analyse the methylation status of CTSL promoter using primers based on the predicted sequence after bisulphite conversion. Primary and nested PCR reactions were carried out for 35 cycles (94°C, 30 sec.; 55°C, 60 sec.; 72°C, 60 sec.). PCR products were purified and cloned in pGEMT-Easy vector (Promega Corporation, Madison, WI, USA). After transformation, individual colonies were picked, plasmids were prepared and cloned PCR products were subjected to double stranded sequencing.
Western blotting
Equal number of K562 cells/PBMCs isolated from patients and controls were washed twice with ice cold PBS and lysed in radioimmunoprecipitation assay (RIPA) buffer (50 mM Tris / HCl pH 7.5, 1 mM ethylenediaminetetraacetic acid pH 8.0, 1% NP-40, 150 mM NaCl, 10 mM MgCl2, 10 mM NaF, 1.0 μg/ml protease inhibitor cocktail). Cell lysates containing equal amounts of total protein (∼80 μg) were resolved on 12% SDS-PAGE and transferred on to a 0.45 μm (pore size) nitrocellulose membrane (mdi, Ambala Cantt, India). CTSL was detected by incubating the blots with a monoclonal anti-CTSL IgG (Sigma-Aldrich) followed by incubation with alkaline phosphatase-conjugated goat antimouse IgG (Santa Cruz Biotechnology, Santa Cruz, CA, USA). Proteins bands were visualized using premixed 5-bromo-4-chloroindol-2-yl phosphate/Nitro Blue tetrazolium solution (Sigma-Aldrich). Simultaneously Western blot analysis for α-tubulin was performed with a monoclonal antibody (Sigma-Aldrich) which served as a control for equal loading.
Statistical analysis
For descriptive statistics the SPSS PC software was used (Release 13.0, SPSS, Inc., Chicago, IL, USA). The differences in CTSL, cystatin C and VEGF expression levels were tested by Mann-Whitney U-test. All tests were two sided. P-value of ≤ 0.05 was considered statistically significant. Because the distribution of variables (2−ΔCt values of CTSL, VEGF, cystatin C and Bcr-Abl) were skewed, log transformation was applied to convert them into normal distribution. Hence, Pearson correlation coefficient was used to find out the degree of relationship amongst the CTSL and cystatin C, VEGF as well as Bcr-Abl.
Results
Characteristics of patients and controls
A total of 47 de novo untreated CML patients, 30 patients suffering from systemic diseases (PCs) and 50 healthy volunteers (NC) were recruited for the study. Thirty-eight of 47 CML patients were identified in CML CP and remaining 9 were in CML AP/BC phase. The baseline characteristics and blood parameters of these patients are shown in Table 1.
Table 1.
Summary of the baseline characteristics and blood parameters of CML patients and controls
| Source of PBMCs | Patient characteristics median values (range) | ||||
|---|---|---|---|---|---|
| Age (years) | Gender ratio (M:F) | Haemoglobin (g/dl) | Total leucocyte count (×10−3/μl) | Platelet count (×10−3/μl) | |
| CML CP patients (n= 38) | 32 (18–90) | 12:7 | 9.7 (4.2–14.6) | 175.2 (98.9–572) | 247.8 (103.5–398) |
| CML AP/BC patients (n= 9) | 45 (27–69) | 9:0 | 10.2 (5.9–13.9) | 182 (24.3–350) | 150 (98–320) |
| PCs (n= 30) | 45 (18–78) | 2:1 | 10.3 (7–13.8) | 23.1 (17.4–36.6) | 265 (60–923) |
| NCs (n= 50) | 28 (18–75) | 16:9 | 10.9 (9.1–15) | 6.5 (4.6–9.7) | 317 (151–404) |
CTSL activity and mRNA levels
The median CTSL activity in the PBMCs of CML-CP patients was 954.4 AU (range, 447.6–4106 AU) where as in CML AP/BC patients it was 437.2 AU (range, 225–490 AU). Similarly K562 cell line exhibited an average CTSL activity of 400 AU which was comparable to CML AP/BC group. Among the two control groups, patient (PCs) and healthy controls (NC) exhibited median CTSL activity of 288.2 AU (range, 83.6–365.8 AU) and 271 AU (range, 101.4–435.4 AU), respectively. Thus, the median CTSL activity of CML-CP patients was 2.2-fold higher than its activity in AP/BC patients, 3.3-fold higher than PCs and 3.5-fold higher than NCs (P≤ 0.001, Mann-Whitney U-test; Fig. 1A). The CTSL activity in AP/BC patients was higher by 1.5-fold as compared to PCs and 1.6-fold higher than that observed in NC (P≤ 0.001, Fig. 1A).
Fig 1.
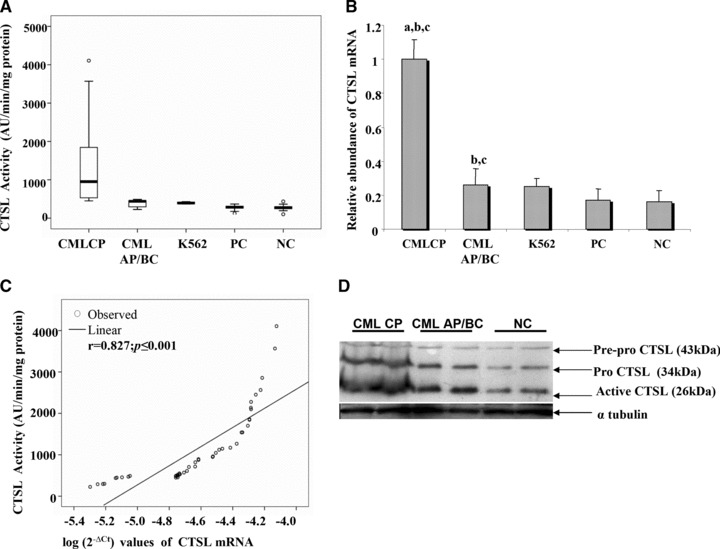
Activity and expression of CTSL expression in CML patients. (A) Box plot representation of CTSL activity in CML patients. (B) Relative abundance of CTSL mRNA in CML patients and controls. (a) Significantly higher compared to CML AP/BC as well as K562 cells; (b) significantly higher compared to PCs; (c) significantly higher compared to normal healthy controls (NC) (P # 0.001, Mann-Whitney U-test). (C) Correlation between activity and mRNA expression of CTSL in CML patients (Pearson correlation analysis) (D) CTSL expression in various phases of CML. Immuno-blotting of CTSL protein in PBMCs isolated from representative CML CP, CML AP/BC and NC samples was carried out as described in Materials and methods. Simultaneously, a-tubulin was also detected in the same samples to serve as loading control.
The CTSL mRNA expression in CML CP patients was 3.8-fold higher compared to CML AP/BC patients; 5.9-fold higher compared to PCs and 6.2-fold higher than NC (P≤ 0.001, Fig. 1B). Even though the CTSL mRNA expression in CML AP/BC was significantly reduced compared to CML CP patients, these patients exhibited 1.5- and 1.6-fold higher CTSL mRNA compared to PCs and NC, respectively (P≤ 0.001, Fig. 1B). Consistent with the activity, the CTSL mRNA expression in CML AP/BC patients and K562 cell line was comparable. A strong positive correlation (r= 0.827, P≤ 0.001; Pearson’s correlation analysis) was observed between CTSL activity and CTSL mRNA expression in all CML patients (Fig. 1C).
To further confirm the elevated expression of CTSL in CP of CML, representative samples of CML CP, CML AP/BC and NCs were subjected to immuno-blot analysis using a monoclonal antibody. As evident from Figure 1D, immuno-reactive pre-pro (43 kD); pro-(36 kD) and mature (26 kD) forms of CTSL were detected in all the above mentioned samples. Consistent with the data on enzymatic activity and mRNA expression, we observed convincingly higher levels of immuno-reactive CTSL (all forms) in CML CP patients as compared to CML AP/BC and NCs. Similarly, AP/BC patients exhibited higher levels of CTSL compared to NCs. However, no such difference in the expression of α-tubulin was observed among these groups.
VEGF mRNA expression and its correlation with CTSL expression
CML CP patients exhibited a 3.7-fold increase in VEGF expression compared to CML AP/BC patients (P≤ 0.001, Fig. 2A). Likewise, the VEGF mRNA expression observed in CML CP patients was 7.7- and 9.1-fold higher compared to PCs and NCs, respectively (P≤ 0.001, Fig. 2A). Though the VEGF mRNA expression was severely compromised in CML AP/BC patients, its expression was 2.1-fold higher in these patients compared to the PCs (P≤ 0.001, Fig. 2A) and 2.4-fold higher compared to NCs (P≤ 0.001, Fig. 2A). A strong positive correlation was observed between VEGF mRNA and CTSL mRNA expression (r= 0.97, P≤ 0.001; Pearson’s correlation analysis; Fig. 2B) in all CML patients.
Fig 2.
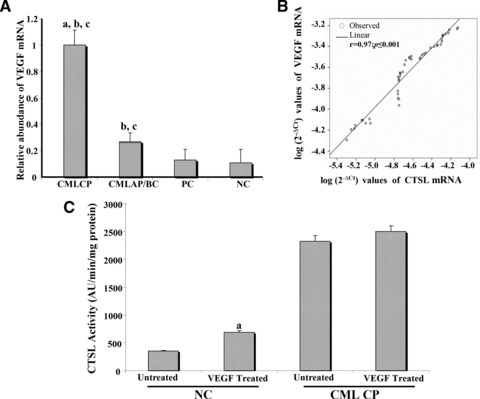
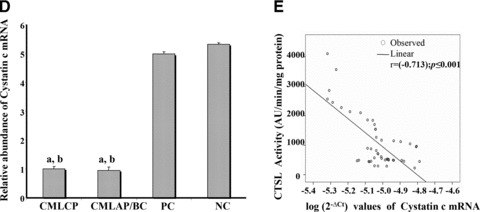
Expression of VEGF and cystatin C in CML. (A) Relative abundance of VEGF mRNA in CML patients and controls. (a) Signifi-cantly higher compared to CML AP/BC; (b) significantly higher compared to PCs; (c) significantly higher compared to NC (P≤ 0.001, Mann-Whitney U-test). (B) Correlation of VEGF with CTSL mRNA in the CML cohort. (Pearson correlation analysis) (C) Increase in CTSL activity by exogenous VEGF. PBMCs isolated from CML CP and NCs were seeded (80% confluent) in six-well plates followed by serum starvation for 12 hrs. Then 40 ng/ml of recombinant VEGF 165 was added to these cells in fresh serum free RPMI 1640 containing 0.1% bovine serum albumin. After 48 hrs of VEGF treatment, cells were lysed and CTSL activity in the lysates was measured as described in ‘Materials and methods’. PBMCs treated with PBS were processed identically and served as controls. Values presented are mean ± S.E. from four independent estimations. Results were analysed by Student’s t-test and values significantly different from respective controls have been marked by ‘a’. (D) Relative abundance of cystatin C mRNA in CML patients and controls; (a) significantly lower compared to PCs; (b) significantly lower compared to NC (P≤ 0.001, Mann-Whitney U-test). (E) Correlation of cystatin C mRNA with CTSL activity in the CML cohort (Pearson correlation analysis).
Treatment of PBMCs isolated from NCs with recombinant VEGF resulted in a statistically significant 1.92-fold increase (P= 0.02) in CTSL activity thereby confirming the role of this growth factor in elevating CTSL expression. However, only a marginal increase in the activity of this protease was observed when PBMCs isolated from CML CP patients were treated VEGF (Fig. 2C).
Cystatin C expression and its correlation with CTSL activity
There was no significant difference in the expression of cystatin C in CP and AP/BC phases of CML. Its expression was significantly elevated in the controls with NCs exhibiting 5.3- and 5.6-fold higher values compared to CML CP and CML AP/BC patients, respectively (P≤ 0.001, Fig. 2C). Similarly, the cystatin C mRNA expression in PCs was 5.0- and 5.3-fold higher compared to CML CP and CML AP/BC patients, respectively (P≤ 0.001, Fig. 2D). A strong inverse correlation was observed between cystatin C mRNA and CTSL activity in CML patients (r=[−0.713], P≤ 0.001; Pearson’s correlation analysis; Fig. 2E).
Association of Bcr-Abl with the expression of VEGF and CTSL mRNA in CML patients
A strong positive correlation was observed between Bcr-Abl and VEGF mRNA expression in CML CP patients (r= 0.536, P≤ 0.001, Fig. 3A). Interestingly, a strong positive correlation was also observed between Bcr-Abl and CTSL mRNA expression in CML CP patients (r= 0.601, P≤ 0.001; Fig. 3B). On the contrary, Bcr-Abl mRNA expression exhibited no correlation with either VEGF (r= 0.133, P= 0.732; Fig. 3C) or CTSL mRNA expression (r= 0.318, P= 0.404; Fig. 3D) in CML AP/BC patients.
Fig 3.
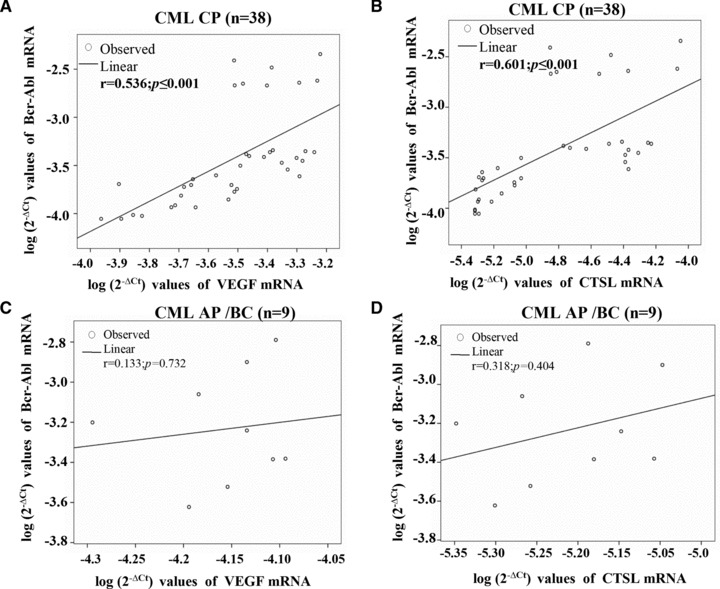
Bcr-Abl expression and its correlation with VEGF as well as CTSL. Correlation between Bcr-Abl and (A) VEGF or (B) CTSL mRNA expression in CML CP patients. Pearson correlation coefficient (r) indicated a strong positive association of Bcr-Abl with VEGF (A) as well as CTSL mRNA (B) expression in CML CP patients. Correlation between Bcr-Abl and (C) VEGF (D) CTSL mRNA expression in CML AP/BC patients. Pearson correlation coefficient (r) indicated no association of Bcr-Abl with VEGF (C) or CTSL (D) in CML AP/BC patients.
Role of promoter methylation in CTSL expression in various phases of CML
Jean et al.[31] reported the presence of a CpG island containing 40 CpG sites in 650 bp of CTSL promoter region proximal to the transcription initiation site and established the role of promoter methylation in regulating CTSL expression in melanoma cells. In an effort to understand the role of promoter methylation in phase-specific expression of CTSL in CML, we analysed the methylation status of half of these sites.
As summarized in Figure 4, most (65–80%) of the CpG dinucleotides of CTSL promoter were methylated in the controls (PCs and NCs). Among the 20 CpG sites analysed, 13–16 sites were methylated in the controls. The CpG dinucleotide present at the 10th site was observed to be most frequently methylated followed by CpG sites at the 17th, 12th, 4th, 13th, 14th, 5th, 15th and 16th positions, respectively. Interestingly, only three to five CpG dinucleotides (15–25%) were found methylated in CML CP patients.
Fig 4.
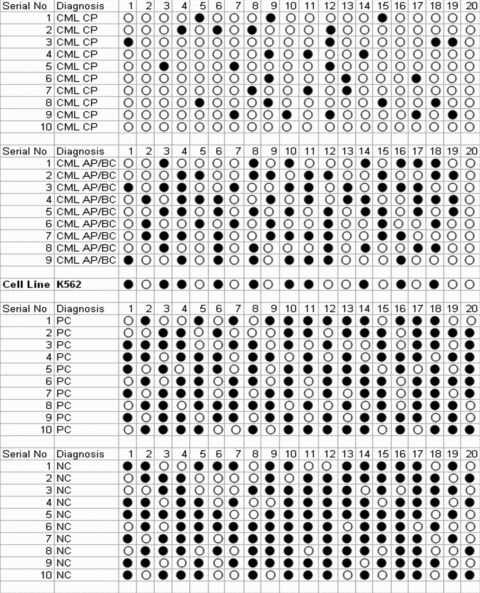
CTSL promoter methylation in leukaemia. Methylation status of the 650 bp CTSL promoter proximal to the transcription initiation site was performed in representative samples (n= 10) from CML CP, CML AP/BC, PCs and NC groups. Similarly, the methylation status of this promoter in K562, a cell line derived from BC CML patient, was assessed. Each CpG dinucleotide is represented by a circle. Open circle represents an unmethylated site whereas methylated sites have been represented by filled circles.
Consistent with these results K562 cells, a leukemic cell line derived from CML BC patients which expresses low levels of CTSL (Fig. 1A and B) also exhibited hypermethylation of CTSL promoter. As depicted in Figure 4, 10 sites were methylated in K562 which is comparable to the average methylated sites (9 ± 0.52; mean ± S.E.) in CML AP/BC patients. Treatment of K562 cells with 5′-aza-cytidine (a known inhibitor of DNA methyl transferase) resulted in a time dependent increase in the levels of CTSL mRNA (Fig. 5A). However, no such increase in the levels of cystatin C mRNA or 18S RNA was observed in these cells at any time during the course of treatment with 5′-aza-cytidine (Fig. 5A). The observed increase in CTSL mRNA levels after this treatment in K562 cells was further corroborated by a noticeable increase in immuno-reactive 26 kD enzymatically active form of CTSL detected by immuno-blotting (Fig. 5B).Under the same conditions, α-tubulin protein (control) was not altered by the 5′-aza-cytidine treatment (bottom line of Fig. 5B). Quantitative real-time PCR analysis revealed a significant (2.6-fold) increase (P≤ 0.05) in CTSL mRNA expression at 72 hrs (Fig. 5C). This was associated with a parallel increase (2.8-fold increase, P≤ 0.05, Student’s t-test) in CTSL activity (Fig. 5D).
Fig 5.
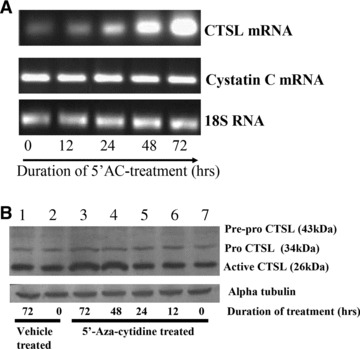
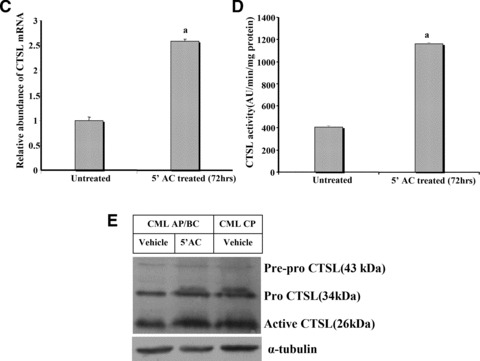
Quantitative analysis of CTSL in 5′-aza-cytidine treated K562 cells. (A) Effect of demethylating agent 5′-aza-cytidine on mRNA levels of CTSL and cystatin C. Total cellular RNA isolated from K562 cells grown in the presence of 5′-aza-cytidine for different time periods was reverse transcribed and subjected to PCR using primers specific for CTSL, cystatin C or 18S RNA. The amplified products were resolved on 1.2% agarose gel and visualized under UV after staining with ethidium bromide. (B) K562 cells were grown in the presence or absence of 5′-aza-cytidine for different time periods. Cell lysates containing equal amount of protein were immuno-blotted for CTSL protein using monoclonal antibodies against it. Immuno-blotting for α-tubulin served as loading control. Lane 1: Vehicle treated K562 cells at 72 hrs; lane 2: vehicle treated K562 cells at 0 hrs; lane 3: 5′-aza-cytidine treated K562 cells at 72 hrs; lane 4: 5′-aza-cytidine treated K562 cells at 48 hrs; lane 5: 5′-aza-cytidine treated K562 cells at 24 hrs; lane 6: 5′-aza-cytidine treated K562 cells at 12 hrs; lane 7: untreated K562 cells. (C) Total RNA isolated from untreated K562 cells or after treatment with 5 μM 5′-aza-cytidine for 72 hrs was reverse transcribed and subjected to real-time PCR using amplimers specific for CTSL mRNA. a – significantly higher compared to untreated K562 cells (P≤ 0.05, Student’s test). (D) Cell lysates were prepared from untreated or 5 μM 5′-aza-cytidine treated K562 cells. CTSL-specific assay was performed with equal amount of total protein. a – significantly higher compared to untreated K562 cells (P≤ 0.05, Student’s test). (E) 5′-aza-cytidine treatment increases CTSL expression in CML AP/BC. A total of 3 × 10⁷ PBMCs isolated from CML AP/BC patients were plated in each well of a six-well dish and treated with 5 μM 5′-aza-cytidine or vehicle control. After 72 hrs the PBMCs were lysed and CTSL in the cell lysate was assessed by Western blotting and compared with its expression in untreated PBMCs isolated from CML CP patients. Immuno-blotting for α-tubulin served as loading control.
The role of promoter hyper-methylation in decreasing CTSL expression in CML AP/BC was further corroborated by treating PBMCs isolated from these patients with 5′-aza-cytidine. As evident from Figure 5E, aza-cytidine treated PBMCs from these patients exhibited higher levels of immuno-reactive CTSL as compared to their untreated counterparts. After this treatment the levels of CTSL in AP/BC PBMCs was found to be comparable to that observed in CML CP patients (Fig. 5E).
Discussion
Elevated expression of CTSL has been reported in a number of human tumours [9, 12]. However, this is the first study that represents the analysis of CTSL expression in leukemic cells of CML patients. Assessment of CTSL activity and its mRNA expression revealed that this protease is overexpressed in the PBMCs of CML patients compared to healthy controls and patients suffering from systemic diseases (PCs). In addition, our results also indicated that the expression of CTSL was maximum in CP of the disease and decreased with its progression to AP/BC. A similar variation in the expression of several other proteins over the course of CML has been documented [32, 33]. Likewise, CTSL also appears to exhibit a stage-specific expression in CML, and may be used in distinguishing the patients in different phases of the disease.
VEGF has been demonstrated to be the principle mediator of angiogenesis in leukaemia and its absence cannot be adequately compensated by other angiogenic factors [34]. Results of the present study demonstrate a significant increase in VEGF mRNA expression in CML patients compared to patients with systemic infections and normal healthy volunteers. Our observation reiterates up-regulation of VEGF in the bone marrow and the PBMCs of patients with chronic myeloproliferative disorders [35]. Mayerhofer et al. [36] reported the induction of VEGF by Bcr-Abl. Consistent with these results we found a strong correlation between the Bcr-Abl and VEGF mRNA expression in the CML CP patients. Interestingly, CML patients in BC display significantly lower VEGF levels compared to the patients in CP. The data presented herein are in agreement with the findings of Krauth et al.[37] on lower VEGF expression in blasts of CML-BC compared to that of CML-CP. In the present study no correlation was observed between the Bcr-Abl and VEGF mRNA expression in CML AP/BC patients. These results suggest that Bcr-Abl induced signal pathway may not be solely responsible for altered VEGF mRNA expression in this phase of CML.
Results of the present study exhibit a positive correlation between CTSL and VEGF in CML. As stated earlier, a concomitant decrease in CTSL mRNA expression and activity observed in CML AP/BC compared to CML CP was associated with a parallel decrease in VEGF expression. These results suggest regulation of CTSL by VEGF thereby reiterating our previous findings [18]. This was confirmed by treatment of PBMCs with recombinant VEGF. However, cells obtained from healthy individuals were relatively more responsive to this treatment compared to that of CML CP patients. The non responsiveness of PBMCs isolated from these patients may be attributed to the overexpression of VEGF which in turn might be saturating all its receptors on these cells.
The activities of cathepsins B, H and L are also regulated by the endogenous cysteine protease inhibitors. Cystatin C is a known endogenous inhibitor of cysteine cathepsins whose expression has been reported to alter in a number of human tumours [38–40]. We observed decreased expression of cystatin C mRNA and its inverse relationship with the CTSL activity in CML patients. The lower levels of endogenous cystatin C may contribute to elevated CTSL activity in CML. Rivenbark et al.[41], reported methylation dependent silencing of cystatin M in breast cancer. However, our experiment on treatment of K562 cells with 5′-aza-cytidine ruled out the involvement of methylation in regulating cystatin C expression.
Epigenetic changes have been reported to alter the expression of a wide variety of genes by altering their transcription [42]. Jean et al.[31] reported the presence of a CpG island containing 40 CpG sites in 650 bp of CTSL promoter region proximal to the transcription initiation site and established the role of promoter methylation in regulating CTSL expression in melanoma cells. In an effort to understand the role of promoter methylation in phase-specific expression of CTSL in CML, we analysed the methylation status of half of these sites Results of the present study demonstrate hypomethylation of CTSL promoter in CML CP compared to CML AP/BC. 5′-aza-cytidine and its derivatives have been used to establish the involvement of DNA methylation in regulating the expression of genes such as TGF α[43] connexin [44], etc. When K562 cells, or PBMCs of CML AP/BC patients were treated with this demethylating agent, it lead to a robust increase in CTSL expression without having any noticeable cytotoxic effect on these cells. This confirmed the role of CTSL promoter methylation in regulating phase dependent expression of this protease in CML.
Increased bone marrow angiogenic activity has been documented in most haematological malignancies but CML patients exhibit highest number of blood vessels and largest vascular area [45–47]. However, patients in blastic phase of CML are characterized by microvessels with rounder shape and smaller calibre than those in CP [47]. Proteolytic degradation of extracellular matrix plays a critical role in cell migration and formation of functional blood vessels [48, 49]. CTSL is very potent in degrading components of extracellular matrix and specific inhibitors of this protease can impair angiogenesis [50–52]. In this context it is possible that elevated expression of CTSL in CP of CML contributes to the formation of high calibre microvessels which are poorly formed in blastic phase, when the expression level of this protease is not that high.
In summary, this is the first report demonstrating the phase-specific expression of CTSL in CML. The activity and expression of this protease is significantly higher in the CP but exhibit drastic reduction in the CML AP/BC phase. We demonstrate that elevated expression of CTSL in CP of the disease is due to the hypomethylation of its promoter and higher VEGF levels. From a clinical point of view, assessing the activity and expression of CTSL in the de novo CML patients may help in identifying patients at advanced stage of CML and thereby in the management of this malignancy.
Acknowledgments
M.J. and A.A.S. were the recipients of junior and senior research fellowship from University Grants Commission and Council of Scientific and Industrial Research, Government of India, respectively.
Conflict of interest
The authors declare no conflict of interest in connection with the publication of this article.
References
- 1.Faderl S, Talpaz M, Estrov Z, et al. Chronic myelogenous leukemia: biology and therapy. Ann Intern Med. 1999;131:207–19. doi: 10.7326/0003-4819-131-3-199908030-00008. [DOI] [PubMed] [Google Scholar]
- 2.Sawyers CL. Chronic myeloid leukemia. N Engl J Med. 1999;340:1330–40. doi: 10.1056/NEJM199904293401706. [DOI] [PubMed] [Google Scholar]
- 3.Daley GQ, Van Etten RA, Baltimore D. Induction of chronic myelogenous leukemia in mice by the P210bcr/abl gene of the Philadelphia chromosome. Science. 1990;247:824–30. doi: 10.1126/science.2406902. [DOI] [PubMed] [Google Scholar]
- 4.Kelliher MA, McLaughlin J, Witte ON, et al. Induction of a chronic myelogenous leukemia -like syndrome in mice with v-abl and BCR/ABL. Proc Natl Acad Sci USA. 1990;87:6649–53. doi: 10.1073/pnas.87.17.6649. [DOI] [PMC free article] [PubMed] [Google Scholar]
- 5.Heisterkamp N, Jenster G, ten Hoeve J, et al. Acute leukaemia in bcr/abl transgenic mice. Nature. 1990;344:251–3. doi: 10.1038/344251a0. [DOI] [PubMed] [Google Scholar]
- 6.Lugo TG, Pendergast AM, Muller AJ, et al. Tyrosine kinase activity and transformation potency of bcr-abl oncogene products. Science. 1990;247:1079–82. doi: 10.1126/science.2408149. [DOI] [PubMed] [Google Scholar]
- 7.Janowska-Wieczorek A, Majka M, Marquez-Curtis L, et al. Bcr-abl-positive cells secrete angiogenic factors including matrix metalloproteinases and stimulate angiogenesis in vivo in Matrigel implants. Leukemia. 2002;16:1160–6. doi: 10.1038/sj.leu.2402486. [DOI] [PubMed] [Google Scholar]
- 8.Sun X, Li Y, Yu W, et al. MT1-MMP as a downstream target of BCR-ABL/ABL interactor 1 signaling: polarized distribution and involvement in BCR-ABL-stimulated leukemic cell migration. Leukemia. 2008;22:1053–6. doi: 10.1038/sj.leu.2404990. [DOI] [PMC free article] [PubMed] [Google Scholar]
- 9.Chauhan SS, Goldstein LJ, Gottesman MM. Expression of cathepsin L in human tumors. Cancer Res. 1991;51:1478–81. [PubMed] [Google Scholar]
- 10.Dennemärker J, Lohmüller T, Mayerle J, et al. Deficiency for the cysteine protease cathepsin L promotes tumor progression in mouse epidermis. Oncogene. 2010;29:1611–21. doi: 10.1038/onc.2009.466. [DOI] [PMC free article] [PubMed] [Google Scholar]
- 11.Gocheva V, Joyce JA. Cysteine cathepsins and the cutting edge of cancer invasion. Cell Cycle. 2007;6:60–4. doi: 10.4161/cc.6.1.3669. [DOI] [PubMed] [Google Scholar]
- 12.Lankelma JM, Voorend DM, Barwari T, et al. Cathepsin L, target in cancer treatment. Life Sci. 2010;86:225–33. doi: 10.1016/j.lfs.2009.11.016. [DOI] [PubMed] [Google Scholar]
- 13.Gerber A, Wille a, Welte T, et al. Interleukin-6 and transforming growth factor-beta 1 control expression of cathepsins B and L in human lung epithelial cells. J Interferon Cytokine Res. 2001;21:11–9. doi: 10.1089/107999001459114. [DOI] [PubMed] [Google Scholar]
- 14.Gallardo E, de Andres I, Illa I. Cathepsins are upregulated by IFN-gamma/STAT1 in human muscle culture: a possible active factor in dermatomyositis. J Neuropathol Exp Neurol. 2001;60:847–55. doi: 10.1093/jnen/60.9.847. [DOI] [PubMed] [Google Scholar]
- 15.Collette J, Ulku AS, Der CJ, et al. Enhanced cathepsin L expression is mediated by different Ras effector pathways in fibroblasts and epithelial cells. Int J Cancer. 2004;112:190–9. doi: 10.1002/ijc.20398. [DOI] [PubMed] [Google Scholar]
- 16.Kim K, Cai J, Shuja S, et al. Presence of activated ras correlates with increased cysteine proteinase activities in human colorectal carcinomas. Int J Cancer. 1998;79:324–33. doi: 10.1002/(sici)1097-0215(19980821)79:4<324::aid-ijc4>3.0.co;2-x. [DOI] [PubMed] [Google Scholar]
- 17.Gottesman MM, Sobel ME. Tumor promoters and Kirsten sarcoma virus increase synthesis of a secreted glycoprotein by regulating levels of translatable mRNA. Cell. 1980;19:449–55. doi: 10.1016/0092-8674(80)90519-x. [DOI] [PubMed] [Google Scholar]
- 18.Keerthivasan S, Keerthivasan G, Mittal S, et al. Transcriptional upregulation of human cathepsin L by VEGF in glioblastoma cells. Gene. 2007;399:129–36. doi: 10.1016/j.gene.2007.05.002. [DOI] [PubMed] [Google Scholar]
- 19.Chauhan SS, Ray D, Kane SE, et al. Involvement of carboxy-terminal amino acids in secretion of human lysosomal protease cathepsin L. Biochemistry. 1998;37:8584–94. doi: 10.1021/bi972251z. [DOI] [PubMed] [Google Scholar]
- 20.Trinkaus M, Vranic A, Dolenc VV, et al. Cathepsins B and L and their inhibitors stefin B and cystatin C as markers for malignant progression of benign meningiomas. Int J Biol Markers. 2005;20:50–9. doi: 10.1177/172460080502000108. [DOI] [PubMed] [Google Scholar]
- 21.Kayser K, Richter N, Hufnagl P, et al. Expression, proliferation activity and clinical significance of cathepsin B and cathepsin L in operated lung cancer. Anticancer Res. 2003;23:2767–72. [PubMed] [Google Scholar]
- 22.Foekens JA, Kos J, Peters HA, et al. Prognostic significance of cathepsins B and L in primary human breast cancer. J Clin Oncol. 1998;16:1013–21. doi: 10.1200/JCO.1998.16.3.1013. [DOI] [PubMed] [Google Scholar]
- 23.Niedergethmann M, Wostbrock B, Sturm JW, et al. Prognostic impact of cysteine proteases cathepsin B and cathepsin L in pancreatic adenocarcinoma. Pancreas. 2004;29:204–11. doi: 10.1097/00006676-200410000-00005. [DOI] [PubMed] [Google Scholar]
- 24.Chauhan SS, Popescu NC, Ray D, et al. Cloning, genomic organization, and chromosomal localization of human cathepsin L. J Biol Chem. 1993;268:1039–45. [PubMed] [Google Scholar]
- 25.Arora S, Chauhan SS. Identification and characterization of a novel human cathepsin L splice variant. Gene. 2002;293:123–31. doi: 10.1016/s0378-1119(02)00700-x. [DOI] [PubMed] [Google Scholar]
- 26.Albano F, Specchia G, Anelli L, et al. Genomic deletions on other chromosomes involved in variant t(9;22) chronic myeloid leukemia cases. Genes Chromosomes Cancer. 2003;36:353–60. doi: 10.1002/gcc.10183. [DOI] [PubMed] [Google Scholar]
- 27.Lozzio CB, Lozzio BB. Human chronic myelogenous leukemia cell-line with positive Philadelphia chromosome. Blood. 1975;45:321–34. [PubMed] [Google Scholar]
- 28.Bradford MM. A rapid and sensitive method for the quantitation of microgram quantities of protein utilizing the principle of protein-dye binding. Anal Biochem. 1976;72:248–54. doi: 10.1016/0003-2697(76)90527-3. [DOI] [PubMed] [Google Scholar]
- 29.Divya , Chhikara P, Mahajan VS, et al. Differential activity of cathepsin L in human placenta at two different stages of gestation. Placenta. 2002;23:59–64. doi: 10.1053/plac.2001.0748. [DOI] [PubMed] [Google Scholar]
- 30.Pfaffl MW. A new mathematical model for relative quantification in real- time RT-PCR. Nucleic Acids Res. 2001;29:2002–7. doi: 10.1093/nar/29.9.e45. [DOI] [PMC free article] [PubMed] [Google Scholar]
- 31.Jean D, Rousselet N, Frade R. Expression of cathepsin L in human tumor cells is under the control of distinct regulatory mechanisms. Oncogene. 2006;25:1474–84. doi: 10.1038/sj.onc.1209196. [DOI] [PubMed] [Google Scholar]
- 32.Vidovic A, Jankovic G, Colovic M, et al. The proto-oncogene expression varies over the course of chronic myeloid leukemia. Hematology. 2008;13:34–40. doi: 10.1179/102453308X315807. [DOI] [PubMed] [Google Scholar]
- 33.Janssen JJ, Klaver SM, Waisfisz Q, et al. Identification of genes potentially involved in disease transformation of CML. Leukemia. 2005;19:998–1004. doi: 10.1038/sj.leu.2403735. [DOI] [PubMed] [Google Scholar]
- 34.He R, Liu B, Yang C, et al. Inhibition of K562 leukemia angiogenesis and growth by expression of antisense vascular endothelial growth factor (VEGF) sequence. Cancer Gene Ther. 2003;10:879–86. doi: 10.1038/sj.cgt.7700645. [DOI] [PubMed] [Google Scholar]
- 35.Musolino C, Calabro L, Bellomo G, et al. Soluble angiogenic factors: implications for chronic myeloproliferative disorders. Am J Hematol. 2002;69:159–63. doi: 10.1002/ajh.10020. [DOI] [PubMed] [Google Scholar]
- 36.Mayerhofer M, Valent P, Sperr WR, et al. BCR/ABL induces expression of vascular endothelial growth factor and its transcriptional activator, hypoxia inducible factor-1alpha, through a pathway involving phosphoinositide 3-kinase and the mammalian target of rapamycin. Blood. 2002;100:3767–75. doi: 10.1182/blood-2002-01-0109. [DOI] [PubMed] [Google Scholar]
- 37.Krauth MT, Simonitsch I, Aichberger KJ, et al. Immunohistochemical detection of VEGF in the bone marrow of patients with chronic myeloid leukemia and correlation with the phase of disease. Am J Clin Pathol. 2004;121:473–81. doi: 10.1309/3JLT-FNNE-DQHB-4A0P. [DOI] [PubMed] [Google Scholar]
- 38.Muller-Esterl W, Fritz H, Kellermann J, et al. Genealogy of mammalian cysteine proteinase inhibitors. Common evolutionary origin of stefins, cystatins and kininogens. FEBS Lett. 1985;191:221–6. doi: 10.1016/0014-5793(85)80012-0. [DOI] [PubMed] [Google Scholar]
- 39.Konduri SD, Yanamandra N, Siddique K, et al. Modulation of cystatin C expression impairs the invasive and tumorigenic potential of human glioblastoma cells. Oncogene. 2002;21:8705–12. doi: 10.1038/sj.onc.1205949. [DOI] [PubMed] [Google Scholar]
- 40.Vigneswaran N, Wu J, Muller S, et al. Expression analysis of cystatin C and M in laser-capture microdissectioned human breast cancer cells – a preliminary study. Pathol Res Pract. 2005;200:753–62. doi: 10.1016/j.prp.2004.09.005. [DOI] [PubMed] [Google Scholar]
- 41.Rivenbark AG, Livasy CA, Boyd CE, et al. Methylation-dependent silencing of CST6 in primary human breast tumors and metastatic lesions. Exp Mol Pathol. 2007;8:188–97. doi: 10.1016/j.yexmp.2007.03.008. [DOI] [PMC free article] [PubMed] [Google Scholar]
- 42.Sato N, Maitra A, Fukushima N, et al. Frequent hypomethylation of multiple genes overexpressed in pancreatic ductal adenocarcinoma. Cancer Res. 2003;63:4158–66. [PubMed] [Google Scholar]
- 43.Shin TH, Paterson AJ, Grant JH, 3rd, et al. 5-Azacytidine treatment of HA-A melanoma cells induces Sp1 activity and concomitant transforming growth factor alpha expression. Mol Cell Biol. 1992;12:3998–4006. doi: 10.1128/mcb.12.9.3998. [DOI] [PMC free article] [PubMed] [Google Scholar]
- 44.Hagiwara H, Sato H, Ohde Y, et al. 5-Aza-2′-deoxycytidine suppresses human renal carcinoma cell growth in a xenograft model via up-regulation of the connexin 32 gene. Br J Pharmacol. 2008;153:1373–81. doi: 10.1038/bjp.2008.17. [DOI] [PMC free article] [PubMed] [Google Scholar]
- 45.Aguayo A, Kantarjian H, Manshouri T, et al. Angiogenesis in acute and chronic leukemias and myelodysplastic syndromes. Blood. 2000;96:2240–5. [PubMed] [Google Scholar]
- 46.Di Raimondo F, Palumbo GA, Molica S, et al. Angiogenesis in chronic myeloproliferative diseases. Acta Haematol. 2001;106:177–83. doi: 10.1159/000046614. [DOI] [PubMed] [Google Scholar]
- 47.Korkolopoulou P, Viniou N, Kavantzas N, et al. Clinicopathologic correlations of bone marrow angiogenesis in chronic myeloid leukemia: a morphometric study. Leukemia. 2003;17:89–97. doi: 10.1038/sj.leu.2402769. [DOI] [PubMed] [Google Scholar]
- 48.Carmeliet P. Angiogenesis in health and disease. Nat Med. 2003;9:653–60. doi: 10.1038/nm0603-653. [DOI] [PubMed] [Google Scholar]
- 49.Kalluri R. Basement membranes: structure, assembly and role in tumour angiogenesis. Nat Rev Cancer. 2003;3:422–33. doi: 10.1038/nrc1094. [DOI] [PubMed] [Google Scholar]
- 50.Kane SE, Gottesman MM. The role of cathepsin L in malignant transformation. Semin Cancer Biol. 1990;1:127–36. [PubMed] [Google Scholar]
- 51.Rebbaa A, Chu F, Sudha T, et al. The anti-angiogenic activity of NSITC, a specific cathepsin L inhibitor. Anticancer Res. 2009;29:4473–81. [PubMed] [Google Scholar]
- 52.Shimada N, Ohno-Matsui K, Iseki S, et al. Cathepsin L in bone marrow-derived cells is required for retinal and choroidal neovascularization. Am J Pathol. 2010;176:2571–80. doi: 10.2353/ajpath.2010.091027. [DOI] [PMC free article] [PubMed] [Google Scholar]