

Significance
IGHV mutation status is a well established prognostic factor in chronic lymphocytic leukemia, and also provides crucial insights into tumor cell biology and function. Currently, determination of IGHV transcript sequence, from which mutation status is calculated, requires a specialized laboratory procedure. RNA sequencing is a method that provides high resolution, high dynamic range transcriptome data that can be used for differential expression, isoform discovery, and variant determination. In this paper, we demonstrate that unselected next-generation RNA sequencing can accurately determine the IGH@ sequence, including the complete sequence of the complementarity-determining region 3 (CDR3), and mutation status of CLL cells, potentially replacing the current method which is a specialized, single-purpose Sanger-sequencing based test.
Keywords: RNA sequencing, immunoglobulin, somatic hypermutation, B cells, CLL
Abstract
Immunoglobulins (Ig) are produced by B lymphocytes as secreted antibodies or as part of the B-cell receptor. There is tremendous diversity of potential Ig transcripts (>1 × 10¹²) as a result of hundreds of germ-line gene segments, random nucleotide incorporation during joining of gene segments into a complete transcript, and the process of somatic hypermutation at individual nucleotides. This recombination and mutation process takes place in the maturing B cell and is responsible for the diversity of potential epitope recognition. Cancers arising from mature B cells are characterized by clonal production of Ig heavy (IGH@) and light chain transcripts, although whether the sequence has undergone somatic hypermutation is dependent on the maturation stage at which the neoplastic clone arose. Chronic lymphocytic leukemia (CLL) is the most common leukemia in adults and arises from a mature B cell with either mutated or unmutated IGH@ transcripts, the latter having worse prognosis and the assessment of which is routinely performed in the clinic. Currently, IGHV mutation status is assessed by Sanger sequencing and comparing the transcript to known germ-line genes. In this paper, we demonstrate that complete IGH@ V-D-J sequences can be computed from unselected RNA-seq reads with results equal or superior to the clinical procedure: in the only discordant case, the clinical transcript was out-of-frame. Therefore, a single RNA-seq assay can simultaneously yield gene expression profile, SNP and mutation information, as well as IGHV mutation status, and may one day be performed as a general test to capture multidimensional clinically relevant data in CLL.
Immunoglobulins (Igs) are proteins produced by mature B-lymphocytes that recognize foreign antigens, both as soluble antibody molecules and as part of the B-cell receptor. The generation of Ig diversity through gene recombination and hypermutation of the heavy chain (H) variable region (V) is essential to adaptive immunity. The extent of this process is strongly associated with both pathology and prognosis in chronic lymphocytic leukemia (CLL), wherein CLL that expresses an unmutated IGHV tends to be more aggressive than CLL using unmutated IGHV (1, 2). The accurate assessment of this IGHV mutation status is thus of a high clinical priority. As each patient’s leukemia generally expresses only a single IGH@, the mutation status of IGHV is determined by amplifying the expressed transcript via RT-PCR, sequencing the gene via the Sanger technique, and then comparing this sequence with known inherited IGHV sequences. However, there are limitations to such methods, including variation in technique across institutions. RNA-sequencing is a powerful technology that can simultaneously yield information about gene and isoform expression as well as underlying DNA sequence (3, 4). Motivated by the notion that a single RNA sequencing experiment could replace many other discrete tests (qPCR, genotyping, microarray, IGHV mutation analysis, etc.), we hypothesized that in the presence of a clonal B-cell population, patient-specific or consensus degenerate primers and a dedicated sequencing experiment were not necessary to fully characterize the clonal IGH@ transcript. Here, using the “Ig-ID” pipeline we developed, we demonstrate that Ig heavy chain transcripts, including, critically, the complete V-D-J sequence, can be computed from unselected (i.e., using standard random hexamer priming vice IGH@-targeting primers; ref. 5) RNA-sequencing reads from CLL patient tumor cells. These computed transcripts matched those obtained from a CLIA-approved clinical laboratory with high concordance, in some cases uncovering possible misamplification in the traditional approach.
Results
Seventeen CLL patient tumor samples with clinical data available were subjected to RNA sequencing (Materials and Methods) in a pilot study. First, to establish that traditional mapping strategies inadequately handle the complex germ-line rearrangements in the IGH@ locus (Fig. S1), we performed a genome-wide spliced-mapping and examination of IGH@. On average, ∼1% of all reads mapped to this region (Table S1). However, of reads mapping to this region, 21–48% could not be clearly and unambiguously assigned to a single feature in the region; this total also reflects the few nonimmunoglobulin features annotated in this region.
Using a naïve classifier frequently used for digital gene expression estimates, we counted the number of unambiguously mapped reads at V, D, and J genes. In each case, a V gene clearly emerged with the highest read count. In contrast, the D and J genes could not reliably be determined by simple counting, due either to the lack of a clear consensus highest mapping or the complete absence of mappings (Fig. S2). The identity of the V gene with the highest mapping was compared with the clinical (and later computed) V gene reported, and showed 94% and 100% concordance, respectively. The D and J genes with highest counts were not as informative. Likewise, neither mutation status, nor Ig nucleotide or translated peptide sequence could be obtained directly from these mapped data, indicating the need for an alternative method to correctly identify these genes.
Ig Transcript Reconstruction.
Next, using a genome-free method (Materials and Methods), each sample’s transcriptome was reconstructed de novo in the way the transcriptome of a poorly characterized or nonmodel organism would be (6), except that each sample was processed independently (whereas for transcriptome discovery samples are typically pooled before assembly), yielding ∼3 million putative transcripts per sample. Somatic mutations in heterogeneous cancer cell populations and assembly graph discontiguities in areas of low coverage inflated the size of the reconstructed transcriptome beyond the recently-estimated 196,520 human transcripts (7, 8).
After selecting for transcripts bearing sequence homology to IGHV genes, between 6 and 43 transcripts remained. This diversity reflected in part minor populations of B cells present in the sequenced sample, but in some samples several closely related transcripts with identical V-D-J sequence (e.g., with/without poly-A tails; transcript reverse complements) were represented as distinct transcripts, also increasing this number. Kappa and lambda light chain transcripts are also frequently recovered at this step, depending on their homology to heavy chain V genes. Light chain transcripts may also be targeted directly at this selection step by altering the homology affinity selector from heavy-chain V genes to light-chain V genes. Next, multiply-mapped reads were disambiguated and the transcript with the highest read count was determined. Likeliest V, D, and J alleles as well as percent identity to these references were calculated with IgBLAST (9). The V, D, J gene use and percent mutation (1 – identity) were then compared with available clinical data (Table 1).
Table 1.
Comparison of methods
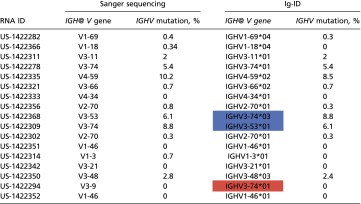 |
Concordance of V gene prediction and percent mutation between clinical laboratory and Ig-ID in the pilot set. Italic and bold cells indicate a mismatch with respect to clinical data: blue, samples US-1422368 and US-1422309 were identified as mislabeled (Table S3); red, the Sanger sequence from the clinical laboratory was out-of-frame and would not produce functional Ig.
The Percent Mutation Is Similar and the Binary Classifier Mutated/Unmutated Is Perfectly Concordant.
Seventeen sequenced samples with percent IGHV mutation (as determined by clinical laboratory test) recorded in the medical record were evaluated through our “Ig-ID” pipeline. The actual percent mutation obtained from Ig-ID was identical to the results provided by the clinical laboratory in 11 of 17 cases, with percentages within 1% for 5 cases, and within 2% for 1 case. Fig. 1 illustrates the substantial concordance between the computed and clinical results (Pearson’s r 0.992, 95% CI 0.976–0.998; concordance index 0.988, 95% CI 0.968–0.996), with differences between the two measures for each case versus their average value depicted in the form of a Bland–Altman plot. When samples were classified as mutated (M-CLL) or unmutated (U-CLL) according to the established 98% identity cutoff (10), unmutated cases comprised 12 of the 17 cases (71%), whereas mutated cases numbered 5 (29%). Within the unmutated subgroup, the percent IGHV mutation was identical in 8 (67%), and differences were within 1% in the other 4 cases (mean squared error of 0.216). Within the mutated subgroup, the percent IGHV mutation was identical in 3 (60%), with the two nonmatching cases differing by 0.4% and 1.7% (Table 1). Critically, the classification of IGHV mutated versus unmutated using RNA-seq data with the Ig-ID pipeline was perfectly concordant with reported clinical data in all 17 cases (Table 1 and Table S2).
Fig. 1.
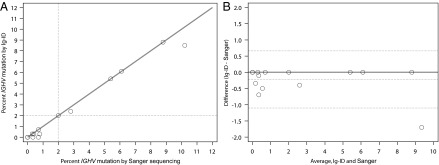
Comparison of Ig-ID computational pipeline values and clinical laboratory methods using PCR amplification in the pilot set. Five patients were zero percent mutated by both methods. (A) Scatter plot with identity line, correcting for samples US-1422368 and US-1422309. Dashed lines at 2% represent standardized cutoff for the mutated/unmutated classifier. (B) Bland–Altman plot of the same data with a continuous line of zero difference and dashed lines for the estimated mean difference ± 2 SDs.
Discrepancies in Percent Mutation Are Due to Sequence Length.
To explore reasons for discrepant percent mutation, we compared RNA-seq data with transcripts from the original clinical laboratory procedure. Of 17 samples, 12 had PCR-amplified, Sanger-sequenced transcripts available for comparison. The supplied transcripts were input into IgBLAST and the output was confirmed to match that reported in the medical record. For samples with percent mutation discrepancy between the clinical laboratory and the Ig-ID pipeline, computed and empirical transcripts were aligned to one another. Examining alignments from the most discrepant case (US-1422335; 10.2% with Sanger sequencing versus 8.5% with Ig-ID), revealed that the higher percent mutation in the Sanger-sequenced sample was due to a smaller amplified PCR product (Fig. 2). This is an inescapable consequence of occasionally difficult amplification with leader-region primers, necessitating the use of amplification primers within the framework region of the V gene that lead to shortening of the resultant transcript. Although in this case both mutation percentages were above 2%, and hence clearly classified as mutated (10), this important consequence indicates that cases nearer the 2% threshold are at risk for being called incorrectly when framework primers must be used.
Fig. 2.

Comparison of Sanger sequencing and Ig-ID. Percent mutation calculation is ideally performed for all nucleotides within the highlighted region. Amplification of clonal transcripts often requires use of framework region primers, with the result that the entire V gene is not amplified and sequenced. The side-effect is that the denominator in the identity calculation is smaller; this may inflate the percent mutation compared with analysis of the full-length transcript. In this case, the reported percent mutation was 10.2%, whereas the Ig-ID calculated percent mutation was 8.5%.
Ig-ID Can Identify Mislabeled Samples.
After V-D-J use and mutation status had been determined for all samples, the results of the 17 that had IGHV documentation in the medical record were directly compared. Two samples with consecutive study numbers matched exactly (including percent mutation) if the RNA-seq sample identifiers were switched (Table S3). All study numbers and medical record numbers from multiple sources matched; the RNA-seq identifier from the outside sequencing facility was the sole source of the mismatch.
Identification of V Gene Use.
Adjusting for the mislabeled samples, 16 of 17 samples (94%) matched the predicted V gene use reported in the medical record. One sample (US-1422294) was predicted to use IGHV3-74*01 with 100% identity to reference, but was reported in the medical record to have used IGHV3-9 with 100% identity. However, when the actual transcript sequence from the clinical laboratory was examined, its V-J was out of frame; thus, this transcript would not yield a translated, functional Ig molecule. This erroneous transcript was likely the result of errant priming during the PCR step. If this case of misamplification is removed from analysis, Ig-ID matches the clinical laboratory’s V gene prediction in 16 of 16 (100%) cases.
Identification of Complete V-D-J Sequence.
Identification of the V gene and [potentially] mutated V-gene sequence is adequate for clinical determination of hypermutation status, but is not sufficient on its own to fully characterize the peptide sequence of the BCR or antibody molecule’s antigen recognition region. The complementarity-determining region (CDR) 3, which shares responsibility for antigen recognition with CDR1 and CDR2, lies only partly in the V gene and is more largely made up of N-junctional diversity sequence and the D gene (Fig. 3). Sanger sequencing, if using a reverse primer in the J gene, can recover this sequence. Iglesia et al. computed V genes, including mutated sequence, from polyA/mRNA-seq data, but this method was unable to cross the V-D boundary and recover the CDR3 sequence (11).
Fig. 3.
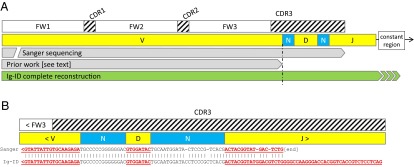
Comparison of Ig/BCR determination. (A) Sanger sequencing can span from V-J, but difficulties in amplification occasionally require the use of framework region primers rather than leader primers, leading to 5′ incomplete transcripts (Sanger bar interrupted on left). Sanger sequencing typically uses J region reverse primers, leading to incomplete J sequence recovery. Iglesia et al. inferred BCR V genes from mRNA-seq data, but the reconstruction did not span the N-diversity region leading to unknown or incomplete CDR3 sequence. In contrast, the Ig-ID computed transcript spans the entire V-D-J sequence, including junctional diversity regions. (B) Representative Sanger sequence wherein the Sanger sequencing reaction terminated in the J region. FW, framework region. CDR, complementarity determining region.
In addition to correctly determining the germ-line V gene present in the transcript and its exact sequence inclusive of hypermutation, the Ig-ID procedure recovers the entire V-D-J sequence; reconstruction of the entire V-D-J sequence and thus definition of the complete CDR3 is important to study BCR specificity and stereotypy. Available clinical laboratory Sanger sequences were compared with Ig-ID computed transcripts with pairwise alignment by the Smith-Waterman algorithm (12) with representative results illustrated in Fig. 3B.
Ig-ID Is Robust to Shorter Sequencing Length.
Because optimal RNA-sequencing experiment parameters are unknown, we sought to confirm Ig-ID in an independent validation set, reducing the read length, a key sequencing parameter. In the validation set, we examined five CLL patient samples and one CLL cell line that had undergone paired-end sequencing with a read length of 50 nucleotides (versus 91 for the pilot set). All six cases had both RNA-sequencing and clinical IGHV results available. All six computed clonal transcripts matched by V gene, and four of six matched precisely the percent mutation, whereas in two cases the percent mutation differences were 1.4% and 0.8%. Overall, this suggests that 50-nt paired-end RNA-seq is also able to identify IGH@ transcripts, a savings in time and expense over 100-nt sequencing.
Ig-ID Can Detect Biallelic and Second-Clone IGH@ Transcripts.
Multiple clonal immunoglobulins can be found in CLL patients due either to a lack of allelic exclusion by a single neoplastic clone, ongoing mutation of the IGH@ locus as a single clone diverges, or due to CLL clones that have neoplastically arisen independent of one another (“biclonal”) (13, 14). After initial comparison of computed data with data from the medical record, one record was identified wherein three transcripts were reported. In this case, the two highest computed transcripts corresponded to the first two reported transcripts in the medical record. The third reported transcript was not detected.
Discussion
The prognostic importance of somatic hypermutation within the Ig heavy chain variable region (IGHV) in CLL has been appreciated for well over a decade (1, 2). More recently, specific V gene use has been found to be informative as well. CLL cells are known to have a different distribution of V gene use compared with normal B cells (15). Furthermore, use of certain V genes (e.g., V1-69, V3-21) or even more specific restricted combinations of V(D)J and light chains are independent poor prognostic factors (16, 17), with specific types having distinct gene expression patterns (18). It is postulated that this stereotypy results in surface BCR with specific affinity for immunogen capable of tonically stimulating the BCR, thereby promoting cancer cell survival (19, 20). Additionally, there is evidence that certain stereotyped BCRs may be constitutively activated by self-self interaction (21). Recent work in BCR structure has further extended the relevance of BCR structure to explain common autoimmune complications of CLL (22).
Specific Ig constructions are informative in other B-cell malignancies as well. In mantle cell lymphoma, there is not only exceptionally biased use of just four IGHV genes with highly targeted complementarity determining region somatic hypermutation, but light chain stereotypy as well, again suggesting a role for antigen selection in this disease (23, 24). In hairy cell leukemia, use of IGHV4-34 defines a rare subset that is BRAF wild type and has a poor prognosis (25).
The current standard method of interrogating the variable region of the IGH transcript requires clonality analysis with gel or capillary electrophoresis and subsequent PCR amplification with consensus degenerate primers in the leader region. Unfortunately, this process is subject to the risk of misamplification (i.e., a transcript other than the primary clonal transcript is amplified) or even complete failure of amplification, in which alternative framework region primers might be tried (10). As demonstrated here (Fig. 2), framework amplification yields less-than-full-length transcripts and presents the risk of inaccurate calculation of percent identity. In particular, PCR-amplified transcripts are necessarily shorter than the true transcript, thus any consequent error in calculation results in inflated percent mutation. Further, foreshortened transcripts provide inadequate information for ongoing work in BCR structure and the search for antigen cognates in understanding how stereotypy plays a role in tonic activation of the malignant B cell. Lastly, there is a financial and human cost to any specialized, single-purpose laboratory procedure.
In this study, 100% of the samples tested were classified correctly according to IGHV mutational status (< or ≥ 2%), whereas the predicted V gene use was concordant in 22 of 23 (96%) cases. In the only discordant case, the clinical procedure most likely suffered from amplification of the wrong IGH@ transcript. This finding highlights the resilience of Ig-ID and its unbiased nonamplification strategy. The reconstruct-then-map strategy provides both the complete V-D-J sequence as well as a relative quantitation if the sample is oligoclonal. Moreover, this approach is extendable to Ig light chains as well as the T-cell receptor, and in contrast to amplification-based methods is not compromised or complicated by any specific type of IGHV or mutated sequence.
As with any conclusion, there are cautions. The number of cases studied and validated is small, although it is reasonable to ask for a test with one hundred percent concordance in one metric (SHM), and debatably one hundred percent in the other (V gene), how many validations are needed. The samples in this study were for the most part taken from leukemia patients with high absolute lymphocyte count and a lower limit of detection in terms of percent CLL cell purity in the sample remains to be defined. In the presence of B cells, other transcripts are detectable, but the point at which the combined mass of these transcripts overwhelms the detectability of the clonal transcript also remains undiscovered.
Others have previously identified clonal IGH and TCR transcripts from massively parallel sequencing data (5, 26–28) via targeted or enriched sequencing with ad hoc experiments for this specific purpose, and specifically for the detection of MRD. Early techniques required patient-specific amplification, whereas latter methods have been refined to work with consensus primers; at least one group has described the use of degenerate IGH targeted primers (28). All of these techniques have in common several key features, including an aim to detect minimal residual disease (MRD) and the requirement for a dedicated amplification step with a single-purpose sequencing run. Additionally, some methods require prior knowledge of the patient’s clonal lymphocytes, for example the V(D)J use or the CDR3 sequence in the Ig or TCR, to make a definitive statement about MRD. Finally, these techniques were pioneered on systems with long-read technology such as the 454 platform, while today Illumina and Ion Torrent dominate next-generation sequencing. More recently, Iglesia et al. identified BCR V genes of nonmalignant B lymphocytes from breast cancer mRNA-sequencing data (11), but this method is limited to the V gene and does not identify V-D-J sequence (Fig. 3B).
In contrast, and complementary to MRD detection efforts, here we sought to define the idiotype (via a complete IGH@ transcript) and to classify IGHV mutation status in patients with measurable disease without prior knowledge of idiotype or mutation status, without a dedicated or specialized laboratory procedure (ASO-PCR or degenerate primer amplification), and using commonly available short-read technology. Our method addresses each of these aspects, thereby further expanding the spectrum of utility of RNA sequencing experiments, opening the door to direct clinical application in CLL and other clonal lymphocytic diseases. The ability to extract the maximum possible amount and types of information from a single RNA sequencing experiment increases efficiency, helps preserve precious samples, better uses research funds, and frees up laboratory technicians by eliminating the need for individual purpose-specific tests.
Materials and Methods
Clinical Laboratory.
Sanger determination of IGHV gene use and percent mutation was done in the standard fashion at The Ohio State University Wexner Medical Center Molecular Pathology Laboratory for all patient cases and at The University of California San Diego Moores Cancer Center for the cell line. Briefly, RNA was isolated from peripheral blood mononuclear cells (PBMCs), and cDNA was made with random hexamer priming and PCR. cDNA was then combined with consensus primers and PCR amplified, with the resulting PCR product being subjected to capillary electrophoresis, and if only a single peak was seen in the tracing, Sanger sequencing on either an ABI 3730 DNA Analyzer or 3130XL Genetic Analyzer (Applied Biosystems). The resultant transcript sequence was entered into NCBI IgBLAST for identification of IGH@ V, D, and J genes and percent identity.
RNA Sequencing.
With informed consent and in accordance with an IRB approved protocol, PBMCs were isolated from 22 patients with CLL enrolled on clinical trials at The Ohio State University (OSU) James Comprehensive Cancer Center and 1 cell line derived from a patient at OSU (29). Some patients were enrolled in a CLL Research Consortium (CRC) research protocol and signed the CRC informed consent. Overall, these patients had both high white blood cell (WBC) counts and high percent lymphocytes (Table S1), with some cases having WBC count fewer than 20 × 109 per L. However, overall lower lymphocyte fraction did not compromise the ability of the Ig-ID pipeline to correctly determine IGH parameters (Table 1 and Table S2). PBMCs were lysed in TRIzol Reagent (Ambion) and RNA was extracted. Illumina paired-end cDNA libraries were constructed using oligo-dT enrichment and sequenced on a HiSEq. 2000 and 2500 instruments (Illumina) with an average of 26,131,000 91-nt reads per sample (range 23,549,000–27,700,000; Table S1) for the pilot set and 76,871,000 50-nt reads per sample (range 71,879,000–86,946,000) for the validation set.
Data Preprocessing.
Removal of sequencing adapter sequences and trimming bases of low-quality is recommended for most accurate de novo reconstruction of DNA or RNA (30). Reads were preprocessed to remove Illumina adapter contamination using scythe (https://github.com/ucdavis-bioinformatics/scythe), and the processed reads were subsequently quality-trimmed using the adaptive sliding-window quality trimmer sickle (https://github.com/ucdavis-bioinformatics/sickle) with settings “no 5’ trimming” and default quality and length thresholds (Q20; 20 nucleotides).
Genome Mapping and Counting.
Reads were mapped to GRCh37/hg19 with STAR 2.3.0e (31). Reads aligning to the IGH@ locus (with buffer, chr14:106,053,000–107,283,500) were extracted with bedtools (32). Ig V genes were identified from the Gencode project annotation version 17 (7), and the number of reads mapping to each V gene was counted with the HTSeq python library (www-huber.embl.de/users/anders/HTSeq/doc/overview.html) in exon-union mode. The V, D, and J gene with the highest count was determined to be the gene in use in the sequenced clonal population (Fig. S2).
De Novo Reconstruction.
To eliminate the effects of mapping bias, Ig transcripts were reconstructed using a genome-free method using the original set of all preprocessed, unmapped reads. Trinity software (6, 33) version r2013_08_14 was used to perform a de novo transcriptome reconstruction from each sample’s set of supplied reads. The putative transcriptome was reconstructed independently for each case, in contrast to the recommendation to pool multiple samples (33). Trinity was run in non-genome-guided mode with library strandedness specified (Illumina dUTP method:–SS_lib_type RF), minimum contig length 200, without Jaccard clipping, and without digital normalization.
Transcript Identification and Mapping.
From the reconstructed transcriptome derived from all reads, transcripts bearing homology to human V genes were identified with NCBI BLAST (34) using a custom database of V genes and pseudogenes downloaded from IMGT (35). A new reference transcriptome was constructed from these homologous transcripts and all reads were remapped to this reference with the bowtie2 short read aligner (36). Total, unique, and estimated read counts for each transcript were calculated with eXpress version 1.5.1 (37). The transcript with the highest estimated count was declared the winner. Transcripts having counts within one log of the highest expressed transcript were also compared with available clinical data.
IGHV Mutation Status.
The selected transcripts were input into IgBLAST (9) using the IMGT database (35), and data on V gene use and percent identity were compared with available IGHV data obtained by standard methods from the clinical laboratory.
Sequence Comparison.
IGH@ transcript sequences obtained from the clinical laboratory’s Sanger sequencer were aligned with the computed transcripts using Smith-Waterman and Clustal Omega (12, 38).
Supplementary Material
Acknowledgments
We thank the patients who provided samples for this study. This work was supported by Specialized Center of Research from the Leukemia and Lymphoma Society, P50 CA140158, P30 CA016058, P01 CA95426, P01 CA81534, P01 CA101956, and R01 CA177292 from the National Cancer Institute, the D. Warren Brown Foundation, Four Winds Foundation, and in part by an allocation of time from the Ohio Supercomputer Center.
Footnotes
The authors declare no conflict of interest.
Data deposition: The sequences reported in this paper have been deposited in the Gene Expression Omnibus database (accession no. GSE66228).
This article contains supporting information online at www.pnas.org/lookup/suppl/doi:10.1073/pnas.1503587112/-/DCSupplemental.
References
- 1.Hamblin TJ, Davis Z, Gardiner A, Oscier DG, Stevenson FK. Unmutated Ig V(H) genes are associated with a more aggressive form of chronic lymphocytic leukemia. Blood. 1999;94(6):1848–1854. [PubMed] [Google Scholar]
- 2.Damle RN, et al. Ig V gene mutation status and CD38 expression as novel prognostic indicators in chronic lymphocytic leukemia. Blood. 1999;94(6):1840–1847. [PubMed] [Google Scholar]
- 3.Mortazavi A, Williams BA, McCue K, Schaeffer L, Wold B. Mapping and quantifying mammalian transcriptomes by RNA-Seq. Nat Methods. 2008;5(7):621–628. doi: 10.1038/nmeth.1226. [DOI] [PubMed] [Google Scholar]
- 4.Wang Z, Gerstein M, Snyder M. RNA-Seq: A revolutionary tool for transcriptomics. Nat Rev Genet. 2009;10(1):57–63. doi: 10.1038/nrg2484. [DOI] [PMC free article] [PubMed] [Google Scholar]
- 5.Logan AC, et al. High-throughput VDJ sequencing for quantification of minimal residual disease in chronic lymphocytic leukemia and immune reconstitution assessment. Proc Natl Acad Sci USA. 2011;108(52):21194–21199. doi: 10.1073/pnas.1118357109. [DOI] [PMC free article] [PubMed] [Google Scholar]
- 6.Grabherr MG, et al. Full-length transcriptome assembly from RNA-Seq data without a reference genome. Nat Biotechnol. 2011;29(7):644–652. doi: 10.1038/nbt.1883. [DOI] [PMC free article] [PubMed] [Google Scholar]
- 7.Harrow J, et al. GENCODE: The reference human genome annotation for The ENCODE Project. Genome Res. 2012;22(9):1760–1774. doi: 10.1101/gr.135350.111. [DOI] [PMC free article] [PubMed] [Google Scholar]
- 8. Statistics about the current GENCODE freeze (version 19). Available at: www.gencodegenes.org/stats.html [Accessed June 13, 2014]
- 9.Ye J, Ma N, Madden TL, Ostell JM. IgBLAST: An immunoglobulin variable domain sequence analysis tool. Nucleic Acids Res. 2013;21(Web Server issue):W34–W40. doi: 10.1093/nar/gkt382. [DOI] [PMC free article] [PubMed] [Google Scholar]
- 10.Ghia P, et al. European Research Initiative on CLL ERIC recommendations on IGHV gene mutational status analysis in chronic lymphocytic leukemia. Leukemia. 2007;21(1):1–3. doi: 10.1038/sj.leu.2404457. [DOI] [PubMed] [Google Scholar]
- 11.Iglesia MD, et al. Prognostic B-cell signatures using mRNA-seq in patients with subtype-specific breast and ovarian cancer. Clin Cancer Res. 2014;20(14):3818–3829. doi: 10.1158/1078-0432.CCR-13-3368. [DOI] [PMC free article] [PubMed] [Google Scholar]
- 12.Smith TF, Waterman MS. Identification of common molecular subsequences. J Mol Biol. 1981;147(1):195–197. doi: 10.1016/0022-2836(81)90087-5. [DOI] [PubMed] [Google Scholar]
- 13.Rassenti LZ, Kipps TJ. Lack of allelic exclusion in B cell chronic lymphocytic leukemia. J Exp Med. 1997;185(8):1435–1445. doi: 10.1084/jem.185.8.1435. [DOI] [PMC free article] [PubMed] [Google Scholar]
- 14.Kern W, et al. Flow cytometric identification of 76 patients with biclonal disease among 5523 patients with chronic lymphocytic leukaemia (B-CLL) and its genetic characterization. Br J Haematol. 2014;164(4):565–569. doi: 10.1111/bjh.12652. [DOI] [PubMed] [Google Scholar]
- 15.Fais F, et al. Chronic lymphocytic leukemia B cells express restricted sets of mutated and unmutated antigen receptors. J Clin Invest. 1998;102(8):1515–1525. doi: 10.1172/JCI3009. [DOI] [PMC free article] [PubMed] [Google Scholar]
- 16.Kienle D, et al. Distinct gene expression patterns in chronic lymphocytic leukemia defined by usage of specific VH genes. Blood. 2006;107(5):2090–2093. doi: 10.1182/blood-2005-04-1483. [DOI] [PubMed] [Google Scholar]
- 17.Kröber A, et al. Additional genetic high-risk features such as 11q deletion, 17p deletion, and V3-21 usage characterize discordance of ZAP-70 and VH mutation status in chronic lymphocytic leukemia. J Clin Oncol. 2006;24(6):969–975. doi: 10.1200/JCO.2005.03.7184. [DOI] [PubMed] [Google Scholar]
- 18.Fält S, et al. Distinctive gene expression pattern in VH3-21 utilizing B-cell chronic lymphocytic leukemia. Blood. 2005;106(2):681–689. doi: 10.1182/blood-2004-10-4073. [DOI] [PubMed] [Google Scholar]
- 19.Chen S-S, et al. Autoantigen can promote progression to a more aggressive TCL1 leukemia by selecting variants with enhanced B-cell receptor signaling. Proc Natl Acad Sci USA. 2013;110(16):E1500–E1507. doi: 10.1073/pnas.1300616110. [DOI] [PMC free article] [PubMed] [Google Scholar]
- 20.Hoogeboom R, et al. A mutated B cell chronic lymphocytic leukemia subset that recognizes and responds to fungi. J Exp Med. 2013;210(1):59–70. doi: 10.1084/jem.20121801. [DOI] [PMC free article] [PubMed] [Google Scholar]
- 21.Hervé M, et al. Unmutated and mutated chronic lymphocytic leukemias derive from self-reactive B cell precursors despite expressing different antibody reactivity. J Clin Invest. 2005;115(6):1636–1643. doi: 10.1172/JCI24387. [DOI] [PMC free article] [PubMed] [Google Scholar]
- 22.Visco C, et al. Immune thrombocytopenia in patients with chronic lymphocytic leukemia is associated with stereotyped B-cell receptors. Clin Cancer Res. 2012;18(7):1870–1878. doi: 10.1158/1078-0432.CCR-11-3019. [DOI] [PubMed] [Google Scholar]
- 23.Hadzidimitriou A, et al. Is there a role for antigen selection in mantle cell lymphoma? Immunogenetic support from a series of 807 cases. Blood. 2011;118(11):3088–3095. doi: 10.1182/blood-2011-03-343434. [DOI] [PubMed] [Google Scholar]
- 24.Pighi C, Barbi S, Bertolaso A, Zamò A. Mantle cell lymphoma cell lines show no evident immunoglobulin heavy chain stereotypy but frequent light chain stereotypy. Leuk Lymphoma. 2013;54(8):1747–1755. doi: 10.3109/10428194.2012.758843. [DOI] [PubMed] [Google Scholar]
- 25.Arons E, Suntum T, Stetler-Stevenson M, Kreitman RJ. VH4-34+ hairy cell leukemia, a new variant with poor prognosis despite standard therapy. Blood. 2009;114(21):4687–4695. doi: 10.1182/blood-2009-01-201731. [DOI] [PMC free article] [PubMed] [Google Scholar]
- 26.Wu D, et al. High-throughput sequencing detects minimal residual disease in acute T lymphoblastic leukemia. Sci Transl Med. 2012;4(134):134ra63. doi: 10.1126/scitranslmed.3003656. [DOI] [PubMed] [Google Scholar]
- 27.Faham M, et al. Deep-sequencing approach for minimal residual disease detection in acute lymphoblastic leukemia. Blood. 2012;120(26):5173–5180. doi: 10.1182/blood-2012-07-444042. [DOI] [PMC free article] [PubMed] [Google Scholar]
- 28.Logan AC, et al. Minimal residual disease quantification using consensus primers and high-throughput IGH sequencing predicts post-transplant relapse in chronic lymphocytic leukemia. Leukemia. 2013;27(8):1659–1665. doi: 10.1038/leu.2013.52. [DOI] [PMC free article] [PubMed] [Google Scholar]
- 29.Hertlein E, et al. Characterization of a new chronic lymphocytic leukemia cell line for mechanistic in vitro and in vivo studies relevant to disease. PLoS ONE. 2013;8(10):e76607. doi: 10.1371/journal.pone.0076607. [DOI] [PMC free article] [PubMed] [Google Scholar]
- 30.Del Fabbro C, Scalabrin S, Morgante M, Giorgi FM. An extensive evaluation of read trimming effects on Illumina NGS data analysis. PLoS ONE. 2013;8(12):e85024. doi: 10.1371/journal.pone.0085024. [DOI] [PMC free article] [PubMed] [Google Scholar]
- 31.Dobin A, et al. STAR: Ultrafast universal RNA-seq aligner. Bioinformatics. 2013;29(1):15–21. doi: 10.1093/bioinformatics/bts635. [DOI] [PMC free article] [PubMed] [Google Scholar]
- 32.Quinlan AR, Hall IM. BEDTools: A flexible suite of utilities for comparing genomic features. Bioinformatics. 2010;26(6):841–842. doi: 10.1093/bioinformatics/btq033. [DOI] [PMC free article] [PubMed] [Google Scholar]
- 33.Haas BJ, et al. De novo transcript sequence reconstruction from RNA-seq using the Trinity platform for reference generation and analysis. Nat Protoc. 2013;8(8):1494–1512. doi: 10.1038/nprot.2013.084. [DOI] [PMC free article] [PubMed] [Google Scholar]
- 34.Altschul SF, Gish W, Miller W, Myers EW, Lipman DJ. Basic local alignment search tool. J Mol Biol. 1990;215(3):403–410. doi: 10.1016/S0022-2836(05)80360-2. [DOI] [PubMed] [Google Scholar]
- 35.Giudicelli V, Chaume D, Lefranc M-P. IMGT/GENE-DB: A comprehensive database for human and mouse immunoglobulin and T cell receptor genes. Nucleic Acids Res. 2005;33(Database issue):D256–D261. doi: 10.1093/nar/gki010. [DOI] [PMC free article] [PubMed] [Google Scholar]
- 36.Langmead B, Salzberg SL. Fast gapped-read alignment with Bowtie 2. Nat Methods. 2012;9(4):357–359. doi: 10.1038/nmeth.1923. [DOI] [PMC free article] [PubMed] [Google Scholar]
- 37.Roberts A, Pachter L. Streaming fragment assignment for real-time analysis of sequencing experiments. Nat Methods. 2013;10(1):71–73. doi: 10.1038/nmeth.2251. [DOI] [PMC free article] [PubMed] [Google Scholar]
- 38.Sievers F, et al. 2011. Fast, scalable generation of high-quality protein multiple sequence alignments using Clustal Omega. Mol Syst Biol 7(1):539 msb.embopress.org/content/7/1/539.
Associated Data
This section collects any data citations, data availability statements, or supplementary materials included in this article.