

Significance
Across western North America, abundant susceptible pine hosts and a suitable climate during the early 21st century have promoted widespread mountain pine beetle (MPB) outbreaks, leading to concern that dead fuels may increase wildfire risk. The assumption that outbreaks raise fire risk is driving far-reaching policy decisions involving expenditures of hundreds of millions of dollars. Contrary to the expectation that an MPB outbreak increases fire risk, spatial overlay analysis shows no effect of outbreaks on subsequent area burned during years of extreme burning across the West. These results refute the assumption that increased bark beetle activity has increased area burned; therefore, policy discussions should focus on societal adaptation to the effects of the underlying drivers: warmer temperatures and increased drought.
Keywords: wildfire, bark beetle, disturbance interactions, lodgepole pine, Dendrocotnus ponderosae
Abstract
In the western United States, mountain pine beetles (MPBs) have killed pine trees across 71,000 km2 of forest since the mid-1990s, leading to widespread concern that abundant dead fuels may increase area burned and exacerbate fire behavior. Although stand-level fire behavior models suggest that bark beetle-induced tree mortality increases flammability of stands by changing canopy and forest floor fuels, the actual effect of an MPB outbreak on subsequent wildfire activity remains widely debated. To address this knowledge gap, we superimposed areas burned on areas infested by MPBs for the three peak years of wildfire activity since 2002 across the western United States. Here, we show that the observed effect of MPB infestation on the area burned in years of extreme fire appears negligible at broad spatial extents. Contrary to the expectation of increased wildfire activity in recently infested red-stage stands, we found no difference between observed area and expected area burned in red-stage or subsequent gray-stage stands during three peak years of wildfire activity, which account for 46% of area burned during the 2002–2013 period. Although MPB infestation and fire activity both independently increased in conjunction with recent warming, our results demonstrate that the annual area burned in the western United States has not increased in direct response to bark beetle activity. Therefore, policy discussions should focus on societal adaptation to the effects of recent increases in wildfire activity related to increased drought severity.
Predicting the consequences of climate change on ecosystems is one of the greatest challenges for contemporary ecology. The effects of climate change on disturbances, including fire and insect outbreaks, is expected to greatly exceed the effects of warming on more gradual forest change processes, such as tree physiology and tree reproductive success (1). Despite the potential for climate change to drive dramatic ecological change by altering rates, extents, and severities of disturbances, the effects of warming on forest disturbances, particularly how disturbances may interact under novel climate conditions, are poorly understood (2).
During the early 21st century, warm and dry conditions, coupled with abundant susceptible tree hosts, have led to increased populations of mountain pine beetles (MPBs; Dendroctonus ponderosae Hopkins). Over the 2000–2013 period, the MPB has caused tree mortality over 71,000 km2 of pine forest across the western United States (Fig. 1 A and B). Tree mortality caused by outbreaks of forest insects can dramatically alter ecosystems, leading to changes in timber resources; carbon sequestration (3); habitat quality (4); hydrology (5); and the likelihood or severity of subsequent disturbance, including wildfire (6, 7). To mediate the consequences of insect-induced tree mortality, the 2014 Farm Bill authorized $200 million to reduce the risk of insect outbreak, disease, and subsequent wildfire across 18 Mha of National Forest lands designated as landscape-scale insect and disease areas (8).
Fig. 1.

Major wildland fires in 2006, 2007, and 2012 that intersect MPB hosts and cumulative MBP infestation in 2000–2013 across the western United States. (A) Extent of all pine hosts of MPBs (green), cumulative 2000–2013 MPB infestation (dark gray), and major wildland fires (>405 ha) that burned in 2006, 2007, or 2012 (red) and intersected MPB hosts (n = 546 fires). The fire area reflects the entire area burned, inclusive of MPB pine hosts and other cover types. Photographs of red-stage MPB infestation in ponderosa pine (B) and gray-stage infestation in lodgepole pine (C) are shown.
The MPB is one of the most destructive forest insects in North America, and during outbreaks, high levels of tree mortality occur across large landscapes. The MPB inhabits the inner bark and feeds on the tree’s phloem tissues. Heavy colonization and reproduction within the inner bark interrupt the flow of water and nutrients throughout the tree and typically cause tree death. Endemic populations usually infest weakened trees. Initially, beetles selectively attack relatively large-diameter trees in dense stands, but as beetle populations increase, a wide range of tree sizes become susceptible to attack (9). Although the MPB feeds upon several pine species (10), most of the recent tree mortality has occurred in lodgepole pine and ponderosa pine forests (Fig. 2B). Outbreaks occur as beetle populations grow, typically in response to favorable effects of warmer temperatures on beetle population growth and drought stress in host trees (9, 11). Large and severe outbreaks of MPBs are also dependent on an abundance of susceptible host trees (9). The role of fire suppression in creating more homogeneous forest structures favorable to MPB outbreaks is debated and is likely to be different for forests types characterized by natural fire regimes of predominantly frequent surface fires vs. infrequent large stand-replacing fires (10, 12).
Fig. 2.

Annual area burned by wildfires and cumulative area infested by MPBs (2002–2013) across the western United States in primarily ponderosa pine (light green), mixed ponderosa and lodgepole pine (gold), primarily lodgepole pine (dark green), other MPB hosts (dark brown), and non-MPB hosts (light gray). (A) Annual area burned, calculated from the MTBS fire perimeter dataset. (B) Cumulative area infested by MPBs, determined from US Forest Service ADS data. For each year, ADS polygon data were converted to grids of 990 × 990-m pixels and cross-validated with a corresponding map of the distribution of MPB hosts. (C) Annual area burned in the cumulative area infested by MPBs.
MPB-induced tree mortality is hypothesized to affect fire behavior by altering the flammability, continuity, and structure of fuels (6, 7). The surface, ladder, and crown fuels (collectively, the fuel profile) are expected to change with time since outbreak, potentially altering fire behavior and fire risk. Initially following tree death, needles fade to red (red stage; Fig. 1B) and risks of ignition, torching, and canopy fire are expected to increase due to lower leaf moisture content and decreases in nonfiber carbohydrates and fats, which increase flammability (13, 14). About 3 y following attack, trees drop their needles and twigs and become exposed in the upper crown (6) (gray stage; Fig. 1C). At this time, forest floor fuels are expected to increase due to falling needles, branches, and/or the rapid growth of shrubs and understory trees into ladder fuels (6, 7). During this time period, many stand-scale, fuel-driven fire behavior models predict a decreased risk of crown fire due to lower canopy bulk density and decreased continuity of canopy fuels (6, 7). However, field-based studies suggest that understory trees may also serve as ladder fuels to carry fire into the crowns (15), leading to an expectation that surface fires will be more likely to spread into the canopy during the gray stage.
Whereas MPB infestation alters fuels and, as suggested by stand-level fire behavior models (e.g., NEXUS, BehavePlus, FARSITE, FlamMAP), changes fire behavior (7, 16–19), it is unclear if these fuel alterations lead to observed increases in area burned across heterogeneous landscapes (6, 7). Retrospective field studies of the effect of prefire MPB outbreaks on fire severity have shown little to no effect (20–23). In addition, the observed effects of prefire outbreaks on fire occurrence appear to be varied or negligible (24, 25). Instead, retrospective field studies indicate fire occurrence and severity are more strongly associated with other drivers of fire behavior, including elevation, slope, cover type, and stand structure (19–21, 24).
The apparent disagreement between stand-level fire behavior models and field case studies arises from (i) mechanistic and spatial limitations of the models and dependence on simulated weather scenarios and (ii) confounding factors in empirical case studies, where the effect of MPB infestation on fire covaries with initial forest conditions and weather (20, 22). Furthermore, at a landscape scale, both wildfire and the initiation of an MPB outbreak are associated with extreme drought, complicating detection of any potential synergy between these disturbances. These uncertainties highlight the need for a comprehensive broad-scale analysis of the observed effects of bark beetle outbreaks on subsequent wildfire.
To determine if MPB infestation affects area burned at a broad spatial extent, we analyzed spatial data of MPB infestation and area burned across the western United States (exclusive of Alaska) (Materials and Methods). We examined the area burned in MPB host forests during the 3 y of greatest annual area burned between 2002 and 2013, which, combined, are responsible for 46% of the total area burned in the West during the 12-y period (Fig. 2). During these years (2006, 2007, and 2012), 546 fires (>405 ha each) burned in both infested and uninfested MPB host forests.
Results
Across the western United States, the total annual area burned did not increase during the steep rise in cumulative area of MPB infestation from 2000 to 2013 (Fig. 2 A and B). Similarly, there was no increase in the annual area burned in any MPB host cover type (Fig. 2A). During the three peak fire years of 2006, 2007, and 2012, 101,005 km2 burned across the western United States. Only 30% of this burning occurred in MPB host cover types (30,295 km2; Fig. 2A), and only 5% of the area burned had experienced recent (2000–2013) MPB infestation (5,239 km2; Fig. 2C). Although the total area burned across the western United States has not consistently increased in response to increased MPB infestation, the greatest area of burned MPB infestation occurred in 2012, in areas of extensive MPB outbreaks in Colorado, Idaho, and Montana. However, other areas of widespread MPB infestation, such as north-central Colorado, have not subsequently burned (Fig. 1). In contrast to 2012, the 2013 area of MPB infestation burned was very low (>0.5% of the area infested by MPBs burned; Fig. 2C).
Spatial overlay analyses show that area burned was similar regardless of the presence or absence of MPB infestation (Fig. 3). Across all MPB hosts, the difference between observed and expected area burned was equal to or less than 1% (Fig. 3A). Although fuel models suggest that red-stage MPB infestation may increase wildfire activity (6), we found no difference between observed area and expected area burned in red-stage MPB infestation. In addition, the area of gray-stage MPB infestation burned was similar to the expected area burned of gray-stage infestation (Fig. 3A). These results did not depend on host cover type (Fig. 3) or fire year (Fig. 4 and Figs. S1–S3).
Fig. 3.

Observed and expected (assuming no effect of MPBs) areas burned in forests with red-stage and gray-stage MPB infestation in all pine hosts (A), lodgepole pine (B), mixed lodgepole and ponderosa pine (C), and ponderosa pine (D) for the 2006, 2007, and 2012 fire years combined. Red-stage and gray-stage infestations are defined as the cumulative area affected by new infestation within 3 y of the fire and greater than 3 y of the fire, respectively. Dark gray bars indicate the observed area burned in each MPB host cover type. Observed distributions were generated by overlaying the area burned in 2006, 2007, and 2012 with maps of MPB infestation stage in each of those years. Light gray bars indicate the expected area burned in each stage of MPB infestation. Expected distributions were generated by calculating the proportion of the landscape in each stage of MPB infestation and multiplying it by the area burned in that landscape. The difference between observed and expected values, represented as the difference in the percent area expected, is shown above each pair of bars. Positive percentages indicate that the observed area burned was greater than expected in that class of MPB infestation. As explained in Materials and Methods, percentages greater than ∼15% signify dependence of a fire area on MPB infestation.
Fig. 4.
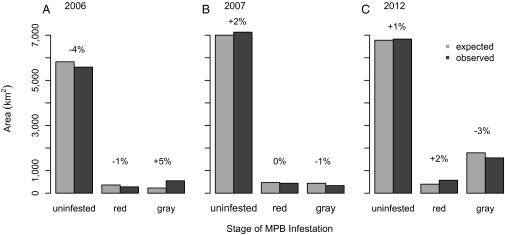
Observed and expected (assuming no effect of MPBs) areas burned in forests with red-stage and gray-stage MPB infestation in 2006 (A), 2007 (B), and 2012 (C) for all host cover types combined. Red-stage and gray-stage infestations are defined as the cumulative area affected by new infestation within 3 y of the fire and greater than 3 y of the fire, respectively. Dark gray bars indicate the observed area burned in each MPB host cover type. Observed distributions were generated by overlaying the annual area burned with maps of MPB infestation stage in each of those years. Light gray bars indicate the expected area burned in each stage of MPB infestation. Expected distributions were generated by calculating the proportion of the landscape in each stage of MPB infestation and multiplying it by the area burned in that landscape. The difference between observed and expected values, represented as the difference in the percent area expected, is shown above each pair of bars. Positive percentages indicate that the observed area burned was greater than expected in that class of MPB infestation. As explained in Materials and Methods, percentages greater than ∼15% signify dependence of a fire area on MPB infestation.
Results from the spatial overlay analysis were similar using 10% and 25% MPB forest damage by area thresholds (Fig. 3 and Fig. S4). Independent of these two minimum thresholds for defining pixels of MPB infestation, area burned was similar regardless of the presence or absence of MPB infestation, where the difference between observed area and expected area burned was equal to or less than 5% (Fig. S4). These results are consistent with and support our conclusion that fire area is unaffected by MPB infestation.
Discussion
Despite the widespread public perception that forests affected by recent MPB outbreaks are more likely to burn (26, 27), we find that the annual area burned across the western United States is unaffected by MPB infestation. Our results show that the area burned in red-stage and/or gray-stage MPB infestation during the three peak years of widespread fire following a widespread MPB outbreak was equivalent to the expected area burned independent of MPB activity. Previous research shows MPB infestation can affect fuels and model-simulated fire behavior (13, 14, 16–19); however, the strength and direction of the relationship depend on weather, outbreak severity, synchrony of infestation, preoutbreak fuels, forest type, and time since outbreak.
The emergent effect of MPB infestation on the area burned in years of extreme fire appears negligible at broad spatial extents, perhaps due to fine-scale heterogeneity in infestation severity and stage or overriding effects of topography and fire weather on occurrence and patterns of burning. For example, fire weather strongly influences fire severity (20, 21), fire occurrence (28), fire intensity (29), fire spread (30), fire ignition (31), and crown fire behavior (16, 18), especially in high-elevation lodgepole pine forests. However, during extreme fire weather that promotes high fire activity in the western United States (32), fuels are likely dry enough to promote extensive burning regardless of alterations to fuels due to MPB infestation.
The MPB is the primary agent of bark beetle-induced mortality across the western United States; MPB-attributed mortality accounts for 63% of the area affected by bark beetles over the 1997–2010 period (33). Because our analysis does not account for tree mortality caused by other bark beetles primarily attacking tree species other than MPB hosts, within the infested area of MPB hosts, there may have been mortality from other bark beetles that potentially could have affected subsequent area burned. However, across the western United States, these other bark beetles are responsible for less than 17% of the bark beetle-attributed mortality over the 1997–2010 period (33), and therefore would have a relatively small potential effect on subsequent area burned.
Our analysis included a single parameter: fire extent (area burned). It did not examine MPB effects on other fire behavior parameters, such as fire severity. However, given the importance of a perceived increase in area burned due to MPB-caused tree mortality to fire policy, with major implications for national and local government financial resources as well as environmental consequences of fire mitigation practices, the focus on area burned is clearly appropriate for the objectives of our study. We note, however, that under moderate burning conditions, stand-scale fire behavior models predict that MPB alterations to fuel complexes result in increased fire severity (18, 21). Nevertheless, there is no currently available assessment of the effects of MPB outbreaks on fire severity across the entire western United States analogous to our assessment based on area burned.
Although bark beetle outbreaks have increased in conjunction with recent climate warming (9) and, similarly, a rise in fire activity is correlated with increased drought severity (32), the annual area burned in the western United States has not increased in direct response to bark beetle outbreaks. Although tree removal to reduce tree-fall risks to homes, recreational sites, and communication and power infrastructures is clearly justified, MPB infestation has not fundamentally altered the risk of burning. Nevertheless, we note that the effects of beetle outbreaks on other measures of fire behavior, most importantly, fire intensity and crowning behavior, may be important and clearly warrant caution from a fire-fighter safety perspective. Recognition of the potential for unanticipated fire behavior at a stand scale due to MPB-induced tree mortality is essential for fire-fighter safety (7). At a macroscale in the western United States, however, our results refute the assumption that increased bark beetle activity has increased area burned; therefore, policy discussions should focus on societal adaptation to the effects of the increasingly important driving factor: climate warming.
Materials and Methods
Data.
To determine the area of susceptible hosts for MPB infestation, we acquired data on forest cover type from LANDFIRE (34), the Gap Analysis Program project (35), and the National Atlas of the United States, which provides spatial data on land cover produced from Advanced Very High Resolution Radiometer (AVHRR) data (36) (Table 1). Most vegetation cover-type datasets express only moderate overall agreement between field plot data and forest cover type at a 30 × 30-m spatial scale (40–60%) (37, 38); hence, we combined datasets conservatively for a more robust cover-type classification (below). We also acquired spatial data on forest disturbance, including the areas of forest treatment (clear-cutting, harvest, thinning, mastication, and other mechanical treatments), fire, and MPB infestation (Table 1). Data on forest treatment (1999–2010) were obtained from the LANDFIRE Disturbance layer, which provides spatial information on forest cover change from satellite imagery and forest managers (34). Annual burned areas and fire perimeters (1984–2013) were obtained from Monitoring Trends in Burn Severity (MTBS), which uses satellite imagery to map fire severity and extent (39). To ensure high spatial precision, MTBS analysts digitize fire perimeters on-screen at display scales between 1:24,000 and 1:50,000 and use incident perimeters (40). Finally, we acquired spatial data on MPB infestation from United States Forest Service aerial detection surveys (ADSs) (41) (Table 1). Data on MPB infestation was acquired for the contiguous western United States. Alaska was excluded from our analysis because the MPB is limited to latitudes south of 56° N (42). Accuracy assessments between ADSs and ground references for MPB infestation in the lodgepole pine show increasing agreement as spatial grain increases (e.g., 70% agreement at a 30-m scale and 87% agreement at a 500-m scale), indicating that ADSs are appropriate for assessing coarse-grain trends in forest disturbance (43).
Table 1.
Geospatial data layers
| Variable | Description | Type | Year | Resolution |
| 1. Forest cover data | ||||
| LANDFIRE | Existing vegetation type, based on NatureServe’s ecological systems classification | Raster | 2013 | 30 × 30 m |
| Existing vegetation type class (22) | ||||
| Gap Analysis Program | Ecological system, based on NatureServe’s ecological systems classification | Raster | 1999–2001 | 30 × 30 m |
| Ecological system (23) | ||||
| Forest cover type (24) | Primary forest-type group | Raster | 1994 | 1 × 1 km |
| 2. Disturbance data | ||||
| Aerial detection survey damage causal agent (36) | Primary pest or pathogen causing damage | Polygon | 2000–2012 | Compiled at 1:100,000 scale |
| LANDFIRE | Primary disturbance agent | Raster | 1999–2010 | 30 × 30 m |
| Disturbance type (22) | ||||
| National MTBS burned area boundaries (27) | Historic fire perimeters | Polygon | 1984–2012 | Compiled at 1:24,000–1:50,000 scale |
Spatial Analysis.
All spatial analyses were implemented in R (44) at a spatial resolution of 990 × 990 m, which approximates a stand scale (45). We examined the area burned in MPB host forests during the 3 y of greatest annual area burned between 2002 and 2013, which, combined, are responsible for 46% of the total area burned in the West during the 12-y period (Fig. 2). To do so, annual maps of fire area were converted to 990 × 990-m rasters. Each 990 × 990-m pixel was classified as burned if ≥10% of the area in the pixel was burned in that year. During the 3 y of greatest annual burned between 2002 and 2013 (2006, 2007, and 2012), 546 fires (>405 ha) burned in both infested and uninfested MPB host forests.
Next, we rasterized annual (2000–2013) ADS polygon data that listed the MPB as the primary agent of forest damage (11). We converted ADS data to the presence or absence of MPBs, rather than severity, because ADS estimates of severity of infestation are highly inaccurate [e.g., estimates of 1997–2010 bark beetle mortality across the contiguous western United States ranged from 404–5,872 million trees (33)]. Therefore, we classified each 990 × 990-m pixel with ≥10% MPB forest damage by area as infested. We selected a low threshold for identifying MPB-infested stands as a more rigorous test of the null hypothesis of no effect of MPB infestation on subsequent area burned. As such, there was still only a 30% overlap between MPB-infested area and subsequent area burned. Furthermore, although a low threshold was used to determine the presence of MPB infestation, most pixels were characterized by a higher percentage of MPB forest damage. Across all years, the mean percentage of MPB forest damage by area was 45% (SD = 29).
Annual rasters of MPB infestation were converted to rasters listing new infestations (i.e., the first time a pixel was mapped as infested by MPBs). For each fire year, we then created rasters of MPB stage. Given that ADS data typically miss the initial year of infestation (10, 33, 34), because needles have not turned color yet (6), red-stage infestation was listed as any pixel listing a new infestation within the year of the observation or 2 y previous. About 15–20 y following initial infestation, stands infested by MPBs are expected to transition from gray-stage infestation to old-stage infestation, which is characterized by snag fall (6). Thus, gray-stage infestation was listed as any pixel recording infestation within 3 to 15 y before burning.
Areas of susceptible but not infested MPB hosts were created by first defining the spatial cover of MPB hosts. For each vegetation dataset, we listed the presence of an MPB host within a 990 × 990-m pixel where ≥10% of the pixel area was covered by an MPB host. Given that vegetation cover-type maps exhibit classification errors, datasets were combined conservatively where the presence of an MPB host in two or more datasets indicated its presence (45). Given that an MPB outbreak is not expected to occur in young postfire stands or in stands recently logged, we masked out areas with any logging disturbance, derived from the LANDFIRE Disturbance layer, or previous burning before each fire year. Finally, the raster of susceptible MPB hosts was multiplied by the MPB infestation raster to produce a cross-validated map of red-stage, gray-stage, and not infested forest (11). This process was conducted for all susceptible MPB hosts (lodgepole pine, ponderosa pine, western white pine, sugar pine, and limber pine), just lodgepole pine forests, and just ponderosa pine forests (Table S1).
Analytical Methods.
The effect of MPB infestation on subsequent area burned was assessed using a spatial overlay approach, where the observed areas of all stages of MPB infestation (not infested, red stage, and gray stage) that occurred in burned areas were calculated (46, 47). The spatial overlay analysis tabulates the total area of the dependent variable (fire) that occurs in each class of the independent variable (MPB infestation). This observed area burned was compared with the expected area burned in each class of MPB infestation, which is proportional to the total area in each class of MPB infestation. If the independent variable does not affect the area burned, then the observed area burned should reflect the expected distribution of MPB infestation stages. A positive departure of the observed area and expected area burned indicates a dependency of the area burned on the respective class of MPB infestation. Our spatial overlays assessed entire populations and not just samples. Thus, all deviations between observed and expected are viewed as real differences between the datasets, and statistical tests are not necessary. However, given that our spatial datasets exhibit moderate classification errors that vary with spatial grain as well as forest cover type (43), we conservatively assumed that only differences greater than ∼15% would be meaningful.
We performed spatial overlays for each of the 3 y (2006, 2007, and 2012) separately. To summarize the effect of MPB infestation on subsequent fire area, we summed the areas observed in 2006, 2007, and 2012 for each stage of MPB infestation. The expected area was generated by summing the areas observed in 2006, 2007, and 2012 for each stage of MPB infestation that occurred in MPB host forests across the western United States. Overlays were performed for all MPB hosts combined (Fig. 1A), and separately for lodgepole pine, ponderosa pine cover types, and mixed lodgepole and ponderosa pine stands (Table S1). Results for different cover types in individual years are available in Figs. S1–S3. To determine if our results were affected by the 10% MPB forest damage by area threshold used to determine the presence or absence of an MPB outbreak, we repeated the spatial overlay analyses where all 990 × 990-m pixels with ≥25% MPB forest damage by area were classified as infested.
Supplementary Material
Acknowledgments
We thank the United States Forest Service for ADS data, the United States Geological Survey for forest cover data, and two anonymous reviewers for helpful comments. This research was supported by the Wilburforce Foundation (Grant UNIVE1303) and the National Science Foundation (Award 1262687).
Footnotes
The authors declare no conflict of interest.
This article is a PNAS Direct Submission.
This article contains supporting information online at www.pnas.org/lookup/suppl/doi:10.1073/pnas.1424037112/-/DCSupplemental.
References
- 1.Ayres MP, et al. In: Disturbance Regimes and Stressors. Climate Change and United States Forests, Advances in Global Change Research. Peterson DL, Vose JM, Patel-Weynand T, editors. Springer; Dordrecht, The Netherlands: 2014. pp. 55–92. [Google Scholar]
- 2.Turner MG. Disturbance and landscape dynamics in a changing world. Ecology. 2010;91(10):2833–2849. doi: 10.1890/10-0097.1. [DOI] [PubMed] [Google Scholar]
- 3.Kurz WA, et al. Mountain pine beetle and forest carbon feedback to climate change. Nature. 2008;452(7190):987–990. doi: 10.1038/nature06777. [DOI] [PubMed] [Google Scholar]
- 4.Saab VA, et al. Ecological consequences of mountain pine beetle outbreaks for wildlife in western North American forests. Forest Science. 2014;60(3):539–559. [Google Scholar]
- 5.Bearup LA, Maxwell RM, Clow DW, McCray JE. Hydrological effects of forest transpiration loss in bark beetle-impacted watersheds. Nat Clim Change. 2014;4:481–486. [Google Scholar]
- 6.Hicke JA, Johnson MC, Hayes JL, Preisler HK. Effects of bark beetle-caused tree mortality on wildfire. For Ecol Manage. 2012;271:81–90. [Google Scholar]
- 7.Jenkins MJ, Runyon JB, Fettig CJ, Page WG, Bentz BJ. Interactions among the mountain pine beetle, fires, and fuels. Forest Science. 2014;60(3):489–501. [Google Scholar]
- 8. Agricultural Act of 2014, Public Law 113–791, Sect. 8204 (2014)
- 9.Raffa KF, et al. Cross-scale drivers of natural disturbances prone to anthropogenic amplification: The dynamics of bark beetle eruptions. Bioscience. 2008;58(6):501–517. [Google Scholar]
- 10.Taylor SW, Carroll AL. Mountain Pine Beetle Symposium: Challenges and Solutions, Information Report BC-X-399. Natural Resources Canada, Canadian Forest Service, Pacific Forestry Centre; Victoria, BC, Kelowna, BC, Canada: 2004. Disturbance, forest age, and mountain pine beetle outbreak dynamics in BC: A historical perspective; pp. 41–51. [Google Scholar]
- 11.Chapman TB, Veblen TT, Schoennagel T. Spatiotemporal patterns of mountain pine beetle activity in the southern Rocky Mountains. Ecology. 2012;93(10):2175–2185. doi: 10.1890/11-1055.1. [DOI] [PubMed] [Google Scholar]
- 12.Romme WH, et al. Recent Forest Insect Outbreaks and Fire Risk in Colorado Forests: A Brief Synthesis of Relevant Research. Colorado Forest Restoration Institute; Fort Collins, CO: 2006. [Google Scholar]
- 13.Jolly WM, et al. Relationships between moisture, chemistry, and ignition of Pinus contorta needles during the early stages of mountain pine beetle attack. For Ecol Manage. 2012;269:52–59. [Google Scholar]
- 14.Page WG, Jenkins MJ, Runyon JB. Mountain pine beetle attack alters the chemistry and flammability of lodgepole pine foliage. Can J Res. 2012;42(8):1631–1647. [Google Scholar]
- 15.Collins BJ, Rhoades CC, Battaglia MA, Hubbard RM. The effects of bark beetle outbreaks on forest development, fuel loads and potential fire behavior in salvage logged and untreated lodgepole pine forests. For Ecol Manage. 2012;284:260–268. [Google Scholar]
- 16.Schoennagel T, Veblen TT, Negron JF, Smith JM. Effects of mountain pine beetle on fuels and expected fire behavior in lodgepole pine forests, Colorado, USA. PLoS ONE. 2012;7(1):e30002. doi: 10.1371/journal.pone.0030002. [DOI] [PMC free article] [PubMed] [Google Scholar]
- 17.Hoffman CM, Morgan P, Mell W, Parsons R, Strand E, Cook S. Surface fire intensity influences simulated crown fire behavior in lodgepole pine forests with recent mountain pine beetle-caused tree mortality. Forest Science. 2013;59(4):390–399. [Google Scholar]
- 18.Simard M, Romme WH, Griffin JM, Turner MG. Do mountain pine beetle outbreaks change the probability of active crown fire in lodgepole pine forests? Ecol Monogr. 2011;81(1):3–24. [Google Scholar]
- 19.Page W, Jenkins MJ. Predicted fire behavior in selected mountain pine beetle-infested lodgepole pine. Forest Science. 2007;53(6):662–674. [Google Scholar]
- 20.Harvey BJ, Donato DC, Turner MG. Recent mountain pine beetle outbreaks, wildfire severity, and postfire tree regeneration in the US Northern Rockies. Proc Natl Acad Sci USA. 2014;111(42):15120–15125. doi: 10.1073/pnas.1411346111. [DOI] [PMC free article] [PubMed] [Google Scholar]
- 21.Harvey BJ, Donato DC, Romme WH, Turner MG. Fire severity and tree regeneration following bark beetle outbreaks: The role of outbreak stage and burning conditions. Ecol Appl. 2014;24(7):1608–1625. doi: 10.1890/13-1851.1. [DOI] [PubMed] [Google Scholar]
- 22.Turner MG, Romme WH, Gardner RH. Prefire heterogeneity, fire severity, and early postfire plant reestablishment in subalpine forests of Yellowstone National Park, Wyoming. International Journal of Wildland Fire. 1999;9(1):21–36. [Google Scholar]
- 23.Bond ML, Lee DE, Bradley CM, Hanson CT. Influence of pre-fire tree mortality on fire severity in conifer forests of the San Bernardino Mountains, California. The Open Forest Science Journal. 2009;2:41–47. [Google Scholar]
- 24.Lynch HJ, Renkin RA, Crabtree RL, Moorcroft PR. The influence of previous mountain pine beetle (Dendroctonus ponderosae) activity on the 1988 Yellowstone fires. Ecosystems. 2006;9(8):1318–1327. [Google Scholar]
- 25.Kulakowski D, Jarvis D. The influence of mountain pine beetle outbreaks and drought on severe wildfires in northwestern Colorado and southern Wyoming: A look at the past century. For Ecol Manage. 2011;262(9):1686–1696. [Google Scholar]
- 26.Finley B. June 22, 2013 West Fork fire complex in Colorado feeding on beetle-ravaged forests. Denver Post. Available at www.denverpost.com/ci_23518316/winds-shift-west-fork-fire-northwest-toward-creede. Accessed June 23, 2013.
- 27.Massey N. June 20, 2012. High Park fire follows in pine beetles’ tracks. ClimateWire.
- 28.Schoennagel T, Veblen TT, Kulakowski D, Holz A. Multidecadal climate variability and climate interactions affect subalpine fire occurrence, western Colorado (USA) Ecology. 2007;88(11):2891–2902. doi: 10.1890/06-1860.1. [DOI] [PubMed] [Google Scholar]
- 29.Bessie WC, Johnson EA. The relative importance of fuels and weather on fire behavior in subalpine forests. Ecology. 1995;76(3):747–762. [Google Scholar]
- 30.Coen JL. Simulation of the Big Elk Fire using coupled atmosphere–fire modeling. International Journal of Wildland Fire. 2005;14(1):49–59. [Google Scholar]
- 31.Bourbonnais ML, Nelson TA, Wulder MA. Geographic analysis of the impacts of mountain pine beetle infestation on forest fire ignition. Can Geogr. 2013;58(2):188–202. [Google Scholar]
- 32.Dennison PE, Brewer SC, Arnold JD, Moritz MA. Large wildfire trends in the western United States, 1984–2011. Geophys Res Lett. 2014;41(8):2928–2933. [Google Scholar]
- 33.Meddens AJH, Hicke J, Ferguson CA. Spatial and temporal patterns of observed bark beetle-caused tree mortality in British Columbia and the western US. Ecol Appl. 2012;22(7):1876–1891. doi: 10.1890/11-1785.1. [DOI] [PubMed] [Google Scholar]
- 34.Ryan KC, Opperman TS. LANDFIRE—A national vegetation/fuels data base for use in fuels treatment, restoration, and suppression planning. For Ecol Manage. 2013;294:208–216. [Google Scholar]
- 35. USGS (2011) Gap Analysis Program (GAP). Available at gapanalysis.usgs.gov/gaplandcover/data/. Accessed September 23, 2014.
- 36.Zhu Z, Evans DL. U.S. forest types and predicted percent forest cover from AVHRR data. Photogramm Eng Remote Sensing. 1994;60(5):525–531. [Google Scholar]
- 37. Prior-Magee JS, et al., eds (2007) Southwest Regional Gap Analysis Final Report (Gap Analysis Program, US Geologic Survey, Moscow, ID)
- 38. USGS (2008) LANDFIRE National Milestone Overall Quality Assessment Report. Available at www.landfire.gov/dp_quality_assessment.php. Accessed October 6, 2014.
- 39. MTBS Project (USDA Forest Service/U.S. Geological Survey) (2014) MTBS Data Access: National MTBS Burned Area Boundaries. Available at www.mtbs.gov/nationalregional/burnedarea.html. Accessed September 23, 2014.
- 40.Eidenshink J, et al. A project for monitoring trends in burn severity. Fire Ecol. 2007;3(1):3–21. [Google Scholar]
- 41. USFS and Its Partners (2013) USDA Forest Service—Aerial Survey Data Download. Available at foresthealth.fs.usda.gov/portal. Accessed September 27, 2014.
- 42.Safranyik L, Wilson B. The Mountain Pine Beetle: A Synthesis of Biology, Management and Impacts on Lodgepole Pine. Canadian Forest Service, Victoria. Natural Resources Canada, Canadian Forest Service; Victoria, BC, Canada: 2006. [Google Scholar]
- 43.Johnson EW, Ross J. Quantifying error in aerial survey data. Australian Forestry. 2008;71(3):216–222. [Google Scholar]
- 44. R Core Team (2014) R: A Language and Environment for Statistical Computing (R Foundation for Statistical Computing, Vienna) Available at www.R-project.org. Accessed March 16, 2014.
- 45.Preisler HK, Hicke JA, Ager AA, Hayes JL. Climate and weather influences on spatial temporal patterns of mountain pine beetle populations in Washington and Oregon. Ecology. 2012;93(11):2421–2434. doi: 10.1890/11-1412.1. [DOI] [PubMed] [Google Scholar]
- 46.Kulakowski D, Veblen TT. Influences of fire history and topography on the pattern of a severe wind blowdown in a Colorado subalpine forest. J Ecol. 2002;90(5):806–819. [Google Scholar]
- 47.O'Sullivan D, Unwin D. Geographic Information Analysis. 2nd Ed Wiley; Hoboken, NJ: 2010. [Google Scholar]
Associated Data
This section collects any data citations, data availability statements, or supplementary materials included in this article.