

Significance
Adult hematopoietic stem and progenitor cells (HSPCs) develop from a small number of specialized endothelial cells in the embryo. Very little is known about how this process, known as the endothelial-to-hematopoietic transition, is regulated. In this paper, we used mouse genetic knockout models to establish Chd1 as the first chromatin remodeler, to our knowledge, shown to regulate this transition. Chd1 is not required in the endothelium prior to the transition, nor in the blood system after the transition. We found that the emergence of HSPCs involves an increase in total nascent transcription that is dependent on Chd1. These results reveal a new paradigm of regulation of a developmental transition by modulation of transcriptional output that may be relevant in other stem/progenitor cell contexts.
Keywords: hemogenic endothelium, endothelial-to-hematopoietic transition, definitive hematopoiesis, transcription, Chd1
Abstract
Lineage specification during development involves reprogramming of transcriptional states, but little is known about how this is regulated in vivo. The chromatin remodeler chomodomain helicase DNA-binding protein 1 (Chd1) promotes an elevated transcriptional output in mouse embryonic stem cells. Here we report that endothelial-specific deletion of Chd1 leads to loss of definitive hematopoietic progenitors, anemia, and lethality by embryonic day (E)15.5. Mutant embryos contain normal numbers of E10.5 intraaortic hematopoietic clusters that express Runx1 and Kit, but these clusters undergo apoptosis and fail to mature into blood lineages in vivo and in vitro. Hematopoietic progenitors emerging from the aorta have an elevated transcriptional output relative to structural endothelium, and this elevation is Chd1-dependent. In contrast, hematopoietic-specific deletion of Chd1 using Vav-Cre has no apparent phenotype. Our results reveal a new paradigm of regulation of a developmental transition by elevation of global transcriptional output that is critical for hemogenesis and may play roles in other contexts.
Hematopoiesis occurs in successive waves and in distinct regions of the embryo during vertebrate development (1, 2). Primitive hematopoiesis begins in the extraembryonic yolk sac at embryonic day (E)7.0 and consists primarily of primitive erythroid cells (3). These progenitors begin to circulate upon the onset of cardiovascular function, migrating to the developing fetal liver (FL) to support early embryonic development via primitive erythropoiesis (4). Definitive hematopoietic stem cells, which have the ability to self-renew and reconstitute all blood lineages in adult recipients, arise from the hemogenic endothelium at various vascular sites beginning around E10 (5–7). These sites include the aorta-gonad-mesonephros (AGM), umbilical and vitelline arteries, and placenta, among others (8, 9). The endothelial-to-hematopoietic transition (EHT) is best-characterized in the AGM, where clusters of hematopoietic stem and progenitor cells (HSPCs) have been observed to emerge from the ventral wall of the dorsal aorta (10–12). The molecular regulation of this remarkable developmental transition is poorly understood, but would likely involve a resetting of the transcriptional program of the endothelium to that of hematopoietic progenitors. In agreement with this notion, the transcription factors Runx1 (7) and Gata2 (13) have been shown to be critical for this transition. It remains unclear what gene expression programs these transcription factors regulate, and whether chromatin regulators also play a role in this transition.
Chromodomain helicase DNA-binding protein 1 (Chd1) is an ATP-dependent chromatin-remodeling enzyme that binds specifically to di- and trimethylated H3K4 (14) and is associated with actively transcribed genes. Chd1 has been linked to various transcription-related processes, including regulation of nucleosome positioning at the 5′ end of transcribed genes (15, 16), suppression of cryptic transcription (17, 18), transcriptional elongation (17, 19, 20), and coupling of transcription with splicing (21). We have previously described Chd1 as a gene up-regulated in multiple mouse stem and progenitor cell types (22, 23). We subsequently showed that Chd1 binding correlates with H3K4me3 and RNA polymerase II binding at transcriptional start sites in mouse embryonic stem (ES) cells, and that Chd1 regulates ES cell self-renewal and reprogramming efficiency in induced pluripotent stem cells (24). Moreover, we recently found that Chd1 promotes an elevated transcriptional output by RNA polymerases I and II, and is required for the survival and growth of the E5.5 epiblast (25).
In this study, we investigated the role of Chd1 in the endothelial-to-hematopoietic transition. We report that endothelial-specific deletion of a conditional Chd1 allele using Tie2-Cre results in a block in definitive hematopoiesis. Lack of Chd1 in endothelial cells results in embryonic lethality by E15.5 due to a complete failure of definitive erythropoiesis, and subsequent anemia that is incompatible with development to term. We further show that, although intraaortic hematopoietic clusters develop in the mutant AGM at E10.5 at a normal frequency and express intermediate markers of differentiation, these clusters do not mature into blood lineage cells in vitro or in vivo. The transcriptome of the mutant endothelium is largely unchanged but lacks activation of a set of genes highly enriched for hematopoietic and growth functions. Interestingly, we found that emerging hematopoietic progenitors undergo an elevation in global transcriptional output that is dependent on Chd1. On the other hand, deletion of Chd1 specifically in hematopoietic cells using Vav-Cre has no phenotype, indicating that Chd1 is not required for hematopoietic survival or function after the endothelial-to-hematopoietic transition. Taken together, these results define a narrow but critical window in which a Chd1-driven elevation in transcriptional output is essential for the developmental transition from endothelium to definitive hematopoiesis in the mouse embryo.
Results
Endothelial-Specific Deletion of Chd1 Results in Embryonic Lethality.
Given the difficulty in using commercial antibodies to detect Chd1 by immunostaining, we assessed Chd1 expression using a mouse line carrying a β-galactosidase reporter knocked into the endogenous Chd1 locus (Chd1LacZ) (25). These results revealed that Chd1 is broadly although not uniformly expressed at midgestation (Fig. S1A). The expression of Chd1 is higher in mesodermal tissues, with low to undetectable expression in the neural tube and intestinal epithelium. In particular, we noticed that Chd1 is expressed in endothelial cells throughout the embryo, including the lung vasculature, the intramedullary blood vessels of the spinal cord, and the ductus venosus in the FL (Fig. S1B). We therefore sought to assess the potential role of Chd1 in the endothelium and its derivatives.
Chd1−/− embryos arrest at E5.5–6.5 due to a defect in epiblast survival and proliferation (25), necessitating the use of a conditional gene deletion strategy to assess the roles of Chd1 postgastrulation. Mice carrying a floxed allele of Chd1 (Chd1flox/flox) (25) were crossed to a transgenic mouse line that expresses Cre recombinase under the control of the Tie2 promoter (Tie2-Cre; Fig. S2A), so as to delete Chd1 specifically in the endothelium (26). To verify the recombination efficiency of Tie2-Cre, we included in our breeding scheme a Cre reporter allele, Ai14 (27). This reporter consists of a red fluorescent protein, tdTomato (tdT), under a ubiquitous CAG promoter, inserted in the Rosa26 locus, and preceded by a loxP-flanked STOP cassette. We achieved a high percentage of recombination within the endothelium population (CD31+) with Tie2-Cre, with 76% of E9.5 (n = 28) and 84% of E10.5 (n = 27) CD31+ cells expressing tdTomato (Fig. S2B). Mutant embryos carry the Tie2-Cre; Chd1flox/– genotype, and the loss of Chd1 in these embryos was validated using quantitative (q)RT-PCR and microarrays: The levels of Chd1 in CD31+ tdTomato+ mutant endothelial cells are reduced to 25.1% of heterozygous controls at E9.5, and reach 12.2% in E11.5 (Fig. S2 C and D and see below). As controls, we use Tie2-Cre; Chd1flox/+ embryos (CreHet), in which Cre induces a heterozygous state for Chd1 in the endothelium. There is no significant difference in recombination efficiency between CreHet control and mutant embryos (Fig. S2B). Embryos at E11.5 display extensive recombination and red fluorescence in the endothelium throughout the embryo and in the yolk sac as expected (Fig. S2 E and F).
Chd1 mutant pups cannot be recovered at birth, indicating that Chd1 plays an essential role in the endothelium (n = 123 pups from 23 litters, P < 0.0001, χ2 test) (Table 1). CD31 immunostaining of E10.5 yolk sac reveals similar branching of blood vessels between mutants and controls (Fig. S2F), suggesting that early endothelial patterning is not affected by the loss of Chd1. In addition, mutants at E13.5 have normal beating hearts (Movie S1) and no discernible defects in the development of the four chambers (Fig. S3A), indicating that heart development is unaffected by endothelial Chd1 ablation. Mutant embryos are morphologically distinguishable at E13.5 from littermate controls, appearing paler and exhibiting hemorrhage and edema (Fig. 1A). By E15.5, most mutant embryos are resorbed (n = 60 embryos from 9 litters, P = 0.021, χ2 test). Hemorrhage and edema are characteristic of lymphatic defects, and we verified that the prominent bilateral hemorrhage around the forelimbs in E13.5 mutant embryos is a result of blood accumulation in dilated jugular lymph sacs and other lymphatic vessels (Fig. S4). Unlike endothelial Chd1 mutants, embryos with mutations that disrupt the blood–lymphatic separation survive to the perinatal period (28–32). Moreover, mutations in regulators of the EHT, such as Runx1 (33), Gata2 (34), and β-catenin (35), display lymphatic phenotypes similar to those seen in Chd1 mutants. This is likely due to a requirement of intact platelet function for proper separation of blood and lymphatic circulatory systems (31). Therefore, we conclude that the lymphatic system defects are not the primary cause of lethality of Chd1 mutants, and may be secondary to a role in hemogenesis.
Table 1.
Genotypes of offspring obtained from crossing Chd1flox/flox mice with Tie2-Cre or Vav-Cre
| Cre line used | Stage | Total (litters) | Genotypes | % Mut | |||
| WT | Het | CreHet | Mut | ||||
| Tie2-Cre | E11.5 | 132 (18) | 28 | 33 | 39 | 32 | 24.2 |
| E13.5 | 119 (16) | 28 | 27 | 35 | 29 | 24.4 | |
| E15.5 | 60 (9) | 16 | 18 | 21 | 5 | 8.3 | |
| Postnatal | 123 (23) | 54 | 33 | 36 | 0 | 0 | |
| Vav-Cre | Postnatal | 165 (19) | 48 | 38 | 47 | 32 | 19.4 |
Fig. 1.

Deletion of Chd1 in the endothelium leads to fetal liver anemia and lethality at midgestation. (A) Representative images of CreHet control and mutant embryos at various embryonic stages. Mutant embryos appear normal at E11.5, but are pale and exhibit hemorrhage and edema by E13.5. Mutants are resorbed by E15.5. (B) Representative image showing dissected FLs from a litter of E13.5 embryos. The three mutant livers (circled in white) are paler and smaller compared with littermate controls. (C) E13.5 FLs from mutant embryos are significantly smaller than from controls. n = 5 litters. (D) Representative flow plots show that mutant FL contains fewer Kit+ progenitors at E11.5 and E13.5 compared with controls. (E) Quantification of Kit+ cells at both E11.5 and E13.5. E11.5: n = 7 litters. E13.5: n = 8 litters. Error bars indicate SEM. ****P ≤ 0.0001.
Endothelial Chd1 Mutants Die from Severe Anemia.
Mutant embryos at E11.5 show no signs of the edema and hemorrhage typical of lymphatic defects, but already tend to be paler than controls, particularly in the yolk sac (Fig. S3B). Because the FL is a major erythropoietic organ from E10 until shortly before birth (4), we isolated FLs from E13.5 embryos. Mutant E13.5 FLs are significantly paler and smaller compared with those of littermate controls (Fig. 1B). The cellularity of mutant FLs is reduced to about 18% of the level of CreHets [an average of 1.6 × 10⁶ cells in mutants (n = 8), relative to an average of 8.8 × 10⁶ cells in CreHets (n = 9), P < 0.0001] (Fig. 1C). We used flow cytometry to analyze E13.5 FLs for Kit, a marker for definitive erythroid progenitors at this stage (36, 37). Whereas almost half of CreHet FL cells are Kit+ (48.8%, n = 8), mutants show a severe reduction of Kit+ progenitors where only 20% of FL cells are Kit+ (n = 18, P < 0.0001) (Fig. 1 D and E). FLs harvested from E11.5 embryos have a similar reduction in Kit+ cells, indicating that blood progenitors are reduced as early as E11.5 (Fig. 1 D and E).
To functionally test for FL erythropoietic activity, we evaluated E13.5 FL using colony-forming unit-erythroid (CFU-E) assays by seeding equal numbers of FL cells into methylcellulose containing only erythropoietin. CFU-Es are reduced in mutants to 28.5% of the level in CreHets (n = 9 mutants vs. n = 14 CreHets, P < 0.0001; Fig. 2A). This decrease prompted us to evaluate immature erythroid progenitors (burst-forming unit-erythroid; BFU-E) using additional growth-promoting cytokines (IL-3, IL-6, and SCF/Kitl). BFU-Es are greatly reduced in mutants, to 32.1% of the level in CreHets (n = 12 mutants vs. n = 12 CreHets, P < 0.0001; Fig. 2B). In contrast, we did not observe significant differences between mutants and CreHets in the number of multilineage colonies [colony-forming units (CFU) for granulocyte, macrophage (CFU-GM) and for granulocyte, erythroid, macrophage, megakaryocyte (CFU-GEMM)] (Fig. 2 C and D). These results indicate that Chd1 mutant FLs are not only greatly reduced in total cell number but are also depleted of erythroid progenitor cells when equal numbers of cells are assessed.
Fig. 2.
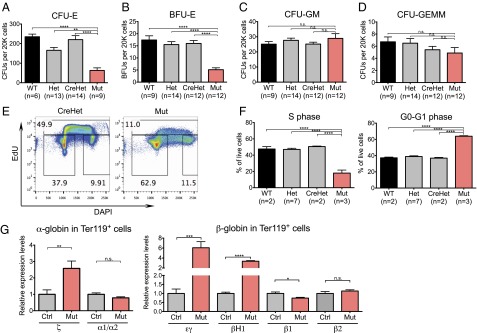
Failure of definitive erythropoiesis in Chd1 mutants. (A) CFU-E colony counts from 20,000 FL cells per E13.5 embryo seeded, in duplicates. n = 5 litters. (B–D) BFU-E, CFU-GM, and CFU-GEMM colony counts from 20,000 FL cells per E13.5 embryo seeded, in duplicates. n = 6 litters. (E) Representative flow plots show reduced EdU incorporation in mutant FL at E13.5. (F) Quantification showing a strong reduction of cells in S phase and a corresponding increase of cells in G0-G1 phase in mutant FL. n = 2 litters. (G) qRT-PCR of sorted Ter119+ cells from E13.5 FLs shows an increase of primitive erythroid globins and a reduction of definitive erythroid globins. n = 8 control and 5 mutant embryos from three litters. Error bars indicate SEM. *P ≤ 0.05; **P ≤ 0.01; ***P ≤ 0.001; ****P ≤ 0.0001; n.s., not significant.
To determine the cause of the reduced erythroid population, we examined the cell-cycle profile of E13.5 FL cells by the incorporation of 5-ethynyl-2′-deoxyuridine (EdU). Whereas almost half of the cells in control FLs are in S phase (47.8%, n = 11), only 18% of the cells in mutant FLs (n = 3) are in S phase, indicating a reduced proliferation capacity in the mutants (Fig. 2 E and F). To determine whether the remaining erythrocytes present in the E13.5 mutant FL are predominantly of the primitive or definitive lineage, we conducted qRT-PCR for globin genes that are differentially expressed between the two lineages (38). We found that mutant Ter119+ erythrocytes had higher levels of primitive globin expression (ζ-globin, εγ-globin, and βH1-globin) and reduced expression of β1-globin, which is associated with definitive erythrocytes (Fig. 2G). This result indicates that mutants have a higher ratio of primitive to definitive Ter119+ erythrocytes in the FL compared with CreHet controls, although we cannot exclude that primitive and definitive globins are coexpressed in the same cells in the mutants. Taken together with the dramatic reduction in cellularity of the Chd1 mutant FL (Fig. 1C), these results lead us to conclude that endothelial Chd1 mutants experience anemia due to a failure in definitive erythropoiesis.
Definitive Hematopoiesis Is Impaired in Chd1 Mutants.
The strong reductions in total FL cellularity and erythropoiesis in the mutants led us to explore potential defects in hematopoietic progenitors. We found that the percentage of Ter119– Kit+ Sca1+ HSPCs is reduced by threefold in E13.5 mutant FLs, from 3% in CreHets (n = 8) to 0.9% in mutants (n = 18, P < 0.0001) (Fig. 3 A and B). Importantly, this reduction in HSPCs is present as early as E11.5, where control FLs had 1.7% Ter119– Kit+ Sca1+ HSPCs (n = 10) compared with 0.4% in mutants (n = 15, P < 0.0001) (Fig. 3 A and B). Thus, HSPCs are reduced in endothelial Chd1 mutants, both in absolute number and relative frequency.
Fig. 3.

Chd1 mutant FLs are deficient in Ter119– Kit+ Sca1+ hematopoietic stem and progenitor cells. (A) Representative flow plots show a loss of Ter119– Kit+ Sca1+ cells in mutant E11.5 and E13.5 FLs. (B) Kit+ Sca1+ HSPCs are significantly reduced in mutant compared with control FL at both E11.5 and E13.5. E11.5: n = 7 litters. E13.5: n = 8 litters. Error bars indicate SEM. *P ≤ 0.05; ****P ≤ 0.0001.
Whereas the FL is the site of HSPC expansion and differentiation, the endothelium of the AGM at E10.5 is a source of definitive hematopoietic progenitors via an endothelial-to-hematopoietic transition (39). To determine whether the depletion of HSPCs in the FL can be traced back to defective AGM hematopoiesis, we assessed the emergence of intraaortic hematopoietic clusters in E10.5 AGMs. Confocal imaging of mutant AGMs revealed the presence of intraaortic clusters that express known HSPC markers Runx1 (n = 4) and Kit (n = 2) (Fig. 4A and Fig. S5). Mutants also had no significant difference in the number of hematopoietic clusters compared with CreHets (Fig. 5B; n = 6). These data suggest that Chd1-deficient hemogenic endothelium is capable of forming hematopoietic clusters in the AGM. However, hematopoietic clusters in mutant AGMs show signs of apoptosis, as indicated by staining for cleaved caspase 3, which was not detected in any of the clusters examined in CreHet AGMs (Fig. 5C). To determine whether the apoptosis seen in mutant hematopoietic clusters could affect the maturation of hemogenic endothelium into HSPCs, we examined E11.5 AGM CD31+ endothelial cells for hemogenic activity. Flow analyses revealed that the proportion of Kit+ CD45– cells (early cluster cell markers) within the CD31+ endothelial population in the AGM at E11.5 is similar between mutants and CreHet controls. However, there is a significant reduction in Kit+ CD45+ cells (HSPC markers) in the mutants compared with CreHet controls (Fig. 4 D and E), suggesting a potential failure in the maturation to CD45+ HSPCs in Chd1 endothelial mutants.
Fig. 4.

Chd1 mutant AGM contains intraaortic hematopoietic clusters that do not mature to blood cells in vivo and in vitro. (A) Intraaortic clusters in the E10.5 AGM show proper expression of Runx1 and CD31 and the absence of arterial marker Sox17. (B) Mutant AGMs show similar numbers of hemogenic clusters compared with CreHets. n = 6 mutants and 6 CreHets from three litters. (C) Intraaortic clusters in mutant E10.5 AGMs stain positive for cleaved caspase 3 (cCasp3), a marker for apoptosis, which is not detected in clusters from CreHet AGMs. n = 3 mutants and 2 CreHet embryos. (D) Representative flow plots of Ter119– CD31+ cells show a loss of Kit+ CD45+ cells in E11.5 mutant AGMs. (E) CD31+ Ter119– cells from mutant E11.5 AGMs contain a comparable Kit+ CD45– population but show a significant reduction of Kit+ CD45+ cells compared with CreHets. n = 7 litters. (F) Total CFU counts from E10.5 AGM, in duplicates. n = 4 litters. (G) Mutant AGMs are highly defective in the generation of CD45+ cells when cocultured with OP9-DL1 stromal cells. n = 4 litters. (H) Representative flow plots show that mutant AGMs do not give rise to CD45+ TCRβ+ T cells when cocultured with OP9-DL1 stromal cells. Error bars indicate SEM. *P ≤ 0.05; **P ≤ 0.01; n.s., not significant.
Fig. 5.
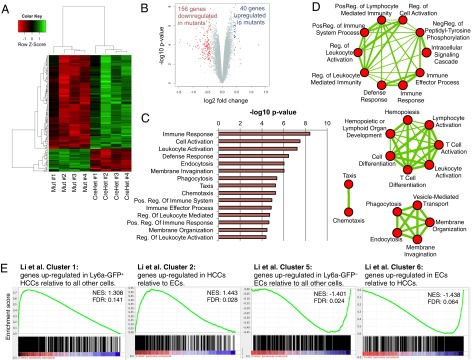
Reduced expression of hematopoietic and growth genes in the E10.5 Chd1 mutant endothelium. (A and B) Microarray analysis comparing four biological replicates each of CreHet and mutant endothelium at E10.5 shows a mild misregulation of gene expression. A cutoff of P < 0.01 and | logFC | > 0.4 is depicted. (C) DAVID Gene ontology (GO) analysis shows that immune-related categories are significantly enriched in the set of genes down-regulated in Chd1 mutant endothelium. Similar results were obtained when all differentially expressed genes were used. (D) GO enrichment analysis shows that GO terms fall into four main clusters. The thickness of connecting lines represents the number of shared genes underpinning the two connected terms. (E) GSEA for gene clusters identified by Li et al. (42) as differentially expressed between hematopoietic cluster cells and endothelial cells shows that HCC up-regulated genes are preferentially decreased and EC up-regulated genes are preferentially increased in Chd1 mutant endothelium. FDR, false discovery rate; NES, net enrichment score.
To functionally assess the EHT potential in the mutants, we evaluated the ability of E10.5 AGMs to differentiate into myeloid and lymphoid cells in vitro. Methylcellulose colony assays revealed that mutant AGMs yield an average of 24.9 colonies (n = 8) vs. 142.7 colonies in CreHets (n = 6) (Fig. 4F), indicating that mutants have more than fivefold reduction in myeloid potential than CreHets. To test for lymphoid lineage differentiation potential, we cultured E10.5 AGMs on OP9-DL1 stromal cells, which have previously been shown to support T-lymphocyte differentiation in vitro (40). Whereas AGMs taken from CreHet embryos can differentiate into CD45+ TCRβ+ T lymphocytes in vitro, mutant AGMs are strongly impaired in the generation of CD45+ blood cells in this culture system (Fig. 4G), in agreement with data in vivo (Fig. 4 D and E), and do not show evidence of TCRβ expression (Fig. 4H). Taken together, these results indicate that the endothelial-to-hematopoietic transition is initiated in the mutant AGM but that the maturation into HSPCs is defective, resulting in hemogenic clusters that undergo apoptosis.
Transcriptional Profiling of the Chd1 Mutant Endothelium Reveals an Early Loss of the Hematopoietic Program.
To assess the transcriptional consequences of Chd1 loss in endothelial cells, we conducted global gene expression analyses of CD31+ endothelial cells isolated from whole E10.5 embryos. Four biological replicates each of CreHet and mutant E10.5 CD31+ tdTomato+ cells were processed for microarray analyses. We found that only a small number of genes are affected in the mutants: 196 genes, at P < 0.01 and a log2 fold change of 0.4 or more (Fig. 5A and Dataset S1). Thus, the vast majority of the transcriptional program of the E10.5 endothelium is unaffected in the mutants. Significantly more genes are down-regulated (156 genes) than up-regulated (40 genes) in the mutant endothelium (Fig. 5B), consistent with previous reports that mouse Chd1 associates with the promoters of active genes and serves as a positive regulator of transcription (24, 25).
Gene ontology analysis revealed that the set of genes down-regulated in the mutants is remarkably enriched for functions in hematopoiesis and the immune system (Fig. 5 C and D). We analyzed this dataset further using an unbiased gene set enrichment analysis (GSEA) (41) and observed similar enrichments for immune-related functions (Fig. S6A). In addition, we identified very significant enrichments for genes regulated by Gata2 and Runx1-Runx1t1 (Fig. S6 B and C), and both of these transcription factors are key regulators of the emergence of HSPCs (7, 13).
Our results are in agreement with three recent studies showing that the emergence of HSPCs is regulated by an immune/inflammatory response (42–44). In one of the studies, Li and colleagues carried out expression profiling of CD31+ Cdh5+ Esam+ Ly6a-GFP+ Kit+ hematopoietic cluster cells (HCCs) compared with endothelial cells (ECs). Interestingly, Chd1 is a member of cluster 1, which includes the genes identified by Li et al. as up-regulated in HCCs (Fig. S6D) (42). Further analysis of the gene expression data segregated via the Li et al. subsets revealed a specific loss of HCC-associated genes and a corresponding enrichment of EC-associated genes in Chd1-deficient endothelium (Fig. 5E).
The lower detection of hematopoiesis genes in mutant CD31+ endothelial cells could be due to reduced levels of expression per cell or reduced numbers of early hematopoietic cells that are still CD31+. The latter possibility is more likely, given the lower numbers of CD31+ Ter119– Kit+ CD45+ cells in E10.5 mutants (Fig. 4 D and E). Taken together, our results indicate that Chd1 is essential for the establishment of an HSPC-associated transcriptional subprogram in cells emerging from the E10.5 endothelium, potentially by promoting their survival and expansion. This transcriptional subprogram is anticipated to be a useful resource for the discovery of novel markers or regulators of definitive hematopoiesis in future studies.
Chd1-Dependent Elevation in Transcriptional Output in Emerging HSPCs.
We recently found that Chd1 promotes an elevated transcriptional output essential for optimal self-renewal of ES cells and growth of the epiblast (25). ES cells are known to be in a state of hypertranscription, with a global elevation of transcriptional output per cell (45). We found that Chd1−/− ES cells express lower levels of most mRNAs, intergenic transcripts, and ribosomal RNA on a per-cell basis, and that these defects are associated with reduced recruitment of RNA polymerase (Pol) II to active genes (25). Thus, Chd1 promotes global transcriptional amplification of both mRNAs and rRNA, in a manner similar to that reported for Myc (46, 47). Interestingly, we noticed that genes validated as Myc targets, as well as ribosomal protein genes, are preferentially down-regulated in Chd1 mutant CD31+ samples (Fig. 6 A and B and Fig. S7). These results raised the question of whether the levels of transcriptional output are increased in emerging HSPCs. This is a challenging question to answer, given the rare nature of these cells, and has not to our knowledge been addressed before.
Fig. 6.

Chd1 is required for elevated RNA transcription in the hemogenic endothelium. (A) GSEA for genes up-regulated by Myc and whose promoters are bound by MYC, via phylogenetic comparison and ChIP in P493 cells (61), reveals a preferential loss of Myc targets in Chd1 mutant endothelium. (B) GSEA for genes listed in the Kyoto Encyclopedia of Genes and Genomes (www.genome.jp/kegg) pathway for “ribosome” reveals a preferential down-regulation in Chd1 mutant endothelium. (C) Normalized histograms of EU incorporation reveal distinct levels of nascent transcriptional output between different subpopulations in E11.5 AGM. (D) Both CD31+ Kit+ and CD45+ cells incorporate higher levels of EU compared with CD31+ Kit– endothelium in controls. This increase is significantly suppressed in mutant cells. Error bars indicate SEM. *P ≤ 0.05; **P ≤ 0.01. (E) Normalized histograms of EU incorporation reveal that mutant cells have levels of transcriptional output similar to controls in CD31+ Kit− E11.5 AGM endothelium but are defective in the up-regulation of nascent RNA transcription in CD31+ Kit+ and CD45+ cells. Note that all cells in the EU incorporation analyses of C–E are also tdTomato+, that is, derived from the Tie2-Cre–marked lineage, with the exception of CD31– Kit– cells.
We examined the global nascent RNA transcription levels of E11.5 AGM cells by incorporation of 5-ethynyl-uridine (EU), and found that tdTomato+ CD31+ Kit– structural endothelial cells maintain a similar RNA transcriptional output as tdTomato– CD31– Kit– nonendothelial cells in control AGMs (Fig. 6C). Remarkably, tdTomato+ CD31+ Kit+ hematopoietic cluster cells in CreHet AGMs exhibit an elevated rate of nascent RNA synthesis, incorporating on average 75.3% more EU per cell compared with tdTomato+ CD31+ Kit– structural endothelium (Fig. 6 C and D; n = 7 CreHets). This increase is also observed in tdTomato+ CD45+ cells, with an average of 79.2% higher EU incorporation per cell compared with tdTomato+ CD31+ Kit– cells (Fig. 6 C and D).
We next examined Chd1 mutant AGM cells, and found that mutant tdTomato– CD31– Kit– and tdTomato+ CD31+ Kit– cells have normal levels of global transcriptional output compared with the corresponding subpopulations in the CreHet AGM (Fig. 6E). Thus, the deletion of Chd1 does not appear to affect the global transcriptional output of structural endothelium. However, the elevated transcriptional output observed in CreHet tdTomato+ CD31+ Kit+ cells is significantly suppressed in mutant cells (35.8% compared with tdTomato+ CD31+ Kit– cells, P = 0.0077, n = 4 mutants) (Fig. 6 C–E). The increase in transcriptional activity in tdTomato+ CD45+ cells is similarly suppressed in the mutants (41.3% compared with tdTomato+ CD31+ Kit– cells, P = 0.0134) (Fig. 6 C–E). Taken together, these results indicate that the differentiation of CD31+ Kit– endothelium to CD31+ Kit+ hematopoietic cluster cells and CD45+ blood cells in the E11.5 AGM coincides with an elevation in total nascent transcriptional output, and that this increase is Chd1-dependent.
Chd1 Is Not Required for Blood Development After HSPC Specification.
The data above are consistent with a requirement for Chd1 in the transition of endothelial cells into HSPCs. However, it remained possible that the defects observed were due to a role of Chd1 after HSPC specification (Fig. 4A). To determine whether Chd1 is required for hematopoietic development after the endothelial-to-hematopoietic transition, we deleted Chd1 specifically in hematopoietic cells using Vav-Cre (48). This Cre line is reported to be active in HSPCs and their progeny in the embryo proper as early as E11.5 (49). We found that the level of Vav-Cre–induced recombination in CD45+ hematopoietic cells of E10.5 whole embryo and E11.5 FL is very high (>95%; examples are shown in Fig. S8). In contrast to the deletion of Chd1 within the endothelial compartment, normal Mendelian ratios of live pups were observed at birth upon hematopoietic-specific deletion (Table 1). Vav-Cre mutant embryos do not display any signs of fetal liver anemia, and the size of mutant E13.5 FLs is comparable to that of littermate controls (Fig. 7A). Consistent with these observations, Vav-Cre mutant FL cells show no defect in erythroid development in methylcellulose culture assays (CFU-E) (Fig. 7B). Moreover, an analysis of peripheral blood composition of control and mutant mice at 1 y of age revealed complete recombination of the Chd1flox allele at the genomic DNA level (Fig. 7C) but no significant differences in all of the major blood populations examined, namely CD11b+ GR-1+ SSChi granulocytes, CD11b+ GR-1+ SSCint monocytes, CD11b+ GR-1– macrophages, CD19+ B cells, TCRβ+ CD4+ T cells, TCRβ+ CD8+ T cells, and TCRβ– NK1.1+ natural killer (NK) cells (Fig. 7D, n = 6 mutants vs. n = 6 CreHets). Taken together, these results indicate that Chd1 is not required for hematopoietic development and homeostasis after HSPC specification.
Fig. 7.

Hematopoietic-specific Chd1 mutants are viable and phenotypically normal. (A) Fetal livers from mutant embryos generated using Vav-Cre contain similar cell numbers as littermate controls. n = 6 litters. (B) CFU-E colony counts for mutant livers appear comparable to those from controls. n = 2 litters. (C) Intact Chd1flox allele is undetectable in the peripheral blood of Vav-Cre adult animals. (D) Peripheral blood from mutant mice and CreHet controls shows comparable blood populations at 1 y of age. n = 6 CreHet and 6 mutants from six litters. Error bars indicate SEM. ****P ≤ 0.0001; n.s., not significant.
Discussion
Recent studies traced the origin of the adult hematopoietic system to a small number of hemogenic endothelial cells found associated with midgestational arteries. However, the low percentage of endothelial cells that differentiate into hematopoietic cells and the technical difficulty in isolating these hemogenic clusters result in limited material available for analysis. Consequently, very little is known about how the endothelial-to-hematopoietic transition occurs in vivo, and only a few genes or pathways, including Runx1 (7), Gata2 (13), Notch signaling (50), and the Wnt/β-catenin pathway (35), have been implicated in this process. Our study documents that Chd1 is the first chromatin remodeler, to our knowledge, shown to be essential for the emergence of HSPCs from the endothelium. We further define the specific temporal window of requirement for Chd1 and identify a transcriptional subprogram associated with HSPCs and cellular growth that is lacking in Chd1 mutants. Finally, we identify an elevation in transcriptional output during the transition of endothelium to hematopoietic progenitors, and this elevation is Chd1-dependent. These results indicate that chromatin remodeling is key to the emergence of HSPCs from the endothelium, and provide insight into the underlying molecular mechanisms.
Intraaortic hematopoietic clusters form in the Chd1 mutant AGM and express Runx1 and Kit, but the mutant clusters show signs of apoptotic cell death and a failure to mature into CD45+ hematopoietic cells. These results place the function of Chd1 downstream of the requirement for Wnt/β-catenin activity (35) and upstream of the activation of CD45. These data indicate that the earliest definitive hematopoietic progenitors form in Chd1 mutants but fail to expand in number and instead are lost by apoptosis. Although Chd1 is not required for subsequent differentiation of HSPCs and steady-state maintenance of the adult hematopoietic system, it remains possible that Chd1 plays a functional role upon acute infection, regeneration, or aging.
Note that Chd1 is not required for baseline levels of transcription to occur, as evidenced by our analysis of transcriptional output in structural endothelium (Fig. 6) and the fact that both Chd1 mutant endothelium and Vav-Cre–induced mutant hematopoietic cells develop normally. Our results indicate that Chd1 drives an elevated transcriptional output that is specifically required for survival and expansion of HSPCs emerging from the endothelium. There are about 400–500 Kit+ cells in the dorsal aorta at E10.5 (7), and only a subset of these are HSPCs (42, 51). The fact that HSPCs arise from such a rare fraction of the endothelium and need to rapidly give rise to the entire definitive blood system is expected to generate a high demand for cellular growth pathways, including transcription and translation. Cell doubling times of as low as 8 h have been described for fetal erythroblasts (52), and there is a decrease of cell-cycle entry in Chd1 mutants in the fetal liver, which is composed largely of erythroblasts (Fig. 2F). The higher expression of Chd1 in HSPCs (42) and the data demonstrating that Chd1 is required for the up-regulation of HSPC-associated genes, Myc targets, ribosomal protein genes, and overall transcriptional output during the endothelium-to-hematopoietic transition all support the model that cellular growth pathways dependent on Chd1 are key to HSPC survival and expansion (Fig. 8). Chd1 is required for Myc-driven hyperproliferation in mammary cells (53), and both Chd1 and Myc promote a globally elevated transcriptional output in ES cells (25, 46, 47). At the biochemical level, Chd1 removes the promoter-proximal nucleosomal barrier and facilitates the engagement of RNA Pol II with elongation (16). In addition to enhancing the expression of RNA Pol II genes, Chd1 is also a direct regulator of the output of ribosomal RNA (25). Of note, deficiencies in ribosomal protein genes can cause anemia and other blood disorders (54). It is important to keep in mind that the intricate link between the elevated transcriptional output and the proliferative state of HSPCs may involve feed-forward regulation, whereby the machinery that drives an increased proliferation rate signals back to the chromatin to further boost transcriptional output. Moreover, this hypertranscribing, hyperproliferative state may involve competition between the cells and be attenuated upon changes in the signaling environment and/or saturation of supporting niche spots. A dissection of the potential links between transcription, the cell-cycle machinery, and signaling in HSPCs deserves further investigation.
Fig. 8.

Model for the role of Chd1 in transcriptional output and emergence of HSPCs. The expression of Chd1 and the levels of nascent transcriptional output are increased in hematopoietic progenitors relative to endothelium. Deletion of Chd1 from the endothelium allows the formation of hematopoietic clusters, but these have reduced levels of transcriptional output, fail to expand, and are lost by apoptosis. See text for details.
It will be of interest to assess the transcriptional and protein output of HSPCs at the single-cell level. The recent development of tools to enrich for different cellular fractions along the transition between the endothelium and HSPCs (42), and to perform ChIP sequencing with low numbers of freshly collected embryonic cells (55), paves the way for the dissection of the chromatin and transcriptional reprogramming events that lead to the emergence of HSPCs. These studies may in turn inform the development of improved methods to generate HSPCs in vivo or expand them ex vivo for applications in regenerative medicine. The regulation of a cell-fate transition by elevation of nascent transcriptional output may represent a novel paradigm applicable to other progenitor cell contexts, given the fact that Chd1 is up-regulated in several stem/progenitor cell populations (22, 23). Moreover, our results suggest that standard normalization procedures that assume equal transcriptional output across populations may not fully capture transcriptional differences in stem/progenitor cells; rather, approaches that have single-cell resolution or use cell-number normalization should be carried out.
Materials and Methods
Mice.
Tie2-Cre (26), Vav-Cre (48), Ai14 tdTomato reporter (27), and Chd1 mutant mice (25) have been previously described. These mice were all backcrossed for at least eight generations onto a C57BL/6 genetic background. Care and use of mice were in accordance with the guidelines of the University of California, San Francisco Institutional Animal Care and Use Committee. Conceptuses were generated from timed matings. Detection of the vaginal plug was considered as embryonic day 0.5.
β-Galactosidase Staining.
E13.5 embryos were fixed in 4% (mass/vol) paraformaldehyde overnight, followed by serial overnight incubations in 10%, 20%, and 30% (mass/vol) sucrose, and frozen in Tissue-Tek OCT Compound (Sakura Finetek; 4583). Cryosections (30 µm) were obtained (Leica Biosystems; CM3050S) and mounted on glass slides. Cryosections were incubated overnight at 37 °C in X-gal staining solution [5 mM K3Fe(C6FeK3N6), 5 mM K4Fe(C6FeK4N6⋅3H2O), 0.5 mg/mL X-gal in X-gal buffer (5 mM EGTA, 2 mM MgCl2⋅6H2O, 0.02% Nonidet P-40, 0.01% deoxycholate in Dulbecco's Phosphate-Buffered Saline)]. Cryosections were counterstained with Nuclear Fast Red (Vector Labs), mounted with PolyMount (Polysciences), and imaged using a ScanScope XT slide scanner (Aperio Technologies).
Flow Cytometry and Cell Sorting.
Whole embryos, FLs, or AGMs were dissected and dissociated to single cells by treating with 1 mg/mL collagenase type IV (Gibco) and 0.8 mg/mL DNase I (Worthington) for 10 min at 37 °C. Cells were incubated with fluorescently labeled antibodies for 60 min at 4 °C, washed, and analyzed on an LSR II (BD Biosciences) or sorted on a FACSAria II (BD Biosciences). For cell-cycle analyses, dissociated single cells were incubated in 10 μM EdU for 1 h, followed by fixation and EdU detection using a Click-iT EdU Flow Cytometry Kit (Molecular Probes) following the manufacturer’s instructions. For total nascent RNA transcription analyses, dissociated single cells were incubated in 1 mM EU for 1 h, followed by fixation and EU detection using a Click-iT RNA Imaging Kit (Molecular Probes) following the manufacturer’s protocol for flow cytometry. Data were analyzed using FlowJo software (Tree Star). Antibodies and conjugates are listed in Table S1.
RNA Isolation and Quantitative RT-PCR.
Total RNA was isolated from sorted cells using an Arcturus PicoPure RNA Isolation Kit (Applied Biosystems) or RNeasy Plus Micro Kit (Qiagen). cDNA was generated using a High Capacity cDNA Reverse Transcriptase Kit (Applied Biosystems), and qRT-PCR reactions were performed in triplicates using SYBR FAST ABI Prism 2X qPCR Master Mix (Kapa Biosystems) and run on a ViiA 7 Real-Time PCR System (Applied Biosystems). Relative abundance of mRNAs was calculated using ViiA 7 software by normalization to Gapdh, Ubb, and Rpl7 mRNA levels. Primer sequences are listed in Table S2.
Hematopoietic Progenitor Assays.
CFU assays were performed using MethoCult M3434 (Stem Cell Technologies), whereas BFU-E assays were performed using MethoCult M3334 (Stem Cell Technologies). Cells were plated in duplicates in 35-mm culture dishes according to the manufacturer’s instructions. Plates were incubated at 37 °C in a humidified chamber under 5% CO2. Hematopoietic colonies were counted with an inverted microscope at day 3 of culture. OP9-DL1 T-lymphoid differentiation assays were performed as described (56). Dissected AGMs were dissociated into single-cell suspension before culture with OP9-DL1 cells. Cocultures were passaged every 5–7 d for 5 wk and then harvested for flow cytometry analysis.
Immunofluorescence.
E10.5 embryos were fixed in 2% paraformaldehyde solution overnight and frozen in Tissue-Tek OCT Compound (Sakura Finetek; 4583). Cryosections (20–40 µm) were obtained (Thermo Scientific; Microm HM 550) and mounted. Slides were dried for 1 h at room temperature, washed with PBST (0.5% Tween or Triton X-100), and incubated in blocking buffer (PBST, 1% BSA, 5% donkey serum) for 1 h. Primary antibodies were incubated at 4 °C overnight or at room temperature for 6 h in blocking buffer. Slides were washed with PBST and incubated with the secondary antibody for 2 h, washed, stained with 2 μg/μL DAPI, and mounted in Vectashield (H-1400) (Vector Labs). Images were captured on a Leica SPE confocal microscope and compiled using Imaris 7.6 (Bitplane) software. Hematopoietic clusters were quantified by analyzing five serial 40-µm cryosections immediately caudal to the forelimb bud in each embryo. Clusters were defined to be groups of four or more DAPI+ cells associated with the endothelial layer that stain positive for CD31 and Runx1. Antibodies used are listed in Table S1.
Microarray Analysis.
Whole-genome gene expression analysis was performed on CD31+ tdTomato+ cells sorted from four littermate pairs of CreHet and mutant embryos. Total RNA was extracted using an Arcturus PicoPure RNA Isolation Kit (Applied Biosystems), amplified with Ovation PicoSL WTA System V2 (NuGEN), labeled with Encore BiotinIL Module (NuGEN), and hybridized to MouseRef-8 v2.0 Expression BeadChip (Illumina) at the UCLA Neuroscience Genomics Core. Gene expression data were quantile-normalized and sample heterogeneity was assessed in R with the SampleNetwork function (57). Batch normalization was conducted using ComBat (58) with embryo genotype as a covariate. Statistical testing was performed on log2-transformed data using the Bioconductor (www.bioconductor.org) package linear models for microarray data (limma). Differentially expressed genes were identified by using thresholds of P < 0.01 and log2 fold change >0.4 and are listed in Dataset S1. Microarray data have been deposited in the National Center for Biotechnology Information’s Gene Expression Omnibus (GEO) and are accessible through GEO Series accession number GSE62796. Gene ontology analysis was conducted using DAVID (59), and the output was fed into Enrichment Map (60) for enrichment analysis using a cutoff of P <0.001, FDR <0.01, and an overlap coefficient of 0.6. Gene set enrichment analysis was performed as described (41).
Statistical Analyses.
All data are presented as mean ± SEM and calculated using Prism 6 software (GraphPad). χ2 tests were used to test for statistical significance in litter sizes. When comparing mutants to the other three genotypes, statistical significance was assessed using a one-way ANOVA followed by Tukey’s multiple comparison tests. Unpaired two-tailed t tests were used when comparing between two categories. *P ≤ 0.05; **P ≤ 0.01; ***P ≤ 0.001; ****P ≤ 0.0001.
Supplementary Material
Acknowledgments
We thank Barbara Panning, Benoit Bruneau, Marco Conti, Robert Blelloch, and Diana Laird for input during the course of the work, and members of the M.R.-S. laboratory for critical reading of the manuscript. We also thank Juan Carlos Zúñiga-Pflücker of Sunnybrook Health Sciences Centre for the OP9-DL1 cell lines, Brenda Han for the gift of antibodies and assistance with the analysis of adult peripheral blood, and Jasmine Lau for assistance with flow cytometry. F.M.K. was supported by a National Science Scholarship from the Agency for Science, Technology and Research (A*STAR, Singapore). This work was funded by a Burroughs Wellcome Fund Career Award for Medical Sciences (1008408.01) and an NIH New Innovator Award (DP2OD009883) to A.C.Z., and an NIH R01 (GM113014) and an NIH New Innovator Award (DP2OD004698) to M.R.-S.
Footnotes
The authors declare no conflict of interest.
This article is a PNAS Direct Submission. J.D.E. is a guest editor invited by the Editorial Board.
Data deposition: The microarray data reported in this paper have been deposited in the Gene Expression Omnibus (GEO) database, www.ncbi.nlm.nih.gov/geo (accession no. GSE62796).
This article contains supporting information online at www.pnas.org/lookup/suppl/doi:10.1073/pnas.1424850112/-/DCSupplemental.
References
- 1.Cumano A, Godin I. Ontogeny of the hematopoietic system. Annu Rev Immunol. 2007;25:745–785. doi: 10.1146/annurev.immunol.25.022106.141538. [DOI] [PubMed] [Google Scholar]
- 2.Dzierzak E, Speck NA. Of lineage and legacy: The development of mammalian hematopoietic stem cells. Nat Immunol. 2008;9(2):129–136. doi: 10.1038/ni1560. [DOI] [PMC free article] [PubMed] [Google Scholar]
- 3.Palis J, Robertson S, Kennedy M, Wall C, Keller G. Development of erythroid and myeloid progenitors in the yolk sac and embryo proper of the mouse. Development. 1999;126(22):5073–5084. doi: 10.1242/dev.126.22.5073. [DOI] [PubMed] [Google Scholar]
- 4.Baron MH, Isern J, Fraser ST. The embryonic origins of erythropoiesis in mammals. Blood. 2012;119(21):4828–4837. doi: 10.1182/blood-2012-01-153486. [DOI] [PMC free article] [PubMed] [Google Scholar]
- 5.de Bruijn MFTR, et al. Hematopoietic stem cells localize to the endothelial cell layer in the midgestation mouse aorta. Immunity. 2002;16(5):673–683. doi: 10.1016/s1074-7613(02)00313-8. [DOI] [PubMed] [Google Scholar]
- 6.Zovein AC, et al. Fate tracing reveals the endothelial origin of hematopoietic stem cells. Cell Stem Cell. 2008;3(6):625–636. doi: 10.1016/j.stem.2008.09.018. [DOI] [PMC free article] [PubMed] [Google Scholar]
- 7.Chen MJ, Yokomizo T, Zeigler BM, Dzierzak E, Speck NA. Runx1 is required for the endothelial to haematopoietic cell transition but not thereafter. Nature. 2009;457(7231):887–891. doi: 10.1038/nature07619. [DOI] [PMC free article] [PubMed] [Google Scholar]
- 8.Swiers G, Rode C, Azzoni E, de Bruijn MFTR. A short history of hemogenic endothelium. Blood Cells Mol Dis. 2013;51(4):206–212. doi: 10.1016/j.bcmd.2013.09.005. [DOI] [PMC free article] [PubMed] [Google Scholar]
- 9.Zape JP, Zovein AC. Hemogenic endothelium: Origins, regulation, and implications for vascular biology. Semin Cell Dev Biol. 2011;22(9):1036–1047. doi: 10.1016/j.semcdb.2011.10.003. [DOI] [PubMed] [Google Scholar]
- 10.Bertrand JY, et al. Haematopoietic stem cells derive directly from aortic endothelium during development. Nature. 2010;464(7285):108–111. doi: 10.1038/nature08738. [DOI] [PMC free article] [PubMed] [Google Scholar]
- 11.Boisset J-C, et al. In vivo imaging of haematopoietic cells emerging from the mouse aortic endothelium. Nature. 2010;464(7285):116–120. doi: 10.1038/nature08764. [DOI] [PubMed] [Google Scholar]
- 12.Kissa K, Herbomel P. Blood stem cells emerge from aortic endothelium by a novel type of cell transition. Nature. 2010;464(7285):112–115. doi: 10.1038/nature08761. [DOI] [PubMed] [Google Scholar]
- 13.de Pater E, et al. Gata2 is required for HSC generation and survival. J Exp Med. 2013;210(13):2843–2850. doi: 10.1084/jem.20130751. [DOI] [PMC free article] [PubMed] [Google Scholar]
- 14.Flanagan JF, et al. Double chromodomains cooperate to recognize the methylated histone H3 tail. Nature. 2005;438(7071):1181–1185. doi: 10.1038/nature04290. [DOI] [PubMed] [Google Scholar]
- 15.Gkikopoulos T, et al. A role for Snf2-related nucleosome-spacing enzymes in genome-wide nucleosome organization. Science. 2011;333(6050):1758–1760. doi: 10.1126/science.1206097. [DOI] [PMC free article] [PubMed] [Google Scholar]
- 16.Skene PJ, Hernandez AE, Groudine M, Henikoff S. The nucleosomal barrier to promoter escape by RNA polymerase II is overcome by the chromatin remodeler Chd1. eLife. 2014;3:e02042. doi: 10.7554/eLife.02042. [DOI] [PMC free article] [PubMed] [Google Scholar]
- 17.Quan TK, Hartzog GA. Histone H3K4 and K36 methylation, Chd1 and Rpd3S oppose the functions of Saccharomyces cerevisiae Spt4-Spt5 in transcription. Genetics. 2010;184(2):321–334. doi: 10.1534/genetics.109.111526. [DOI] [PMC free article] [PubMed] [Google Scholar]
- 18.Smolle M, et al. Chromatin remodelers Isw1 and Chd1 maintain chromatin structure during transcription by preventing histone exchange. Nat Struct Mol Biol. 2012;19(9):884–892. doi: 10.1038/nsmb.2312. [DOI] [PMC free article] [PubMed] [Google Scholar]
- 19.Lin JJ, et al. Mediator coordinates PIC assembly with recruitment of CHD1. Genes Dev. 2011;25(20):2198–2209. doi: 10.1101/gad.17554711. [DOI] [PMC free article] [PubMed] [Google Scholar]
- 20.Simic R, et al. Chromatin remodeling protein Chd1 interacts with transcription elongation factors and localizes to transcribed genes. EMBO J. 2003;22(8):1846–1856. doi: 10.1093/emboj/cdg179. [DOI] [PMC free article] [PubMed] [Google Scholar]
- 21.Sims RJ, III, et al. Recognition of trimethylated histone H3 lysine 4 facilitates the recruitment of transcription postinitiation factors and pre-mRNA splicing. Mol Cell. 2007;28(4):665–676. doi: 10.1016/j.molcel.2007.11.010. [DOI] [PMC free article] [PubMed] [Google Scholar]
- 22.Ramalho-Santos M, Yoon S, Matsuzaki Y, Mulligan RC, Melton DA. “Stemness”: Transcriptional profiling of embryonic and adult stem cells. Science. 2002;298(5593):597–600. doi: 10.1126/science.1072530. [DOI] [PubMed] [Google Scholar]
- 23.Grskovic M, Chaivorapol C, Gaspar-Maia A, Li H, Ramalho-Santos M. Systematic identification of cis-regulatory sequences active in mouse and human embryonic stem cells. PLoS Genet. 2007;3(8):e145. doi: 10.1371/journal.pgen.0030145. [DOI] [PMC free article] [PubMed] [Google Scholar]
- 24.Gaspar-Maia A, et al. Chd1 regulates open chromatin and pluripotency of embryonic stem cells. Nature. 2009;460(7257):863–868. doi: 10.1038/nature08212. [DOI] [PMC free article] [PubMed] [Google Scholar]
- 25.Guzman-Ayala M, et al. Chd1 is essential for the high transcriptional output and rapid growth of the mouse epiblast. Development. 2015;142(1):118–127. doi: 10.1242/dev.114843. [DOI] [PMC free article] [PubMed] [Google Scholar]
- 26.Braren R, et al. Endothelial FAK is essential for vascular network stability, cell survival, and lamellipodial formation. J Cell Biol. 2006;172(1):151–162. doi: 10.1083/jcb.200506184. [DOI] [PMC free article] [PubMed] [Google Scholar]
- 27.Madisen L, et al. A robust and high-throughput Cre reporting and characterization system for the whole mouse brain. Nat Neurosci. 2010;13(1):133–140. doi: 10.1038/nn.2467. [DOI] [PMC free article] [PubMed] [Google Scholar]
- 28.Turner M, et al. Perinatal lethality and blocked B-cell development in mice lacking the tyrosine kinase Syk. Nature. 1995;378(6554):298–302. doi: 10.1038/378298a0. [DOI] [PubMed] [Google Scholar]
- 29.Cheng AM, et al. Syk tyrosine kinase required for mouse viability and B-cell development. Nature. 1995;378(6554):303–306. doi: 10.1038/378303a0. [DOI] [PubMed] [Google Scholar]
- 30.Wang D, et al. Phospholipase Cgamma2 is essential in the functions of B cell and several Fc receptors. Immunity. 2000;13(1):25–35. doi: 10.1016/s1074-7613(00)00005-4. [DOI] [PubMed] [Google Scholar]
- 31.Uhrin P, et al. Novel function for blood platelets and podoplanin in developmental separation of blood and lymphatic circulation. Blood. 2010;115(19):3997–4005. doi: 10.1182/blood-2009-04-216069. [DOI] [PubMed] [Google Scholar]
- 32.Saleque S, Cameron S, Orkin SH. The zinc-finger proto-oncogene Gfi-1b is essential for development of the erythroid and megakaryocytic lineages. Genes Dev. 2002;16(3):301–306. doi: 10.1101/gad.959102. [DOI] [PMC free article] [PubMed] [Google Scholar]
- 33.Srinivasan RS, et al. Lineage tracing demonstrates the venous origin of the mammalian lymphatic vasculature. Genes Dev. 2007;21(19):2422–2432. doi: 10.1101/gad.1588407. [DOI] [PMC free article] [PubMed] [Google Scholar]
- 34.Lim K-C, et al. Conditional Gata2 inactivation results in HSC loss and lymphatic mispatterning. J Clin Invest. 2012;122(10):3705–3717. doi: 10.1172/JCI61619. [DOI] [PMC free article] [PubMed] [Google Scholar]
- 35.Ruiz-Herguido C, et al. Hematopoietic stem cell development requires transient Wnt/β-catenin activity. J Exp Med. 2012;209(8):1457–1468. doi: 10.1084/jem.20120225. [DOI] [PMC free article] [PubMed] [Google Scholar]
- 36.Fraser ST, Isern J, Baron MH. Maturation and enucleation of primitive erythroblasts during mouse embryogenesis is accompanied by changes in cell-surface antigen expression. Blood. 2007;109(1):343–352. doi: 10.1182/blood-2006-03-006569. [DOI] [PMC free article] [PubMed] [Google Scholar]
- 37.Isern J, et al. Single-lineage transcriptome analysis reveals key regulatory pathways in primitive erythroid progenitors in the mouse embryo. Blood. 2011;117(18):4924–4934. doi: 10.1182/blood-2010-10-313676. [DOI] [PMC free article] [PubMed] [Google Scholar]
- 38.Kingsley PD, et al. “Maturational” globin switching in primary primitive erythroid cells. Blood. 2006;107(4):1665–1672. doi: 10.1182/blood-2005-08-3097. [DOI] [PMC free article] [PubMed] [Google Scholar]
- 39.de Bruijn MF, Speck NA, Peeters MC, Dzierzak E. Definitive hematopoietic stem cells first develop within the major arterial regions of the mouse embryo. EMBO J. 2000;19(11):2465–2474. doi: 10.1093/emboj/19.11.2465. [DOI] [PMC free article] [PubMed] [Google Scholar]
- 40.Schmitt TM, et al. Induction of T cell development and establishment of T cell competence from embryonic stem cells differentiated in vitro. Nat Immunol. 2004;5(4):410–417. doi: 10.1038/ni1055. [DOI] [PubMed] [Google Scholar]
- 41.Subramanian A, et al. Gene set enrichment analysis: A knowledge-based approach for interpreting genome-wide expression profiles. Proc Natl Acad Sci USA. 2005;102(43):15545–15550. doi: 10.1073/pnas.0506580102. [DOI] [PMC free article] [PubMed] [Google Scholar]
- 42.Li Y, et al. Inflammatory signaling regulates embryonic hematopoietic stem and progenitor cell production. Genes Dev. 2014;28(23):2597–2612. doi: 10.1101/gad.253302.114. [DOI] [PMC free article] [PubMed] [Google Scholar]
- 43.Sawamiphak S, Kontarakis Z, Stainier DYR. Interferon gamma signaling positively regulates hematopoietic stem cell emergence. Dev Cell. 2014;31(5):640–653. doi: 10.1016/j.devcel.2014.11.007. [DOI] [PMC free article] [PubMed] [Google Scholar]
- 44.Espín-Palazón R, et al. Proinflammatory signaling regulates hematopoietic stem cell emergence. Cell. 2014;159(5):1070–1085. doi: 10.1016/j.cell.2014.10.031. [DOI] [PMC free article] [PubMed] [Google Scholar]
- 45.Efroni S, et al. Global transcription in pluripotent embryonic stem cells. Cell Stem Cell. 2008;2(5):437–447. doi: 10.1016/j.stem.2008.03.021. [DOI] [PMC free article] [PubMed] [Google Scholar]
- 46.Lin CY, et al. Transcriptional amplification in tumor cells with elevated c-Myc. Cell. 2012;151(1):56–67. doi: 10.1016/j.cell.2012.08.026. [DOI] [PMC free article] [PubMed] [Google Scholar]
- 47.Nie Z, et al. c-Myc is a universal amplifier of expressed genes in lymphocytes and embryonic stem cells. Cell. 2012;151(1):68–79. doi: 10.1016/j.cell.2012.08.033. [DOI] [PMC free article] [PubMed] [Google Scholar]
- 48.de Boer J, et al. Transgenic mice with hematopoietic and lymphoid specific expression of Cre. Eur J Immunol. 2003;33(2):314–325. doi: 10.1002/immu.200310005. [DOI] [PubMed] [Google Scholar]
- 49.Padrón-Barthe L, et al. Clonal analysis identifies hemogenic endothelium as the source of the blood-endothelial common lineage in the mouse embryo. Blood. 2014;124(16):2523–2532. doi: 10.1182/blood-2013-12-545939. [DOI] [PMC free article] [PubMed] [Google Scholar]
- 50.Kumano K, et al. Notch1 but not Notch2 is essential for generating hematopoietic stem cells from endothelial cells. Immunity. 2003;18(5):699–711. doi: 10.1016/s1074-7613(03)00117-1. [DOI] [PubMed] [Google Scholar]
- 51.Boisset J-C, et al. Progressive maturation toward hematopoietic stem cells in the mouse embryo aorta. Blood. 2015;125(3):465–469. doi: 10.1182/blood-2014-07-588954. [DOI] [PMC free article] [PubMed] [Google Scholar]
- 52.Freshney RI, Paul J, Conkie D. Effect of erythropoietin on haemoglobin synthesis and haem synthesizing enzymes of mouse foetal liver cells in culture. J Embryol Exp Morphol. 1972;27(3):525–532. [PubMed] [Google Scholar]
- 53.Kessler JD, et al. A SUMOylation-dependent transcriptional subprogram is required for Myc-driven tumorigenesis. Science. 2012;335(6066):348–353. doi: 10.1126/science.1212728. [DOI] [PMC free article] [PubMed] [Google Scholar]
- 54.Teng T, Thomas G, Mercer CA. Growth control and ribosomopathies. Curr Opin Genet Dev. 2013;23(1):63–71. doi: 10.1016/j.gde.2013.02.001. [DOI] [PubMed] [Google Scholar]
- 55.Sachs M, et al. Bivalent chromatin marks developmental regulatory genes in the mouse embryonic germline in vivo. Cell Reports. 2013;3(6):1777–1784. doi: 10.1016/j.celrep.2013.04.032. [DOI] [PMC free article] [PubMed] [Google Scholar]
- 56.Holmes R, Zúñiga-Pflücker JC. 2009. The OP9-DL1 system: Generation of T-lymphocytes from embryonic or hematopoietic stem cells in vitro. Cold Spring Harb Protoc 2009(2):pdb.prot5156.
- 57.Oldham MC, Langfelder P, Horvath S. Network methods for describing sample relationships in genomic datasets: Application to Huntington’s disease. BMC Syst Biol. 2012;6:63. doi: 10.1186/1752-0509-6-63. [DOI] [PMC free article] [PubMed] [Google Scholar]
- 58.Johnson WE, Li C, Rabinovic A. Adjusting batch effects in microarray expression data using empirical Bayes methods. Biostatistics. 2007;8(1):118–127. doi: 10.1093/biostatistics/kxj037. [DOI] [PubMed] [Google Scholar]
- 59.Huang W, Sherman BT, Lempicki RA. Systematic and integrative analysis of large gene lists using DAVID bioinformatics resources. Nat Protoc. 2009;4(1):44–57. doi: 10.1038/nprot.2008.211. [DOI] [PubMed] [Google Scholar]
- 60.Merico D, Isserlin R, Stueker O, Emili A, Bader GD. Enrichment Map: A network-based method for gene-set enrichment visualization and interpretation. PLoS ONE. 2010;5(11):e13984. doi: 10.1371/journal.pone.0013984. [DOI] [PMC free article] [PubMed] [Google Scholar]
- 61. Zeller KI, Jegga AG, Aronow BJ, O’Donnell KA, Dang CV (2003) An integrated database of genes responsive to the Myc oncogenic transcription factor: Identification of direct genomic targets. Genome Biol 4(10):R69. [DOI] [PMC free article] [PubMed]
Associated Data
This section collects any data citations, data availability statements, or supplementary materials included in this article.