

Significance
V(D)J recombination is essential for assembling immunoglobulin and T-cell receptor genes. The lymphoid-specific RAG recombinase proteins (RAG1 and RAG2) perform DNA cleavage at recombination signal sequences (RSSs) during V(D)J recombination. Although RAG-mediated DNA cleavage has been analyzed in bulk, it has not at the single-molecule level. We used singly tethered DNA particle motion to examine the process in real time. We have found that RAG–RSS binding is reversible, with measurable dwell times before release. We also directly observed a reversible synaptic complex before RAG-mediated hairpin formation and measured its dwell time. These biochemical findings are compatible with a model for V(D)J recombination in vivo, in which the RAG recombinase often samples multiple partner RSSs before initiating the V(D)J recombination reaction.
Keywords: V(D)J recombination, recombination-activating gene, single molecule
Abstract
The recombination-activating gene products, RAG1 and RAG2, initiate V(D)J recombination during lymphocyte development by cleaving DNA adjacent to conserved recombination signal sequences (RSSs). The reaction involves DNA binding, synapsis, and cleavage at two RSSs located on the same DNA molecule and results in the assembly of antigen receptor genes. We have developed single-molecule assays to examine RSS binding by RAG1/2 and their cofactor high-mobility group-box protein 1 (HMGB1) as they proceed through the steps of this reaction. These assays allowed us to observe in real time the individual molecular events of RAG-mediated cleavage. As a result, we are able to measure the binding statistics (dwell times) and binding energies of the initial RAG binding events and characterize synapse formation at the single-molecule level, yielding insights into the distribution of dwell times in the paired complex and the propensity for cleavage on forming the synapse. Interestingly, we find that the synaptic complex has a mean lifetime of roughly 400 s and that its formation is readily reversible, with only ∼40% of observed synapses resulting in cleavage at consensus RSS binding sites.
V(D)J recombination is responsible for assembling the variable regions of antigen receptor genes during B- and T-lymphocyte development. During V(D)J recombination, fragments of V, D, and J segments located together on particular chromosomes are rearranged into functional V(D)J or VJ alleles that are the specificity determinants for B-cell receptors or immunoglobulins (Igs) and T-cell receptors (TCR) (1). Adjacent to the V, D, and J gene segments are recombination signal sequences (RSSs) consisting of a conserved heptamer (consensus 5′-CACAGTG-3′) and nonamer (consensus 5′-ACAAAAACC-3′) separated by a spacer of 12 or 23 bp (referred to as 12RSS and 23RSS, respectively). Efficient recombination requires one 12RSS and one 23RSS, a constraint known as the 12/23 rule (1).
The recombination-activating genes, RAG1 and RAG2, encode proteins that carry out V(D)J recombination by bringing a 12RSS and a 23RSS together into a paired (or synaptic) complex, nicking the RSS sites adjacent to the heptamer, and converting each nick into a double-strand break, leaving a hairpin at the coding end (Fig. 1). The hairpin is created by nucleophilic attack on the opposing strand by the 3′ hydroxyl group at the nick in a transesterification reaction. After RAG1/2 forms hairpins, it recruits the nonhomologous end joining machinery to repair the ends (1, 2). Since their discovery, the full-length RAG1 and RAG2 proteins have proven difficult to isolate and study in vitro (1). However, core domains (referred to as RAG1c and RAG2c) have been identified by removing a large region from the N terminus of RAG1 (which includes an E3 ubiquitin ligase domain) and a large region from the C terminus of RAG2 (which includes a plant homeodomain) (3, 4). These core proteins have been shown to tetramerize to form RAG1/2c, which retains RSS binding, nicking, and hairpin formation activities (5). High-mobility group-box protein 1 (HMGB1) acts as a cofactor and increases RAG1/2c affinity for the 23RSS (6). HMGB1 is required for paired complex formation and efficient conversion of RAG-mediated nicks into hairpins (7–10).
Fig. 1.

Orchestration of V(D)J cleavage. (A) Schematic of key molecules in the V(D)J recombination process and nomenclature used throughout the paper. (B) During the cleavage phase of V(D)J recombination, RAG1/2c and HMGB1 bind and nick a 12RSS (magenta) and a 23RSS (yellow) spaced by a distance known as the intersignal distance. Then, the two RSSs are brought together, forming a looped paired complex. While in the paired complex state, hairpins are produced only in the presence of a 12RSS and a 23RSS, which is known as the 12/23 rule. *The stoichiometry of RAG1/2c and HMGB1 involved in forming the paired complex is unknown.
Current in vitro assays that capture the paired complex with RAG1/2c generally place a 12RSS and a 23RSS on two different DNA molecules, typically short oligonucleotides. However, in vivo, antigen receptor loci are assembled using RSSs on the same DNA molecule (1, 11). One prior study captured RAG1/2c and HMGB1 bound to DNA with a 12RSS and a 23RSS on the same substrate using standard bulk assays (12). However, many key mechanistic questions remain unresolved concerning how a diverse immune repertoire is generated by the RAG recombinase. How long does an RAG complex spend bound to a 12RSS or a 23RSS? What is the lifetime of an RAG-mediated paired complex formed between a 12RSS and a 23RSS before DNA double-strand break (hairpin) formation? Is formation of this complex reversible, or does it inevitably go on to cleavage? These issues have implications for the mechanisms that determine Ig and TCR repertoires.
To address these questions, we have explored the dynamics of various stages of the V(D)J recombination cleavage reaction on single DNA molecules in real time, allowing visualization and characterization of individual RAG–HMGB1–RSS complexes and paired complex formation using intersignal distances comparable with some of the shorter distances found in the assembly of V, D, and J gene segments in vivo (13). Using a tethered particle motion (TPM) assay (14), we observed RSS-dependent apparent shortening of DNA in the presence of RAG1/2c, probably a reflection of bending of the DNA, and were able to exploit this shortening as a signature of the RAG1/2c–RSS-bound state (Fig. 2A). This technique in conjunction with a statistical mechanical model of RAG binding have allowed us to determine single-molecule binding constants for RAG1/2c with or without HMGB1 (Fig. 2 A and B). These measurements are also used to determine the dwell time distributions for the 12RSS and 23RSS protein bound states. Furthermore, this same substrate length readout is used for direct detection of the paired complex before DNA cleavage (Fig. 2C), because bringing the two RSSs into close proximity effectively shortens the tether. We find that formation of the paired complex results in one of two outcomes: either the DNA is cleaved, causing bead release from its tether, or the complex dissociates, leaving the DNA template intact. Finally, we use bead loss on cleavage to quantify the time dependence of cleavage on the concentrations of RAG1/2c and HMGB1 (Fig. 2D). These experiments provide a quantitative picture of the stages leading up to DNA cleavage during V(D)J recombination and reveal the dynamic nature of the paired complex.
Fig. 2.
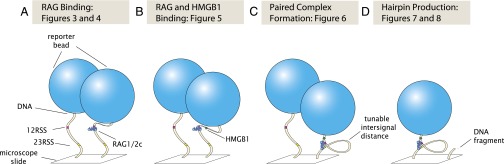
Steps of V(D)J cleavage investigated by TPM in this study: RAG binding, RAG–HMGB1 binding, paired complex formation, and hairpin production. Schematic of constructs and experimental measurements to examine the V(D)J recombination cleavage reaction at various stages. (A) RAG1/2c binding to the 12RSS or the 23RSS site alone. (B) RAG1/2c binding to the 12RSS or the 23RSS site in the presence of HMGB1. (C) RAG1/2c binding to DNA substrates containing 12RSS and 23RSS for the purposes of observing formation of a looped paired complex. (D) Bead loss caused by DNA cleavage as a result of 12/23 rule-regulated hairpin production.
Results
Detecting Single RAG–RSS Complexes in Real Time.
We have used a single-molecule assay called TPM to capture RAG1/2c–12RSS or RAG1/2c–23RSS complexes. This technique has been previously used in many studies of genome dynamics (15–17); it exploits the relationship between DNA length and rms motion of a bead to detect length changes in the DNA that is tethered to the bead (Fig. S1) (14). Fig. 2 introduces the various microscopic states that we seek to observe in the context of our single-molecule experiments. We explore the properties of RAG1/2c–DNA interaction for molecules harboring no RSS (referred to as “NoRSS”), only the 12RSS, only the 23RSS, and both 12RSS and 23RSS together using coexpressed and copurified maltose binding protein-tagged RAG1/2c proteins from a mammalian cell line in a buffer that includes 2.5 mM Mg2+ and 5% (vol/vol) DMSO.
To address the question of how the RAG proteins interact with different constellations of RSS sites, we added RAG1/2c at concentrations between 1 and 50 nM to the various DNA constructs to explore the situation indicated schematically in Fig. 2A. We found that, even at a saturating concentration of 50 nM RAG1/2c, without an RSS binding site, there was no measurable change in the mean rms motion of the bead (Fig. S2 D and J). In contrast, addition of purified RAG1/2c to tethered DNA harboring only a single 12RSS or 23RSS binding site resulted in periods of measurable reduction in the rms motion of the tethered beads (example trace in Fig. 3). These rms measurements are reported in terms of effective tether length (in base pairs) corresponding to the tether length that would produce the observed rms motion in the absence of protein; the calibration curve for this conversion is shown in Fig. S1C. As such, we interpret these periods of reduced rms motion to be binding events that change the effective tether length by 64 ± 5 bp for a single 12RSS binding site and 57 ± 5 bp for a single 23RSS binding site (Fig. S2 E, F, and J). In Fig. 4A, this reduction in DNA tether length is visible in histograms of measured tether length for each RAG1/2c concentration for both a single 12RSS or a single 23RSS (corresponding example bead trajectories are shown in Fig. S2 A and B). As can be seen in Fig. 4A, at low RAG1/2c concentrations, the tethers were typically measured at full length (539 bp), indicating that the tethers were not bound by protein. However, as the concentration of RAG1/2c was increased, a shorter bound state (at 475 ± 5 bp for the 12RSS and 482 ± 5 bp for the 23RSS) dominated the histogram. Mechanistically, we assume that the binding of these proteins bends the DNA, changing its effective length. The lesser reduction in length for the 23RSS may be caused by a reduced bend angle as previously observed (18). With both the 12RSS and 23RSS present, additional shortening of the tether beyond that with a single RSS present could result from either formation of the paired complex or the presence of two separate bound complexes, each of which contributes to the overall shortening separately. We explore the case with two RSSs in the presence of RAG1/2c alone in Fig. S2 G–J.
Fig. 3.
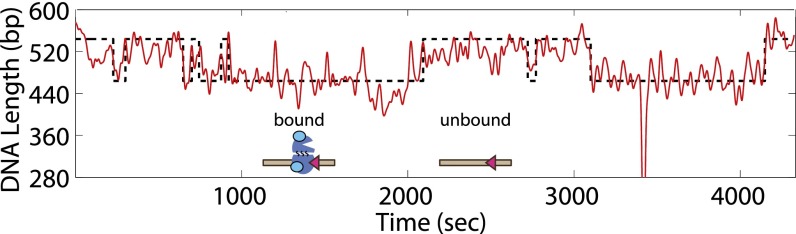
Dynamic RAG binding to a single RSS. Example trajectory of a 539-bp DNA-tethered bead in the presence of 5 nM RAG1/2c (cyan) as it transitions between unbound (characterized by longer apparent lengths) and bound (characterized by shorter apparent lengths) states on a single 12RSS (magenta).
Fig. 4.

Detecting and determining the binding properties of a single RAG–RSS complex. (A) Single DNA molecules containing a 12RSS or a 23RSS site are tethered to a microscope coverslip, and RAG1/2c is titrated from 1 to 50 nM, permitting the observation of concentration-dependent shortening in the presence of RSSs. The number of bead trajectories in each sample is shown in each histogram. (B) Binding probability as a function of RAG1/2c concentration. Two Gaussians are fit to each distribution (1–50 nM) shown in A, and the probability of being shortened as a function of RAG1/2c is plotted. The data are then fit using the statistical mechanical model described in SI Text. (C) Mean dwell times of individual RAG1/2c–RSS complexes (black, 12RSS; red, 23RSS) in both the on (or bound; circles) or off (unbound; squares) state. Binding events occurred with similar frequency independent of binding site identity; however, the time bound to 12RSS was nearly two times that of 23RSS. Error bars represent SEs calculated from bootstrap resampling.
Making use of this method to measure the binding of RAG1/2c to its RSS target, we compiled single-molecule trajectories to determine the probability of being bound (shortened tether) as a function of RAG1/2c concentration. Our goal in doing so was to determine the equilibrium dissociation constant (Kd) for the 12RSS and the 23RSS. Fig. 4A already gives us an intuitive feel for Kd by estimating the concentration at which the two peaks have equal weight (and thus, the concentration where either of these two states is equally likely). More formally, we used a statistical mechanical model of binding (19, 20) to extract the relevant Kd values taking into account the binding histograms over the entire concentration range. In this case, for the 12RSS site, we found Kd = 13.9 ± 4.7 nM, which is within error of a previously reported value of 14.5 ± 2.4 nM (21) and less than the only other measured value of Kd = 25.0 ± 5.0 nM derived from bulk experiments (22). We found that the 23RSS site binds RAG1/2c considerably more weakly, with a Kd = 44.4 ± 6.5 nM (Fig. 4B). To the best of our knowledge, the Kd for the 23RSS has not been previously reported. The error bars on this measurement represent the 95% confidence interval of a least-squares fit to the data in Fig. 4B.
Binding Kinetics Reveal Mean Dwell Time of RAG–RSS Complex.
To better understand the kinetics of the binding of RAG1/2c to the 12RSS or 23RSS, we measured the average dwell time of the tether in both the bound and unbound states as a function of RAG concentration. Analyzing the same trajectories used to obtain the Kd (where mean occupation probability is analyzed), we, instead, segmented each individual trace into bound and unbound states using a thresholding method to characterize the kinetics of binding/unbinding events of RAG1/2c to an RSS target site. An example of a segmented trace is shown in Fig. 3, where the red line is the rms trajectory of the bead and the black dashed line is the resulting segmentation between long and short states of the DNA tether.
It was of particular interest to establish the length of time that a molecule of RAG1/2c stays bound on a DNA molecule before dissociating. We, therefore, examined the mean time that an RSS was bound to an RAG1/2c complex or in the unbound state as a function of concentration. In Fig. 4C, the mean dwell time in the bound (circles) and unbound (squares) states is shown for a concentration range between 1 and 50 nM for RAG1/2c. There are several interesting features visible in these data. The dwell time in the bound state is roughly independent of concentration. As one might expect because of the differences in affinity, the time that RAG1/2c spends bound at its target was most strongly influenced by the identity of the target to which it binds, with a 430 ± 120 s dwell time when bound to a 12RSS (black circles) and a dwell time of 230 ± 80 s on a 23RSS (red circles). In contrast, the time spent in the unbound state was a strong function of RAG1/2c concentration and was not influenced by the identity of the target binding site itself (Fig. 4C). The full dwell time distributions for both the bound and unbound states are shown for 12RSS and 23RSS in Fig. S3A.
Assuming that binding is limited by diffusion, the theoretical prediction for time to reach a target scales as the inverse of the concentration, 1/(αc), where c is the concentration and α is a constant of proportionality related to the diffusivity of the particle and size of the target. In this case, we found α = (2.5 ± 0.5) × 10−4 (s nM)−1. Interestingly, this number is roughly three orders of magnitude lower than one might expect for simple diffusion of a molecule with a hydrodynamic radius of a few nanometers to a target of similar size; although simple diffusive theory predicts that these binding events should be observed at picomolar concentrations, instead, we find that they occur at nanomolar concentrations. However, working concentrations at the nanomolar scale are typical in all studies of V(D)J recombination and not unique to our assay, which probably reflects the complicated nature of the RAG1/2c complex. It is possible that this discrepancy is partially related to the fact that the purified RAG1/2c is not homogeneous and certainly contains some fraction of inactive or nonheterotetrameric protein. The presence of an inactive fraction of protein would shift the measured required concentrations for binding in a direction consistent with the observed trends. A possible second reason for this discrepancy is that this simple model assumes that the DNA is a perfect absorber, with no constraints on molecular orientation, whereas in reality, the binding process is probably topologically more stringent. SI Text has additional discussion of these matters.
HMGB1 Alters the Binding Properties of RAG–RSS Complexes.
In the process of V(D)J DNA cleavage, the RAG proteins do not act in isolation. For the purposes of probing the dynamics of hairpin formation, we must account for the role of HMGB1 (23) as shown in Fig. 2B. To that end, we wished to build on our analysis by investigating how HMGB1 altered RAG1/2c–RSS-induced binding (Fig. 5). However, this measurement presented a challenge in that the presence of HMGB1 altered the measured DNA length, even in the absence of RAG1/2c or RSS binding sites. Depending on the concentration of HMGB1 and the length of the substrate used, we observed up to 50% compaction of the DNA substrate (the rms of the bead was reduced to that expected from a tether of one-half the actual length). Fig. S4C shows this effect in our experiments. In the face of these condensing effects, it was imperative to verify that we could still use the TPM assay described above to measure additional RAG–RSS-dependent shortening. Fig. 5D shows a histogram of bead position over 1 h in the presence of 25 nM HMGB1 and varying concentrations of RAG1/2c (between 1 and 50 nM). A shift in effective tether length is observed as RAG1/2c is titrated in the presence of HMGB1; at low concentration, the beads exhibit a long state associated with an unbound tether, and as the concentration is increased, a shorter state associated with RAG1/2c binding to available RSS binding sites begins to dominate. Here, we add 50 nM RAG1/2c both with (Fig. 5B, blue bars) and without (Fig. 5B, gray bars) 25 nM HMGB1 (Fig. 5B, red bars) to the DNA substrates shown in Fig. 5A and find the mean length of a tether by fitting a Gaussian to the appropriate position histogram (like those in Fig. 5D). Thus, we observe that HMGB1 alters the reduction in DNA tether length for RAG1/2c alone from 64 ± 5 bp and 57 ± 5 bp for a single 12RSS and 23RSS to 101 ± 8 bp and 132 ± 4 bp, respectively.
Fig. 5.

Detecting and determining the binding properties of RAG–RSS complexes in the presence of HMGB1. (A) A schematic of DNAs with NoRSS, 12RSS (magenta), and 23RSS (yellow). (B) Change in effective DNA length; 50 nM RAG1/2c with (blue) or without (gray) 25 nM HMGB1 (red) was added to the DNA substrates shown in A. (C) Binding probability as a function of protein concentration. Two Gaussians are fit to each distribution (1–50 nM RAG1/2c and 25 nM HMGB1 as seen in D), and the probability of being shortened as a function of both RAG1/2c and HMGB1 is plotted. (D) To calculate Kd for 12RSS and 23RSS in the presence of 25 nM HMGB1, single DNA molecules containing a 12RSS or a 23RSS site were tethered, and RAG1/2c from 1 to 50 nM was titrated in the presence of 25 nM HMGB1. Concentration-dependent shortening in the presence of RSSs was subsequently measured. The number of bead trajectories in each sample is shown in each histogram, and the dotted black line is the effect of RAG1/2c alone.
We exploit this observable difference in the reduction in DNA tether length to determine the Kd for the 12RSS and the 23RSS in the presence of RAG1/2c and HMGB1 using the methods described above. One crucial caveat in the approach here is that the bound state under these conditions was very stable, and in most trajectories, we no longer see robust switching between the states, making a measurement of the kinetic parameters impossible. However, assuming that the measured state of a given tether is a representation of the overall bulk probability of being found in either of two states, we can still calculate Kd using the thermodynamic model introduced earlier. We find that, for RAG1/2c plus HMGB1, the Kd values for the 12RSS and the 23RSS are both less than RAG1/2c alone: Kd = 4.1 ± 1.6 nM and Kd = 8.8 ± 4.0 nM for the 12RSS and the 23RSS, respectively (Fig. 5C). The presence of HMGB1 greatly enhances the binding of RAG1/2c to both the 12RSS and the 23RSS (Fig. 5B and Fig. S4B), which is consistent with previous studies (6, 24–26). We also find the Kd values for the 12RSS and the 23RSS in the presence of RAG1/2c and HMGB1 are within error of Kd values previously reported that were derived from the turnover number (kcat) (27).
Direct Observation of Paired Complex Formation.
The paired complex is predicted to form before hairpin production (observed as bead loss in our experiments). To determine if we could observe the paired complex before bead release, we tracked beads attached to a 12RSS/23RSS substrate with intersignal spacing (distance between two RSSs) of either 1,200 or 1,800 bp in the presence of 5 nM RAG1/2c and 80 nM HMGB1 for 1 h (Fig. 6A). The logic of using two different intersignal spacings was that they have characteristically different Brownian motion signatures if, indeed, we are observing the paired complex. To be precise, a paired complex that forms on either of these two substrates (which have identical overall lengths of 2,900 bp) and loops out the intersignal DNA plus the 20% reduction in DNA length caused by 80 nM HMGB1 (Fig. S4C) should display distinctly different DNA lengths of 1,360 bp for the 1,200-bp intersignal substrate and 880 bp for the 1,800-bp intersignal substrate (calculation in SI Text, Computing the Predicted DNA Length for the Paired Complex), allowing us to be certain that an observed shortening event is coming from a paired complex connecting the RSS sites as shown schematically in Fig. 6A. Furthermore, as a control, we performed the same experiment on the NoRSS and 12RSS substrates, where we would not expect to see paired complex formation. Indeed, on these control substrates, we did not see any instances of the paired complex state.
Fig. 6.

Capturing the dynamics of paired complex formation. (A) Schematic of the DNA substrates used to investigate the dynamics of paired complex formation. The use of different lengths results in different characteristic TPM signatures on paired complex formation. (B) TPM trajectories showing the dynamics of paired complex formation. The green trajectory is from the substrate where 12RSS and 23RSS are separated by 1,200 bp, and the blue trajectory is from the substrate with 1,800-bp separation. The dashed colored lines are the expected tether lengths in base pairs for paired complex formation, where the DNA between the RSS sites is looped out. Each sample trajectory terminates in a state corresponding to the correct length for a paired complex before a cleavage event resulting in bead loss. For the 1,200-bp substrate, a complex that does not result in cleavage is seen earlier in the trajectory. (C) Lifetimes of the paired complex for the case in which the complex forms reversibly (red) and the case where the paired complex is the terminal state before bead release (black). Insets show the predicted DNA tether length of the paired complex (blue dotted line) and a histogram of the effective DNA tether length for the 1,200- and 1,800-bp DNA substrates. (D) Histogram of bead loss events showing the fraction of beads lost, the fraction of beads lost passively, and those lost as a result of paired complex formation for the NoRSS, 12RSS, 12RSS/23RSS–1,200 bp, or 12RSS/23RSS–1,800 bp substrates.
An example of the observed trajectories is shown in Fig. 6B, where the paired complex state can be seen as the existence of a shortened state in several trajectories for both 1,200- (traces in Fig. 6B) and 1,800-bp intersignal spacing (trajectories in Fig. S5). These states end in one of two fates: (i) a cutting event, where the DNA is cleaved and the bead immediately leaves the field of view (i.e., the bead does not transition back to the unlooped length before release), or (ii) a return to the previous unlooped state, implying that the tether was not cleaved (the bead returns to the unlooped length, although it may be cleaved later either passively or after another complex formation). As a technical note, some observed paired complexes do not resolve to one of these two fates during the timeframe of our experiment. To avoid systematic exclusion of longer paired complex states, these cases are included in the following figures and analysis and classified as being uncleaved. In Fig. 6C, Insets, we show the histograms of median effective DNA tether length (in base pairs) for these states (black indicates cleaved complexes and red indicates no cleavage in Fig. 6C) for both substrates. Here, it is clear that the DNA tether length of the observed short state depends on the length of intersignal spacing between RSSs. Furthermore, the effective DNA tether length of the paired complex state agrees with the predicted length, assuming that the substrate had shortened by 1,200 or 1,800 bp, and the remaining DNA is compacted 20% by HMGB1 (as expected from Fig. S4C). Histograms of the dwell time in the paired complex for states ending in cleavage (black) and no cleavage (red) are shown in Fig. 6C. The dwell times are relatively short, with a mean of roughly 400 s (although we did rarely observe paired complex dwell times of thousands of seconds), and it can be seen that roughly 40% of all observed paired complex states are cleaved. Furthermore, we only include states that last 60 s or more, and therefore, this value of the average time is likely an overestimate. In Fig. S6, the correlation between dwell time and median dwell length is shown for each observed instance of the paired complex. From this, we determined that the infrequent long dwell times had a dwell length consistent with instances of the paired complex capable of cleavage and were not anomalous in terms of dwell length. One interesting point that arises in these measurements is shown in Fig. 6D. Here, we show a histogram of the probability of bead loss for the 12RSS/23RSS (1,200 and 1,800 bp, respectively), 12RSS only, and NoRSS substrate (that is, the probability that a bead will be lost during the course of the experiment). There are two clear mechanisms for bead loss in our experiments: the DNA cleavage event that follows from paired complex formation or passive events that are unrelated to 12/23 rule-regulated cleavage. For the NoRSS and 12RSS substrates, the rates of bead loss were roughly the same, and we attribute such events to this passive form of bead loss. However, for the 12RSS/23RSS substrates, there is a population of bead loss events that is immediately preceded by a measurable paired complex (black in the histogram bars in Fig. 6D). Furthermore, the substrates with both RSS sites lost more beads than the control substrates in traces without a paired complex signature (i.e., the blue bar in Fig. 6D is bigger with both RSS sites present). We cannot say unequivocally the reason for this, but it might be because of either (i) paired complex formation and excision of the looped DNA faster than we can resolve with our method or (ii) a pathway for cutting that does not require the two RSS sites to synapse.
Dynamics of 12/23 Rule-Regulated Bead Release as a Function of RAG1/2c and HMGB1.
To quantify the concentration dependence of the molecular players on the rate of RAG-mediated DNA cleavage (shown schematically in Fig. 7A), we observed a population of beads and determined how many were left in the field of view as a function of time. We examined 70–80 DNA-tethered beads with a 12RSS/23RSS binding site substrate and compared the bead release with that with only one or the other RSS. To control for passive bead release, we also performed a control measurement on DNA-tethered beads lacking any RSS binding site but with the RAG1/2c and HMGB1 proteins present in the same concentrations. After subtracting passive bead release, significant bead release only occurs in the case where both a 12RSS and a 23RSS are present simultaneously, confirming 12/23 rule-regulated cleavage in our single-molecule assay (Fig. 7B). No other combination of RSS sites on our DNA substrate (12RSS, 23RSS, 12RSS/12RSS, and 23RSS/23RSS) produced significant bead release (Fig. 7B).
Fig. 7.

The 12/23 rule-regulated bead release as a function of HMGB1 concentration. (A) A schematic of the assay to measure 12/23 rule-regulated hairpin production by bead release in the TPM assay. (B) Bead release percentage for substrates containing different combinations of RSSs. (C) Schematic of 12RSS/23RSS and 12SS–12RSS/23RSS substrates used in D. (D) Bead release as a function of HMGB1 concentration in the presence of 5 nM RAG1/2c for 12RSS/23RSS and 12RSS–12RSS/23RSS DNA substrates. The upper axis corresponds to the percentage of nonspecific DNA compaction at that concentration of HMGB1. The percentage of bead loss for the 12RSS/23RSS was determined as % loss = fRSS − fNoRSS, where fRSS is the fraction of beads lost with RSSs present and fNoRSS is the fraction of beads lost with no RSSs present. The percentage of nonspecific DNA compaction is derived from the change in rms at different HMGB1 concentrations on the NoRSS DNA substrate (Fig. S4C). Significant bead release was only detected in the presence of a 12RSS/23RSS substrate.
How do all of these results depend on the quantity and identity of the relevant proteins? The dependence of these results on HMGB1 concentration is shown in Fig. 7D. In particular, we observed an increase in the frequency of RAG1/2c-mediated 12RSS/23RSS bead release with increasing concentrations of HMGB1 between 5 and 500 nM. We also found that hairpin production in a bulk assay (Fig. S7A) and bead release in our single-molecule assay (Fig. S7 B and C) required catalytically active RAG1/2c, consistent with previous bulk analyses (1).
We were also interested to see if there was additional bead release activity in the presence of more than one 12RSS as a first in vitro step toward the cellular situation in which there are multiple RSSs. The red circles in Fig. 7D show the measured bead release when a second 12RSS site is added to the DNA substrate as depicted in Fig. 7C. In this case, where there are now two configurations for 12RSS/23RSS hairpin production, bead release is increased, although it seems to saturate at roughly 30%, similarly to that with the standard 12RSS/23RSS substrate.
One interesting parameter that governs the frequency of bead release is the distance between the two RSSs. Bead release activity can be ablated by decreasing inter-RSS separation from 137 to 73 bp (Fig. S7 D and E), which would be predicted to interfere with RSS synapsis (28) and has been shown to reduce cleavage in biochemical assays (29). Notably, the block to bead release imposed by the 73-bp intersignal distance is overcome when Mn2+ is used in place of Mg2+ in the reaction buffer (Fig. S7F). Mn2+, unlike Mg2+, allows hairpin formation in the absence of paired complex formation (30). Overall, these results regarding the combination of RSSs, reaction conditions, and intersignal distance required for bead release are in close agreement with results from bulk studies of RAG-mediated DNA cleavage and provide additional confidence that bead release is the result of hairpin formation in the paired complex.
Fig. 8 shows the time evolution of bead release over 2 h for three different concentrations of RAG1/2c (1, 5, and 25 nM) and a range of HMGB1 concentrations between 5 and 500 nM. First, we see that nearly all release activity occurred in the first 1 h with at least 5 nM RAG1/2c, a concentration similar to Kd for both 12RSS and 23RSS in the presence of HMGB1 (Fig. 5D). Second, the resulting bead release dynamics seemed to fall broadly into one of two categories: bead release occurs quickly over the first 1 h before saturating around 30% (for instance, at 5 nM RAG1/2c with 225 or 500 nM HMGB1 or 25 nM RAG1/2c with 50, 225, or 500 nM HMGB1), or bead release is not strongly observed and stalls below 10% (as is the case for the lowest two concentrations of HMGB1, regardless of RAG concentration, and the lowest RAG concentration). Furthermore, at 25 nM RAG1/2c, both RSSs should be occupied, but we do not observe an inhibition in bead release. High RAG protein concentrations have previously been shown to inhibit synapsis and hairpin formation using oligonucleotide RSS substrates (31).
Fig. 8.

Dynamics of 12/23 rule-regulated bead release at 1, 5, and 25 nM RAG1/2c concentrations. (A) Bead release observed at 1 nM RAG1/2c and 5 (purple), 25 (green), 50 (blue), 225 (brown), and 500 nM (black) HMGB1 over a 2-h window. Bead loss at (B) 5 nM RAG1/2c and (C) 25 nM RAG1/2c at the same HMGB1 concentrations in A.
Discussion
V(D)J recombination is one of the most intriguing examples of genome dynamics, with many questions regarding its mechanistic underpinnings remaining unanswered. We have addressed some of these using a single-molecule assay that makes it possible to capture individual RAG-mediated cleavage reactions from start to finish in real time, revealing important parameters of DNA binding and cleavage by RAG and HMGB1. We observe an apparent reduction in DNA length on RSS binding by RAG in the absence of HMGB1, which agrees with previous work showing that RAG proteins alone bend DNA at RSSs (18). This calculation provided a Kd for the RAG–RSS interaction. We anticipate that our single-molecule approach could be used to measure Kd values for nonconsensus RSSs, thereby providing a more complete understanding of the relationship between RSSs and RAG activity. Indeed, in preliminary studies, we have already seen that concentrations of RAG that saturate consensus RSSs show significantly reduced binding to nonconsensus RSSs derived from the Ig heavy-chain locus.
This approach has also allowed a first determination of the mean dwell time for the RAG1/2c complex bound to either a 12RSS or a 23RSS. We find that the RAG1/2c–RSS complex is quite stable, with dwell times on the order of several minutes. In particular, we found that the complex stayed bound longer at 12RSS (∼430 s) compared with 23RSS (∼230 s), consistent with the difference in Kd between the two sites; the measured difference in Kd between 12RSS and 23RSS is consistent with the idea that changing the binding site primarily changes the stability of the complex and not the time that it takes to bind the RSS target (Kd12RSS/Kd23RSS ∼ kbound23RSS/kbound12RSS), where kbound is the off-rate for unbinding from the RSS.
We found that HMGB1 increases the reduction in DNA length of an RAG–RSS complex. This observation is consistent with the HMGB1 dependence of the large bends detected in 12RSS–RAG–HMGB1 or 23RSS–RAG–HMGB1 complexes, although those studies used short oligonucleotide substrates (25, 26). We also used this reduction in DNA tether length to determine the Kd for the 12RSS and the 23RSS in the presence of RAG1/2c and HMGB1 and found that HMGB1 decreased both Kd values compared with RAG1/2c alone and that they were similar, consistent with previous observations (6, 27). Our single-molecule assay to study HMGB1-dependent processes could be extended to study other proteins other than RAG1/2c, which has binding to DNA that is also facilitated by HMGB1 (for example, the tumor suppressor protein p53) (32).
At the concentrations of RAG1/2c and HMGB1 used in our experiments, the binding events associated with RAG1/2c in the presence (or absence) of HMGB1 were relatively frequent, but the downstream product of this binding (paired complex formation) was comparatively rare; in our experiments, a bead bound to DNA spends just 4% of the total observation time in the paired complex state. We directly observed paired complex formation on DNA substrates with both a 12RSS and a 23RSS. We do not see evidence of this complex when only a 12RSS (or no RSS) is present, and we confirm that the apparent length of the paired complex state is consistent with a tether that has been shortened by the 12/23 intersignal spacing of the substrate when using both a 1,200- and a 1,800-bp spacing. We did not determine if one or both RSSs were occupied before paired complex formation. Additional studies will be needed to resolve this important mechanistic question.
The paired complex was relatively short-lived, which is at odds with kinetic models derived from cleavage experiments with oligonucleotide RSS substrates that predict slow hairpin formation with a long-lived paired complex (27). Furthermore, the paired complex did not always result in a cleaved DNA product; only roughly 40% of paired complexes terminated in a DNA cleavage event. Note, however, that our dwell times and reversible paired complex were measured on naked DNA. By way of contrast, in vivo, histones and other DNA binding proteins are involved in V(D)J cleavage, and this fact could lead to differences from the in vitro results presented here. If this reversibility also occurs in vivo, the RAG recombinase could sample multiple RSSs adjacent to V or D gene segment partners after establishing the recombination center at the J gene segments of Ig and TCR loci, consistent with the results of previous in vivo studies (33–35). Sampling of multiple RSSs before recombination could influence the relative use of particular V(D)J or VJ alleles in the antigen receptor repertoire (33).
Finally, we studied RAG–HMGB1–RSS-mediated cleavage on the DNA by inferring successful hairpin formation observed as bead release events. With this assay, we quantified the relationship between bead release and the concentrations of RAG1/2c and HMGB1. We found that bead release was significantly enhanced on a substrate containing a 12RSS/23RSS pair, required catalytically active RAG, and was strongly inhibited when the intersignal distance was shortened beyond a certain point previously shown to inhibit RAG-mediated cleavage and V(D)J recombination. With these tools in hand, it is now possible to perform a number of systematic studies of the V(D)J reaction process. Our results already hint that both the number of RSSs and their distances conspire to alter recombination dynamics, and it will be of interest to determine the quantitative rules governing synapse and hairpin formation for the various 12/23 rule-regulated V, D, and J reactions that generate Igs and TCR genes during lymphoid development.
Methods
Maltose binding protein-tagged RAG1/2c and various mutants were individually or coexpressed and purified from suspension 293-E cells after a 48-h transfection. His-tagged HMGB1 was purified from BL21 cells after a 4-h isopropyl β-D-1-thiogalactopyranoside induction. The purified RAG1/2c and HMGB1 were characterized using in vitro bulk assays. TPM flow cells were assembled with DNA-tethered beads and calibrated to detect DNA length changes in molecules of a known length (Fig. S1C). DNA molecules with RSSs were tethered and tracked for roughly 500 s; then, RAG1c, RAG2c, RAG1/2c, and various mutants were added at 50 nM in the presence or absence of 25 nM HMGB1 and tracked for roughly 700 s to detect DNA shortening, a signature RAG–RSS complex formation. To determine Kd values, RAG1/2c (1, 2.5, 5, 10, 25, and 50 nM) with or without 25 nM HMGB1 was tracked for roughly 4,000 s in the presence of a single RSS. The concentration-dependent probability of being bound to an RSS was determined by fitting multiple Gaussians to the resultant distribution of each single-bead trajectory, and a fit to these data with the simple binding statistical mechanical model was performed to determine the Kd. We also used the waiting time distributions of the trajectories to determine the mean dwell time of RAG1/2c for the 12RSS or the 23RSS. We performed experiments to detect the paired complex by tracking DNA-tethered beads in the absence of protein for roughly 500 s and then, tracking a field of view for roughly 1 h. We directly observed individual paired complexes form and break down in real time as well as paired complexes that resulted in hairpin production. We used the trajectories from the paired complex data to determine the mean dwell time of hairpin productive or nonproductive paired complexes (complete methods in SI Methods). Finally, we developed single-molecule assays to detect hairpin production that uses bead release as a readout.
Supplementary Material
Acknowledgments
We thank members of the groups of D.G.S., D.B., and R.P. for helpful discussions and Caltech’s Protein Expression Center. We also thank Michael Anaya, Jesse Bloom, Mihai Ciubotaru, Hernan Garcia, Jeff Gelles, Stephanie Johnson, Heun Jin Lee, Martin Linden, Jim Maher, Pradeep Ramesh, Philippe Rousseau, Laurence Salome, Patrick Swanson, and Catherine Tardin for discussions. We were supported by NIH Grants R37AI32524 (to D.G.S.), DP10D000217 (Director’s Pioneer Award; to R.P.), and R01GM085286 (to R.P.); the Caltech–University of California, Los Angeles Joint Center for Translational Medicine (D.B.); the Sackler Foundation (D.B.); and La Fondation Pierre Gilles de Gennes (R.P.).
Footnotes
The authors declare no conflict of interest.
This article contains supporting information online at www.pnas.org/lookup/suppl/doi:10.1073/pnas.1503477112/-/DCSupplemental.
References
- 1.Schatz DG, Swanson PC. V(D)J recombination: Mechanisms of initiation. Annu Rev Genet. 2011;45:167–202. doi: 10.1146/annurev-genet-110410-132552. [DOI] [PubMed] [Google Scholar]
- 2.Lee GS, Neiditch MB, Salus SS, Roth DB. RAG proteins shepherd double-strand breaks to a specific pathway, suppressing error-prone repair, but RAG nicking initiates homologous recombination. Cell. 2004;117(2):171–184. doi: 10.1016/s0092-8674(04)00301-0. [DOI] [PubMed] [Google Scholar]
- 3.Gellert M. V(D)J recombination: RAG proteins, repair factors, and regulation. Annu Rev Biochem. 2002;71:101–132. doi: 10.1146/annurev.biochem.71.090501.150203. [DOI] [PubMed] [Google Scholar]
- 4.Jones JM, Simkus C. The roles of the RAG1 and RAG2 “non-core” regions in V(D)J recombination and lymphocyte development. Arch Immunol Ther Exp (Warsz) 2009;57(2):105–116. doi: 10.1007/s00005-009-0011-3. [DOI] [PubMed] [Google Scholar]
- 5.Swanson PC. The bounty of RAGs: Recombination signal complexes and reaction outcomes. Immunol Rev. 2004;200:90–114. doi: 10.1111/j.0105-2896.2004.00159.x. [DOI] [PubMed] [Google Scholar]
- 6.van Gent DC, Hiom K, Paull TT, Gellert M. Stimulation of V(D)J cleavage by high mobility group proteins. EMBO J. 1997;16(10):2665–2670. doi: 10.1093/emboj/16.10.2665. [DOI] [PMC free article] [PubMed] [Google Scholar]
- 7.Swanson PC. A RAG-1/RAG-2 tetramer supports 12/23-regulated synapsis, cleavage, and transposition of V(D)J recombination signals. Mol Cell Biol. 2002;22(22):7790–7801. doi: 10.1128/MCB.22.22.7790-7801.2002. [DOI] [PMC free article] [PubMed] [Google Scholar]
- 8.Bergeron S, Madathiparambil T, Swanson PC. Both high mobility group (HMG)-boxes and the acidic tail of HMGB1 regulate recombination-activating gene (RAG)-mediated recombination signal synapsis and cleavage in vitro. J Biol Chem. 2005;280(35):31314–31324. doi: 10.1074/jbc.M503063200. [DOI] [PMC free article] [PubMed] [Google Scholar]
- 9.Kriatchko AN, Bergeron S, Swanson PC. HMG-box domain stimulation of RAG1/2 cleavage activity is metal ion dependent. BMC Mol Biol. 2008;9:32. doi: 10.1186/1471-2199-9-32. [DOI] [PMC free article] [PubMed] [Google Scholar]
- 10.Zhang M, Swanson PC. HMGB1/2 can target DNA for illegitimate cleavage by the RAG1/2 complex. BMC Mol Biol. 2009;10:24. doi: 10.1186/1471-2199-10-24. [DOI] [PMC free article] [PubMed] [Google Scholar]
- 11.Lewis SM. The mechanism of V(D)J joining: Lessons from molecular, immunological, and comparative analyses. Adv Immunol. 1994;56:27–150. doi: 10.1016/s0065-2776(08)60450-2. [DOI] [PubMed] [Google Scholar]
- 12.Kumar S, Swanson PC. Full-length RAG1 promotes contact with coding and intersignal sequences in RAG protein complexes bound to recombination signals paired in cis. Nucleic Acids Res. 2009;37(7):2211–2226. doi: 10.1093/nar/gkp047. [DOI] [PMC free article] [PubMed] [Google Scholar]
- 13.Altschul SF, Gish W, Miller W, Myers EW, Lipman DJ. Basic local alignment search tool. J Mol Biol. 1990;215(3):403–410. doi: 10.1016/S0022-2836(05)80360-2. [DOI] [PubMed] [Google Scholar]
- 14.Finzi L, Gelles J. Measurement of lactose repressor-mediated loop formation and breakdown in single DNA molecules. Science. 1995;267(5196):378–380. doi: 10.1126/science.7824935. [DOI] [PubMed] [Google Scholar]
- 15.Manzo C, Zurla C, Dunlap DD, Finzi L. The effect of nonspecific binding of lambda repressor on DNA looping dynamics. Biophys J. 2012;103(8):1753–1761. doi: 10.1016/j.bpj.2012.09.006. [DOI] [PMC free article] [PubMed] [Google Scholar]
- 16.Mumm JP, Landy A, Gelles J. Viewing single lambda site-specific recombination events from start to finish. EMBO J. 2006;25(19):4586–4595. doi: 10.1038/sj.emboj.7601325. [DOI] [PMC free article] [PubMed] [Google Scholar]
- 17.Pouget N, Turlan C, Destainville N, Salomé L, Chandler M. IS911 transpososome assembly as analysed by tethered particle motion. Nucleic Acids Res. 2006;34(16):4313–4323. doi: 10.1093/nar/gkl420. [DOI] [PMC free article] [PubMed] [Google Scholar]
- 18.Pavlicek JW, Lyubchenko YL, Chang Y. Quantitative analyses of RAG-RSS interactions and conformations revealed by atomic force microscopy. Biochemistry. 2008;47(43):11204–11211. doi: 10.1021/bi801426x. [DOI] [PMC free article] [PubMed] [Google Scholar]
- 19.Han L, et al. Concentration and length dependence of DNA looping in transcriptional regulation. PLoS ONE. 2009;4(5):e5621. doi: 10.1371/journal.pone.0005621. [DOI] [PMC free article] [PubMed] [Google Scholar]
- 20.Johnson S, Lindén M, Phillips R. Sequence dependence of transcription factor-mediated DNA looping. Nucleic Acids Res. 2012;40(16):7728–7738. doi: 10.1093/nar/gks473. [DOI] [PMC free article] [PubMed] [Google Scholar]
- 21.Wang G, Dhar K, Swanson PC, Levitus M, Chang Y. Real-time monitoring of RAG-catalyzed DNA cleavage unveils dynamic changes in coding end association with the coding end complex. Nucleic Acids Res. 2012;40(13):6082–6096. doi: 10.1093/nar/gks255. [DOI] [PMC free article] [PubMed] [Google Scholar]
- 22.Zhao S, Gwyn LM, De P, Rodgers KK. A non-sequence-specific DNA binding mode of RAG1 is inhibited by RAG2. J Mol Biol. 2009;387(3):744–758. doi: 10.1016/j.jmb.2009.02.020. [DOI] [PMC free article] [PubMed] [Google Scholar]
- 23.McCauley MJ, Zimmerman J, Maher LJ, 3rd, Williams MC. HMGB binding to DNA: Single and double box motifs. J Mol Biol. 2007;374(4):993–1004. doi: 10.1016/j.jmb.2007.09.073. [DOI] [PMC free article] [PubMed] [Google Scholar]
- 24.Shlyakhtenko LS, et al. Molecular mechanism underlying RAG1/RAG2 synaptic complex formation. J Biol Chem. 2009;284(31):20956–20965. doi: 10.1074/jbc.M109.028977. [DOI] [PMC free article] [PubMed] [Google Scholar]
- 25.Ciubotaru M, et al. RAG and HMGB1 create a large bend in the 23RSS in the V(D)J recombination synaptic complexes. Nucleic Acids Res. 2013;41(4):2437–2454. doi: 10.1093/nar/gks1294. [DOI] [PMC free article] [PubMed] [Google Scholar]
- 26.Ciubotaru M, et al. The architecture of the 12RSS in V(D)J recombination signal and synaptic complexes. Nucleic Acids Res. 2015;43(2):917–931. doi: 10.1093/nar/gku1348. [DOI] [PMC free article] [PubMed] [Google Scholar]
- 27.Askary A, Shimazaki N, Bayat N, Lieber MR. Modeling of the RAG reaction mechanism. Cell Reports. 2014;7(2):307–315. doi: 10.1016/j.celrep.2014.03.005. [DOI] [PMC free article] [PubMed] [Google Scholar]
- 28.Sheehan KM, Lieber MR. V(D)J recombination: Signal and coding joint resolution are uncoupled and depend on parallel synapsis of the sites. Mol Cell Biol. 1993;13(3):1363–1370. doi: 10.1128/mcb.13.3.1363. [DOI] [PMC free article] [PubMed] [Google Scholar]
- 29.Eastman QM, Leu TM, Schatz DG. Initiation of V(D)J recombination in vitro obeying the 12/23 rule. Nature. 1996;380(6569):85–88. doi: 10.1038/380085a0. [DOI] [PubMed] [Google Scholar]
- 30.van Gent DC, Ramsden DA, Gellert M. The RAG1 and RAG2 proteins establish the 12/23 rule in V(D)J recombination. Cell. 1996;85(1):107–113. doi: 10.1016/s0092-8674(00)81086-7. [DOI] [PubMed] [Google Scholar]
- 31.Jones JM, Gellert M. Ordered assembly of the V(D)J synaptic complex ensures accurate recombination. EMBO J. 2002;21(15):4162–4171. doi: 10.1093/emboj/cdf394. [DOI] [PMC free article] [PubMed] [Google Scholar]
- 32.Rowell JP, Simpson KL, Stott K, Watson M, Thomas JO. HMGB1-facilitated p53 DNA binding occurs via HMG-Box/p53 transactivation domain interaction, regulated by the acidic tail. Structure. 2012;20(12):2014–2024. doi: 10.1016/j.str.2012.09.004. [DOI] [PubMed] [Google Scholar]
- 33.Wu C, et al. Dramatically increased rearrangement and peripheral representation of Vbeta14 driven by the 3’Dbeta1 recombination signal sequence. Immunity. 2003;18(1):75–85. doi: 10.1016/s1074-7613(02)00515-0. [DOI] [PubMed] [Google Scholar]
- 34.Bassing CH, et al. Vbeta cluster sequences reduce the frequency of primary Vbeta2 and Vbeta14 rearrangements. Eur J Immunol. 2008;38(9):2564–2572. doi: 10.1002/eji.200838347. [DOI] [PMC free article] [PubMed] [Google Scholar]
- 35.Ranganath S, et al. Productive coupling of accessible Vbeta14 segments and DJbeta complexes determines the frequency of Vbeta14 rearrangement. J Immunol. 2008;180(4):2339–2346. doi: 10.4049/jimmunol.180.4.2339. [DOI] [PMC free article] [PubMed] [Google Scholar]
Associated Data
This section collects any data citations, data availability statements, or supplementary materials included in this article.