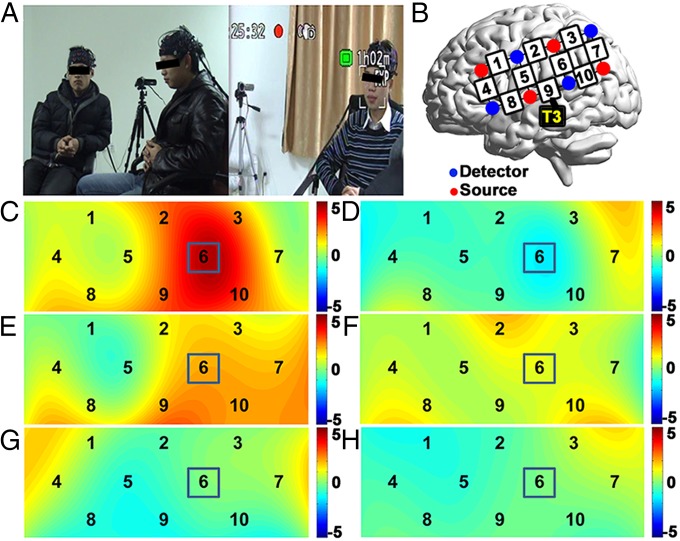
Fig. 1.
Experimental procedure and the increase of interpersonal neural synchronization (INS). (A) For each group, three persons sat in a triangle. Two cameras were placed in opposite positions. The figure shows two sample frames from the cameras in the opposite directions. Participants were asked to discuss a topic for 5 min and then to choose a leader to report their conclusion. (B) The optode probe set was placed on the left frontal, temporal, and parietal cortices. T3 corresponds to a position in the international 10–20 system. (C and D) Shown are t maps for results of the original pairs (i.e., real data). (E and F) Shown are t maps for the permutation results of pairs with a follower from the same group randomly assigned as the leader. (G and H) Shown are t maps for the permutation results of randomized pairs from across groups. [C, E, and G are t maps for averaged leader–follower (LF) pairs; D, F, and H are t maps for the follower–follower (FF) pairs.]

