

Abstract
In a glance, the visual system can provide a summary of some kinds of information about objects in a scene. We explore how summary information about orientation is extracted and find that some representations of orientation are privileged over others. Participants judged the average orientation of either a set of 6 bars or 6 circular gratings. For bars, orientation information was carried by object boundary features, while for gratings, orientation was carried by internal surface features. The results showed more accurate averaging performance for bars than for gratings, even when controlling for potential differences in encoding precision for solitary objects. We suggest that, during orientation averaging, the visual system prioritizes object boundaries over surface features. This privilege for boundary features may lead to a better representation of the spatial layout of a scene.
Keywords: orientation averaging, summary representations, surface features, boundary features
Overwhelmed by a flood of visual information, visual processes such as complex object identification can fail without focused processing (Tsotsos, 1990). But even without this focus, the visual system has access to statistical information about multiple objects, such as average location (Alvarez & Oliva, 2008), average size (Ariely, 2001; Chong & Treisman, 2003; but see Myczek & Simons, 2008), or average orientation (Alvarez & Oliva, 2009; Parkes, Lund, Angelucci, Solomon, & Morgan, 2001). In this study, we explore the visual representations used for creating such summary information, using orientation as a case study.
Several studies show that multiple individual orientations can be pooled together to extract a single average. In one study, participants judged the orientation of a tilted object flanked by distractor objects (Parkes et al., 2001). Because the objects were presented in the visual periphery, the flankers interfered with perception of the target through crowding (Toet & Levi, 1992), which is thought to reflect a mandatory pooling of visual information within receptive fields (Pelli, Palomares, & Majaj, 2004). Although participants could not extract the orientation of the target grating alone, in some conditions they were able to guess its orientation through the average tilt of the target and flanker objects together. This strategy worked when the distractors were tilted in the same direction as the target (which would lead to an informative average) but not when the distractors were tilted in the opposite direction (which would lead to an uninformative average).
This averaging is not restricted to crowded displays and can also be seen when objects are distributed across a display. Similar to the studies using crowding, when participants were asked to discriminate the orientation of the most tilted target object within many tilted objects distributed throughout a display, the direction of the target could be correctly guessed when the nontargets all had a similar tilt direction but not when their tilt direction was opposite (Baldassi & Burr, 2000). Critically, as evidence that the tilt direction was judged from a representation of average orientation, a similar tilt orientation did not help participants locate the target, because its location and individual orientation were not accessible from the global orientation average. These results suggest that the pooling or averaging of orientation is not restricted to spatially local receptive fields and is instead possible over wide areas of the visual field. Other work suggests that orientation can be extracted even under conditions of reduced attention (Alvarez & Oliva, 2009).
Orientation signals are present throughout several possible levels of representation of a scene. For example, texture can form the surfaces of objects or regions, and contours can form the boundaries of objects or regions. Which format of orientation representation is most efficiently used during orientation averaging? The present study tests averaging performance for two orientation representations: surface feature orientation, carried by the internal texture of objects, and object boundary orientation, carried by the outer contours of objects. To predict which type of orientation would be more efficient in an average representation, it is useful to consider what purpose summary information about orientation might serve. One possible use might be to help identify or categorize scenes. Computational models of scene perception are able to extract distributions of orientation and other features from photographs of scenes and successfully categorize them as natural or artificial (Torralba & Oliva, 2003). If so, then object boundary orientation might be more useful, because it carries information about the physical structure of a scene (Oliva & Torralba, 2006) and the cardinal axes of objects (Marr, 1982), instead of the textural properties of those objects. In fact, scenes can be successfully categorized based on types of orientation information that correlate with boundary features of objects and segmentations of surfaces (Oliva & Torralba, 2006). Information about orientation boundaries may also be more relevant for action—when you pick up a book, the shape of your hand must adapt to the book’s edges, and not to the stripes on its jacket. Knowing summary information about the boundaries of a group of objects may better prepare you to act on them quickly. Boundary features may also better represent the results of physical force, as when wind direction is indicated by the sway of a tree branch. Surface features are still relevant—a sailor can judge wind direction from ripples on the water’s surface, and more general texture information may be recovered from surface orientation (Julesz, 1981)— but boundary information would seem more robustly useful.
In this study, we tested whether orientation averaging is more efficient for boundary orientation information than surface feature orientation by employing two different object types: a grating that contained only surface feature orientation enclosed in an unoriented circular boundary (referred to as the “grating”), and the same grating enclosed in an oriented, elliptical-shaped boundary (referred to as the “bar”). As a result, the grating had surface orientation but no boundary orientation, while the bar had boundary orientation with reduced surface orientation. We asked participants to judge the average orientation of either a set of six gratings or six bars. If orientation averaging is more efficient for boundary features than surface features, participants should show higher accuracy for bar displays than grating displays.
Method
Participants
Seventeen participants from the Northwestern University community participated with written consent. All participants reported normal or corrected-to-normal vision and were naïve to the purpose of the experiment.
Stimuli and Apparatus
All stimuli were created and displayed using MATLAB with PsychToolbox (Brainard, 1997; Pelli, 1997) on an Intel Macintosh running OS × 10.5. All stimuli were displayed on 17inch View-Sonic E70fB CRT monitor with 1024 × 786 resolution and a rate of 85Hz. The viewing distance was approximately 57 cm. Both gratings and bars were created from a sinusoidal grating of 1 cycle-per-degree spatial frequency, with a size of 3.75° × 3.75° in visual angle, but windowed by two different shapes of envelopes: a circular Gaussian envelope (SD = 0.4° × 0.4°) for gratings and an elliptic Gaussian envelope (SD = 0.1° × 0.4°) for bars. As a result, both gratings and bars blended into the background without leaving sharp edges (see Figure 1). To create the set of individual object orientation for a trial, we repeatedly sampled six individual orientations from a normal distribution (M = 0°, SD = 20.6°) until the six orientations had an average orientation within 0.5° of zero. Then, all object orientations were rotated by a randomly chosen constant (0 –359°) to ensure that the actual average would not be predictable. Importantly, we used the identical sets of orientations for the gratings and bars conditions to ensure the mean and the variance of orientations would be identical across the two object types within each participant.
Figure 1.
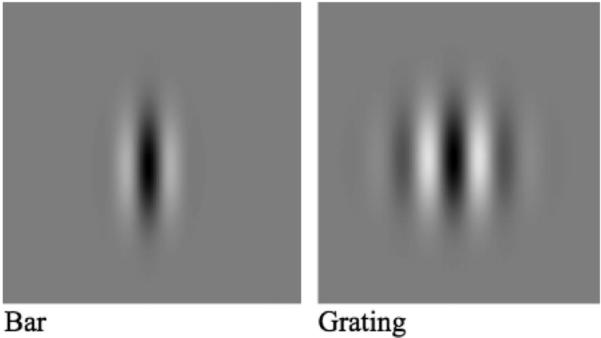
Sample objects for a bar and a grating. All sample objects depicted with 90° orientations.
Procedure
Trials began with a 1.0° × 1.0° fixation cross for 500 ms, followed by the appearance of six gratings or six bars for 100 ms (to prevent eye movements). Objects were equally spaced along the circumference of an imaginary circle 8° in radius. After the encoding display, a set of two test orientations appeared at 3.2° to the left and right of fixation using the same object type, and participants chose which depicted the correct average orientation. One of the two test orientations was the target, the correct average orientation of the six orientations, and the other was a nontarget, rotated from the target orientation by a multiple of the orientation discrimination thresholds for a single grating and for a single bar. Using these values equates possible differences in the task difficulty that arise from perceiving individual orientations between gratings and bars. In the small orientation difference condition, the orientation differences were the orientation discrimination thresholds1 for each object type, 15° for bars, and 20° for gratings. In the large orientation difference condition, we doubled these thresholds to 30° for bars and 40° for gratings.
Participants were encouraged to guess when they were not confident. Incorrect responses resulted in the word “incorrect” for 2 s. There were 192 trials in total, resulting in 48 trials per each object type (bar and grating) and orientation difference (1 or 2 times the orientation discrimination threshold) condition. The intertrial interval was 500 ms. Object type alternated at every 48 trials, with order counterbalanced across participants. The experiment, including 12 practice trials, took approximately 25 min.
Results
Figure 2 depicts average accuracy for the bar and grating conditions. Accuracy rates across object type and orientation difference were entered into a repeated measures analysis of variance using two factors of object type (bar vs. grating) and orientation difference (small vs. large orientation difference).
Figure 2.

Accuracy rates for average orientation discrimination of bars and gratings across small (orientation discrimination threshold: bar 15°, grating 20°) vs. large (doubled orientation discrimination threshold bar 30°, grating 40°) target to nontarget orientation differences. The black dashed bar depicts performance in the bars condition, and the gray dashed bar depicts the grating condition. The error bars are within-subject standard errors.
As expected, there was a significant main effect of orientation difference, F(1, 16) = 18.17, p = .001, 112 = .54, showing lower accuracy for distinguishing between the true average and nontargets that were one threshold unit away (M = 53.8%, SE = 2.9%) relative to two units (M = 68.5%, SE = 2.6%). Critically, the precision of judging average orientations was significantly higher for bars (M = 63.7%, SE = 2.4%) than for gratings (M = 58.6%, SE = 2.5%), F(1, 16) = 4.81, p = .04, 112 = .23, even after matching the single orientation discrimination difficulty between the two object types. There was no interaction between the object type and orientation difference, F<1, ns, showing that the averaging advantage for bars persisted even with a relatively large orientation difference. Together, the results suggest that precision of orientation averaging can be modulated by the type of orientation representation.
Discussion
When extracting an average orientation from a set of objects, performance was better when the orientation was carried by the boundary features of the objects, relative to when it was carried by the internal surface features of the objects. This effect was not solely due to a better encoding precision for orientation of boundary features in general. Instead, some aspect of the averaging process itself appears to be more efficient for boundary features. Many other perceptual experiences demonstrate an advantage for boundary representations over surface representations. One model of boundary and surface feature representation proposes that surface features can be defined for a spatial region only after the boundary of the object has been set (Cohen & Grossberg, 1984; Grossberg & Mingolla, 1985). Boundary contours also can systematically change the perceived nature of the surface features that fall within them. For example, when viewing two-tone faces, the perceived depth of a face can collapse when shadow contours are accentuated by drawing a solid border (Kennedy & Bai, 2000), and similar effects exist for paintings of faces (Cavanagh & Kennedy, 2000; Harmon & Julesz, 1973; Pelli, 1999). Boundary contour placement can also change the perceived color of an afterimage within a structurally ambiguous object (van Lier, Vergeer, & Anstis, 2009).
Some studies also suggest that, even at an early age, boundary features are privileged over surface features for distinguishing objects that are nearby in space. When shown two adjacent objects, a looking-time measure indicated that 4-month-old infants saw two objects as different when boundary features (object shape) were different but not when the internal texture of the objects was made radically different (Needham, 1999; Kaufman & Needham, 2010; see also Tremoulet, Leslie, & Hall, 2000). Boundary features can also be more efficiently used at a young age to distinguish different objects over time. When 4.5-month-old infants were shown an object moving behind an occluder, looking-time results suggest that they interpreted a changed object that exited the occluder as different, but only when the change altered the shape or size of the object and not when it altered the internal pattern. The use of internal pattern changes to indicate a new object was not seen until 7.5 months of age (Wilcox, 1999). A similar boundary advantage can be seen in visual memory studies using adults. When asked to store the boundary or surface feature orientation of multiple objects, performance was better for boundary orientation (Alvarez & Cavanagh, 2008).
In summary, the present results show that average orientation is more accessible via boundary features than surface features. The average orientation of boundary features may better represent the orientation of object axes, physical forces, and action requirements within a scene, and may provide rapid access to the critical featural and spatial layout information important for understanding the gist of a scene.
Acknowledgments
We thank Marcia Grabowecky and Satoru Suzuki for helpful comments, and Jason Scimeca for assistance in data collection.
Footnotes
The thresholds were measured in a separate study (N=12) using QUEST (Watson & Pelli, 1983). Displays and timing were identical, with the exception that participants reported the orientation of a single object that was precued (100 ms SOA). The task was to judge whether a reference orientation shown after the object display was rotated clockwise or counterclockwise relative to the orientation of the cued object. We measured the orientation difference where a participant could correctly judge the direction of rotation from the sample to the reference with 75% accuracy rate using QUEST. For each object type, the threshold was based on the responses of the 96 trials. The object type alternated at every 12 trials, and the order was counterbalanced across participants. There was no significant difference between the single-object encoding thresholds. To ensure a conservative test of our hypothesis, however, we used the higher threshold for gratings, which should boost performance for averaging grating orientations.
References
- Alvarez GA, Cavanagh P. Visual short-term memory operates more efficiently on boundary features than on surface features. Perception & Psychophysics. 2008;70:346–364. doi: 10.3758/pp.70.2.346. doi:10.3758/PP.70.2.346. [DOI] [PMC free article] [PubMed] [Google Scholar]
- Alvarez GA, Oliva A. The representation of simple ensemble visual features outside the focus of attention. Psychological Science. 2008;19:392–398. doi: 10.1111/j.1467-9280.2008.02098.x. doi:10.1111/j.1467-9280.2008.02098.x. [DOI] [PMC free article] [PubMed] [Google Scholar]
- Alvarez GA, Oliva A. Spatial ensemble statistics are efficient codes that can be represented with reduced attention. Proceedings of the National Academy of Sciences of the United States of America. 2009;106:7345–7350. doi: 10.1073/pnas.0808981106. doi:10.1073/pnas.0808981106. [DOI] [PMC free article] [PubMed] [Google Scholar]
- Ariely D. Seeing sets: Representation by statistical properties. Psychological Science. 2001;12:157–162. doi: 10.1111/1467-9280.00327. doi:10.1111/1467-9280.00327. [DOI] [PubMed] [Google Scholar]
- Baldassi S, Burr DC. Feature-based integration of orientation signals in visual search. Vision Research. 2000;40:1293–1300. doi: 10.1016/s0042-6989(00)00029-8. doi:10.1016/ S0042-6989(00)00029-8. [DOI] [PubMed] [Google Scholar]
- Brainard DH. The psychophysics toolbox. Spatial Vision. 1997;10:433–436. doi:10.1163/156856897X00357. [PubMed] [Google Scholar]
- Cavanagh P, Kennedy JM. Close encounters: Details veto depth from shadows. Response to Pelli (1999) Science. 2000 Mar 31;287:2421. doi: 10.1126/science.287.5462.2421g. doi:10.1126/science.287.5462.2421g. [DOI] [PubMed] [Google Scholar]
- Chong SC, Treisman A. Representation of statistical properties. Vision Research. 2003;43:393–404. doi: 10.1016/s0042-6989(02)00596-5. doi:10.1016/S0042-6989(02)00596-5. [DOI] [PubMed] [Google Scholar]
- Cohen MA, Grossberg S. Neural dynamics of brightness perception: Features, boundaries, diffusion, and resonance. Perception & Psychophysics. 1984;36:428–456. doi: 10.3758/bf03207497. doi:10.3758/BF03207497. [DOI] [PubMed] [Google Scholar]
- Grossberg S, Mingolla E. Neural dynamics of form perception: Boundary completion, illusory figures, and neon color spreading. Psychological Review. 1985;92:173–211. doi:10.1037/0033-295X.92.2.173. [PubMed] [Google Scholar]
- Harmon LD, Julesz B. Masking in visual recognition: Effects of 2-dimensional filtered noise. Science. 1973 Jun 15;180:1194–1196. doi: 10.1126/science.180.4091.1194. doi:10.1126/science.180.4091.1194. [DOI] [PubMed] [Google Scholar]
- Julesz B. Textons, the elements of texture perception, and their interactions. Nature. 1981;290:91–97. doi: 10.1038/290091a0. doi:10.1038/290091a0. [DOI] [PubMed] [Google Scholar]
- Kaufman J, Needham A. The role of surface discontinuity and shape in 4-month-old infants’ object segregation. Visual Cognition. 2010;18:751–766. doi:10.1080/13506280903155638. [Google Scholar]
- Kennedy JM, Bai J. Cavanagh and Leclerc shape-from-shadow pictures: Do line versions fail because of the polarity of the regions or the contour? Perception. 2000;29:399–407. doi: 10.1068/p3033. doi:10.1068/p3033. [DOI] [PubMed] [Google Scholar]
- Marr D. Vision. Freeman; San Francisco, CA: 1982. [Google Scholar]
- Myczek K, Simons DJ. Better than average: Alternatives to statistical summary representations for rapid judgments of average size. Perception & Psychophysics. 2008;70:772–788. doi: 10.3758/pp.70.5.772. doi:10.3758/PP.70.5.772. [DOI] [PubMed] [Google Scholar]
- Needham A. The role of shape in 4-month-old infants’ object segregation. Infant Behavior & Development. 1999;22:161–178. doi:10.1016/ S0163-6383(99)00008-9. [Google Scholar]
- Oliva A, Torralba A. Building the gist of a scene: The role of global image features in recognition. Progress in Brain Research. 2006;155:23–36. doi: 10.1016/S0079-6123(06)55002-2. doi:10.1016/S0079-6123(06)55002-2. [DOI] [PubMed] [Google Scholar]
- Parkes L, Lund J, Angelucci A, Solomon JA, Morgan M. Compulsory averaging of crowded orientation signals in human vision. Nature Neuroscience. 2001;4:739–744. doi: 10.1038/89532. doi:10.1038/89532. [DOI] [PubMed] [Google Scholar]
- Pelli DG, Palomares M, Majaj NJ. Crowding is unlike ordinary masking: Distinguishing feature integration from detection. Journal of Vision. 2004;4:1136–1169. doi: 10.1167/4.12.12. doi:10.1167/4.12.12. [DOI] [PubMed] [Google Scholar]
- Pelli DG. The VideoToolbox software for visual psychophysics: Transforming numbers into movies. Spatial Vision. 1997;10:437–442. doi: 10.1163/156856897X00366. [PubMed] [Google Scholar]
- Pelli DG. Close encounters–An artist shows that size affects shape. Science. 1999;285:844–846. doi: 10.1126/science.285.5429.844. doi:10.1126/science.285.5429.844. [DOI] [PubMed] [Google Scholar]
- Toet A, Levi DM. The two-dimensional shape of spatial interaction zones in the parafovea. Vision Research. 1992;32:1349–1357. doi: 10.1016/0042-6989(92)90227-a. [DOI] [PubMed] [Google Scholar]
- Torralba A, Oliva A. Statistics of natural image categories. Network Computation in Neural Systems. 2003;14:391–412. doi:10.1088/ 0954-898X/14/3/302. [PubMed] [Google Scholar]
- Tremoulet PD, Leslie AM, Hall GD. Infant individuation and identification of objects. Cognitive Development. 2000;15:499–522. doi:10.1016/S0885-2014(01)00038-7. [Google Scholar]
- Tsotsos JK. Analyzing vision at the complexity level. Behavioral and Brain Sciences. 1990;13:423–445. doi:10.1017/S0140525X00079577. [Google Scholar]
- van Lier R, Vergeer M, Anstis S. Filling-in afterimage colors between the bars. Current Biology. 2009;19:R323–R324. doi: 10.1016/j.cub.2009.03.010. doi:10.1016/ j.cub.2009.03.010. [DOI] [PubMed] [Google Scholar]
- Watson AB, Pelli DG. QUEST: A Bayesian adaptive psychometric method. Perception & Psychophysics. 1983;33:113–120. doi: 10.3758/bf03202828. doi: 10.3758/BF03202828. [DOI] [PubMed] [Google Scholar]
- Wilcox T. Object individuation: Infants’ use of shape, size, pattern, and color. Cognition. 1999;72:125–166. doi: 10.1016/s0010-0277(99)00035-9. doi:10.1016/S0010-0277 (99)00035-9. [DOI] [PubMed] [Google Scholar]