

Abstract
Background
Attention deficit hyperactivity disorder (ADHD) is a highly heritable neuropsychiatric condition, but it has been difficult to identify genes underlying this disorder. This study aimed to explore genetics of ADHD in an ethnically homogeneous Norwegian population by means of a genome-wide association (GWA) analysis followed by examination of candidate loci.
Materials and Methods
Participants were recruited through Norwegian medical and birth registries as well as the general population. Presence of ADHD was defined according to DSM-IV criteria. Genotyping was performed using Illumina Human OmniExpress-12v1 microarrays. Statistical analyses were divided into several steps: (1) genome-wide association in the form of logistic regression in PLINK and follow-up pathway analyses performed in DAPPLE and INRICH softwares, (2) SNP-heritability calculated using genome-wide complex trait analysis (GCTA) tool, (3) gene-based association tests carried out in JAG software, and (4) evaluation of previously reported genome-wide signals and candidate genes of ADHD.
Results
In total, 1.358 individuals (478 cases and 880 controls) and 598.384 autosomal SNPs were subjected to GWA analysis. No single polymorphism reached genome-wide significance. The strongest signal was observed at rs9949006 in the ENSG00000263745 gene (OR=1.51, 95% CI 1.28–1.79, p=1.38E-06). Pathway analyses of the top SNPs implicated genes involved in the regulation of gene expression, cell adhesion and inflammation. Among previously identified ADHD candidate genes, prominent association signals were observed for SLC9A9 (rs1393072, OR=1.46, 95% CI = 1.21–1.77, p=9.95E-05) and TPH2 (rs17110690, OR = 1.38, 95% CI = 1.14–1.66, p=8.31E-04).
Conclusion
This study confirms the complexity and heterogeneity of ADHD etiology. Taken together with previous findings, our results point to a spectrum of biological mechanisms underlying the symptoms of ADHD, providing targets for further genetic exploration of this complex disorder.
Introduction
Attention deficit hyperactivity disorder (ADHD) is one of the most common and most heritable childhood onset psychiatric conditions [1, 2]. Children with ADHD are at high risk of developing antisocial behavior, substance abuse and other psychiatric disorders, consequently presenting difficulties in their education and social integration [3]. Traditionally, ADHD was considered to be a childhood disorder that usually diminishes in adolescents. However, follow-up studies in the last few decades have clearly shown that many children continue to exhibit signs of ADHD in their adulthood as well [4, 5]. Persistence of ADHD poses a significant issue for society, with serious health-related, economic and personal consequences [6–9].
Despite the high heritability of 70–80% [1, 10, 11], the genetic architecture of ADHD is still largely unknown. So far, association studies of ADHD have implicated risk variants that (1) generally tend to have small effect sizes or be rare, (2) often refer to co-occurring conditions and (3) lack consistent replication [12, 13].
Neurotransmitters have been the major target for candidate gene association studies in ADHD. Nominal significance was reported for the dopamine-related genes SLC6A3 and DRD5; serotonin-related genes SLC6A4 and HTR1B; as well as a synaptic vesicle membrane docking SNAP-25 gene [14, 15]. However, effects of these genes are likely to be rather small and they have not been decisively supported by previous studies [16–19].
Genome-wide association (GWA) study is a useful tool for discovering novel risk variants as it allows a hypothesis-free interrogation of the entire genome. Several GWA analyses have been performed in order to identify ADHD risk loci using either case-control or family-based designs [13, 20], but to date there is no single nucleotide polymorphism (SNP) reaching the stringent genome-wide significance threshold (p<5.00E-08). Nonetheless, the top SNPs from previous GWA analyses include candidate genes that encode the cell adhesion protein CDH13 [16, 17, 21], the glutamate receptor GRM5 [22], the solute carrier protein SLC9A9 [23], the cholinergic receptor CHRNA7 [24] as well as the potassium-channel regulators KCNIP1, KCNIP4 and KCNC1 [16, 17].
The lack of robust genetic association findings in ADHD may be explained by its polygenic, multifactorial nature, with both common and rare variants likely contributing small effects to its etiology [24–26]. An additional potentially important factor may be the genetic heterogeneity of ADHD age-related subtypes (childhood versus adult ADHD) which may have different underlying genetic mechanisms. It is well established, for example, that age influences ADHD-relevant cognitive performance [27, 28]. In addition, it has been suggested that age can modulate the association of the SLC6A3 gene with ADHD [29–31]. Nonetheless, persistent ADHD also has its onset in childhood and an overlap in genetics of childhood and adult ADHD may be observed from previous GWA studies. For example, CDH13 encoding the cell adhesion protein T-cadherin is among the strongest associated candidate genes in both childhood and adult ADHD [16, 17]. Thus, performing GWA analysis on childhood and adult ADHD samples combined, as well as utilizing GWAS results in the examination of possibly involved biological processes, may help our understanding of genetic mechanisms underlying both childhood and adult ADHD.
This study aimed to identify genetic susceptibility loci of ADHD utilizing GWAS in a Norwegian sample of both childhood and adult ADHD, and investigate potential underlying mechanisms by pathway analyses.
Materials and Methods
Subjects
Recruitment was conducted at two sites in Norway: University of Bergen (UiB, Bergen, Norway) and the Norwegian Institute of Public Health (NIPH) in collaboration with the University of Oslo (UiO, Oslo, Norway). All participants provided signed informed consent form. The study was approved by the Norwegian regional medical research ethics committee West (IRB #3 FWA00009490, IRB00001872) as well as South East Norway, part C.
Recruitment of participants at UiB is described in details elsewhere [9]. In short, ADHD patients were recruited through a Norwegian national medical registry as well as by psychologists and psychiatrists working at out-patient clinics. ADHD diagnosis was defined according to DSM-IV criteria. Controls were randomly recruited through the Norwegian Medical Birth registry. All participants provided either blood or saliva samples for DNA extraction.
Participants at NIPH/UiO were selected through a screening procedure based on questionnaires from the Mother and Child Cohort Study (MoBa), resulting in 1195 children being clinically assessed [32]. The Norwegian Mother and Child Cohort Study (MoBa) is a prospective population-based pregnancy cohort study conducted by the Norwegian Institute of Public Health. Participants were recruited from all over Norway from 1999–2008 [33]. The Preschool Age Psychiatric Assessment [34] was used to determine symptoms of ADHD in accordance with DSM-IV criteria. Presence of significant symptoms of ADHD was defined as either 1) meeting all the symptom criteria for a DSM-IV-TR diagnosis, 2) meeting all the DSM-IV-TR symptom criteria for a diagnosis, but without report of impairment or 3) meeting at least three symptom criteria for a diagnosis in addition to report of impairment. DNA was available for 701 of the 1195 participants.
Additional control samples were recruited at UiO as parts of the following studies: Thematically Organized Psychosis Research (TOP) [35], LifeSpan Cognition and Plasticity through the Lifespan [36] and Neurocognitive Development [37], and Akershus University Hospital (AHUS) based memory study [38]. Healthy subjects in the TOP study were randomly selected using national records and the Primary Care Evaluation of Mental Disorders (PRIME-MD). None of the control subjects had a history of moderate/severe head injury, neurological disorder, mental retardation or an age outside the age range of 18–65 years. Subjects were excluded if they or any of their close relatives had a lifetime history of a severe psychiatric disorder (schizophrenia, bipolar disorder and major depression), a history of medical problems thought to interfere with brain function (hypothyroidism, uncontrolled hypertension and diabetes), or significant illicit drug use.
Participants from the Cognition and Plasticity through the Lifespan and Neurocognitive Development studies were recruited through newspaper advertisements, at local schools and among students and employees of the University of Oslo. The controls were screened for psychiatric disorders as well as neurological illnesses.
The AHUS sample consists of controls from longitudinal studies of age-related cognitive impairment. Any cognitive symptoms and somatic or psychiatric disease history with possible cognitive impact were among the exclusion criteria [38].
All individuals (cases and controls) recruited at UiB and within MoBa were screened for ADHD, while all other participants were screened for major neuropsychiatric disorders only (schizophrenia, bipolar disorder, major depression and mental retardation).
Genotyping and quality control
Participants were genotyped on either Human OmniExpress-12v1-1_B (Illumina, San Diego, CA, USA) or Human OmniExpress-12v1_H (Illumina, San Diego, CA, USA) platforms. Genotyping was performed according to the standard Illumina protocol at Decode facility (Reykjavik, Iceland). Genotypes were assigned according to the standard Illumina protocol in GenomeStudio software, version V2011.1.
Individuals exhibiting high rates of genotype missingness (above 98%) or genome-wide heterozygosity (outside mean±3SD of the sample); cryptic relatedness (PI_HAT above 15%) or non-European ancestry were excluded from the analyses. Sex check was performed based on the homozygocity estimate of X chromosome markers implemented in PLINK. Given high concordance between the reported and estimated sex (>98% in our dataset), this method was also used to impute the missing sex information.
SNPs exhibiting high rates of missingness (above 95%), minor allele frequency (MAF) below 1% or failing Hardy-Weinberg equilibrium test (p<1.00E-05) were excluded from the analyses.
Genome-wide association
Each SNP was tested for association with ADHD in the form of logistic regression assuming an underlying additive model and adjusted for gender as implemented in PLINK [39]. Because participants were genotyped on different arrays, SNPs showing high discrepancy in their frequencies between the two arrays (p<1.00E-05) were excluded from GWA analysis. A covariate corresponding to each genotyping array was included in the regression model when testing for association. Genomic control [40] was applied to check for possible population stratification. QQ plot was constructed to study the distribution of test statistics. A significance threshold of 5.00E-08 was adopted to correct for multiple testing.
Expression Quantitative Trait Locus (eQTL) analysis
The top SNPs (p<1.00E-04) identified in genome-wide association tests were subjected to eQTL identification in Genevar software, using cis-eQTL SNP mode [41]. Expression-genotype pairs were extracted from HapMap3 data [42]. The reference source was set to Ensembl. The analyses were performed under default settings (Spearman’s correlation coefficient = 1, window around the SNPs of interest = 1 million basepairs, p-value threshold 1.00E-03).
Estimation of SNP-heritability
SNP-heritability was estimated using the GCTA software [43]. Genetic similarity threshold was set to 0.05. The analysis model included sex and genotyping array as covariates.
Enrichment analysis
To evaluate if any known biological pathways were implicated by our GWAS results, intervals around top SNPs (p<1.00E-04) were tested for enrichment in Gene Ontology (GO) nodes using the INRICH software [44]. Enrichment analysis performed in INRICH was based on the number of unique genes within an association interval that are over-represented in at least one defined gene-set. Association intervals were determined as the linkage-disequilibrium (LD) independent regions around the top associated SNPs. These regions were constructed by tagging the top SNPs in PLINK (tagging r2 threshold was set to 0.2, and each tags were constrained to be within a megabase). Defined gene-sets were determined as GO nodes. The minimum number of genes in a set was set to 5, while the maximum to 200 genes. Interval overlap was limited to 20 kbp up- or down-stream of a gene. Random interval sets, each approximately matching the associated intervals in terms of the number of SNPs and overlapping genes, were generated ten thousand times. To correct the empirical gene-set, p-value bootstrapping-based re-sampling (5,000 times) was applied.
Protein-protein link evaluation
Using the same association intervals as determined in INRICH enrichment analysis, we assessed possible physical interactions between proteins encoded in those intervals. The analysis was performed using DAPPLE software [45]. DAPPLE identifies direct and indirect networks from proteins encoded in associated intervals by utilizing experimentally validated, protein-protein interaction databases. As a result, DAPPLE assesses if the connectivity between associated proteins would be greater than expected by chance.
Gene-based association tests
Gene-based association tests were performed using JAG software [46, 47]. For each gene, the test statistic was defined as the sum of the—log10 association p-values of individual SNPs annotated to each of the genes. Gene annotation of the variants included a 2000 basepair region around each gene. Only genes with at least two annotated SNPs were considered for the analysis.
To ensure an unbiased interpretation of the results, 10.000 permutations were carried out. The statistics of each gene were computed for each permutation and the final gene-based p-value was calculated as the proportion of test statistics in the permuted data that was higher than the original test statistic. Genes reaching p-value below 1.00E-03 with the initial 10.000 permutations were further permuted 10 million times.
For permutations and to account for LD effects between examined SNPs, we utilized the genotype data of the European ancestry samples from the 1000 Genomes project [48].
Analyses of previous ADHD GWA and candidate gene studies
After performing our analyses, we looked up previously published ADHD GWAS hits and SNPs in ADHD candidate genes in our results. Utilizing the catalogue of published GWAS (http://www.genome.gov/gwastudies/, December 2014), we curated a list of SNPs reaching p-value ≤ 1.00E-05 in previous genome-wide studies of ADHD. For ADHD candidate genes, we adopted the gene list constructed by Brookes et al [49]. These genes were annotated in our data with a 2.000 basepair window on each end of a gene.
Meta-analysis of our main findings and PGC ADHD GWAS results
We have meta-analyzed our top hits (p-value < 1.00E-04) with the results of a large-scale ADHD meta-analysis completed by psychiatric genetics consortium (PGC) [50]. Meta-analysis were performed in the form of random effects regression implemented in PLINK.
Results
Genome-wide association
After quality control, there were 1.358 individuals (478 cases and 880 controls) and 598.467 SNPs available for the analysis. Details of the final sample are summarized in Table 1. Overall, the age distribution was comparable among the cases and controls (37.24% of the cases and 29.38% of the controls were children).
Table 1. Properties of the individuals subjected to GWAS in this study.
| Recruiting center | Number of Cases | Number of Controls | Total number of participants | Mean Age (±SD) | Females (%) | Genotyping array |
|---|---|---|---|---|---|---|
| UiB | 300 | 205 | 505 | 29.88 (9.14) | 55.84 | B |
| MoBa/Preschool ADHD (NIPH) | 104 | 243 | 347 | 3.46 (0.12) | 46.40 | H |
| MoBa/Preschool ADHD (NIPH) | 74 | 156 | 230 | 3.48 (0.11) | 49.57 | B |
| UiO controls | none | 191 | 191 | 31.65 (18.09) | 52.08 | H |
| none | 85 | 85 | 65.22 (9.21) | 54.02 | B | |
| Total | 478 | 880 | 1358 |
Genotyping array B refers to Human OmniExpress-12v1-1_B (Illumina, San Diego, CA, USA) and genotyping array H refers to Human OmniExpress-12v1_H (Illumina, San Diego, CA, USA). SD refers to standard deviation, UiB refers to University of Bergen and UiO refers to University of Oslo.
No variant reached genome-wide significance (p<5.00E-08). Table 2 details the top SNPs with association p-value being less than 1.00E-05 and S1A Table those reaching p-value below 1.00E-04. None of the main hits (p<1.00E-05) showed significant frequency difference between the two genotyping arrays utilized in this study (S3 Table). There was no inflation of calculated p-values observed (λ = 1.01). Figs 1 and 2 depict the QQ- and Manhattan-plots reflecting the results of the performed GWAS.
Table 2. List of SNPs with observed association p-value being less than 1.00E-05.
| Chromosome | Basepair position | SNP | Annotation | reference allele | OR | 95% CI | p-value |
|---|---|---|---|---|---|---|---|
| 3 | 147951120 | rs12497166 | intergenic | T | 0.68 | 0.58–0.80 | 4.95E-06 |
| 3 | 147967689 | rs9836412 | intergenic | A | 0.68 | 0.57–0.80 | 4.18E-06 |
| 3 | 147978393 | rs1019897 | intergenic | C | 0.67 | 0.57–0.79 | 2.55E-06 |
| 3 | 147986944 | rs9834616 | intergenic | A | 0.68 | 0.58–0.81 | 6.25E-06 |
| 5 | 114497623 | rs17137481 | missense variant (N456S) in TRIM36 | C | 2.22 | 1.56–3.16 | 9.08E-06 |
| 11 | 113620851 | rs2856244 | Intronic variant in ZBTB16 | A | 1.47 | 1.24–1.75 | 8.69E-06 |
| 18 | 1906608 | rs9949006 | Long non-protein coding gene (ENSG00000263745) | T | 1.51 | 1.28–1.79 | 1.38E-06 |
Chromosomal position is specified in Build 36 (hg18). OR refers to odds ratio and 95%CI refers to 95% confidence interval. TRIM36 refers to tripartite motif containing 36 gene. ZBTB16 refers to zinc finger and BTB domain containing 16 gene.
Fig 1. QQ plot.
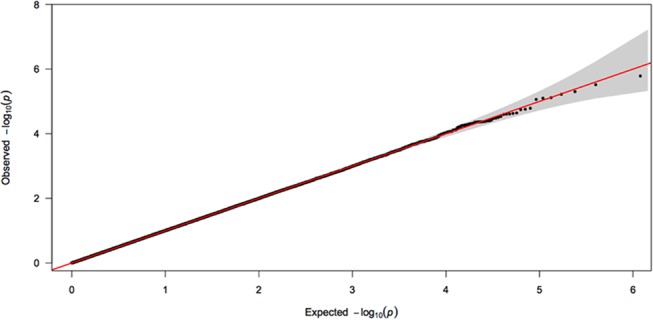
This figure represents the distribution of p-values observed in the presented genome-wide association study of ADHD. The shaded area represents the 95% confidence interval.
Fig 2. Manhattan plot.
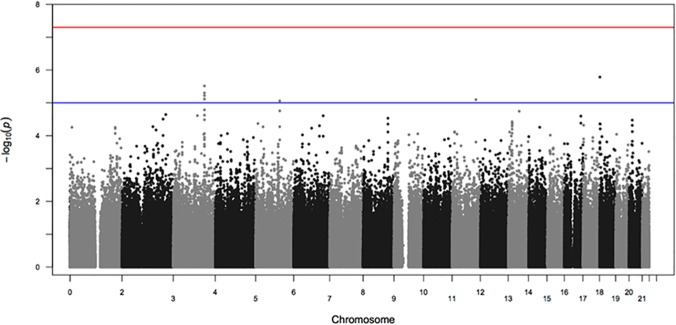
Red line represents genome-wide significance threshold of 5.00E-08, while the blue line corresponds to the suggestive threshold of p = 1.00E-05.
Expression Quantitative Trait Locus (eQTL) analysis
We subjected our top seven SNPs detailed in Table 2 to eQTL evaluation in Genevar software. Matching transcripts were identified for two SNPs in an intergenic region on chromosome 3 (rs12497166 and rs1019897), rs17137481 in the TRIM36 gene, rs9949006 in ENSG00000263745 gene and rs2856244 in the vicinity of our top hit within ZBTB16 gene. None of the probes revealed significant (p<1.00E-03) effects on any gene expression. S1 Fig summarizes the results of these analyses.
Estimation of SNP-heritability
After removal of individuals showing genetic similarity over 0.05, 448 cases and 817 controls were analyzed. Overall, the SNP-heritability of ADHD was estimated to be 28% (standard error = 26%, p = 0.140).
Enrichment analysis
There were 64 SNPs showing association of p<1.00E-04 and 45 LD-independent intervals were constructed (S1 Table). Out of these 45 intervals, 24 were intergenic and, thus, excluded from the analyses.
Overall, the associated intervals revealed enrichment in three GO pathways: rRNA processing (GO:0006364, p = 2.00E-03), skeletal system development (GO:0001501, p = 0.025) and central nervous system development (GO:0007417, p = 0.047). In particular, the enrichment was due to association endowment in the following genes: UTP23, EXOSC8, ZBTB16, POSTN and ADAM23 (Table 3). Although none of these pathways reached significance after correcting for multiple testing, many implicate biological functions that are potentially relevant to ADHD.
Table 3. Results of enrichment analysis.
| GO pathway | Empirical p-value | Corrected p-value | Associated Intervals | Gene list |
|---|---|---|---|---|
| GO:0006364 rRNA processing | 0.002 | 0.50 | chr8:117847902..117853398 chr13:36472896..36481557 | UTP23, EXOSC8 |
| GO:0001501 skeletal_system_development | 0.025 | 0.94 | chr11:113435620..113626627 chr13:37034758..37070894 | ZBTB16, POSTN |
| GO:0007417 central_nervous_system_development | 0.047 | 0.97 | chr2:207016592..207190944 chr11:113435620..113626627 | ADAM23,ZBTB16 |
This table details the GO pathways that revealed significant enrichment prior to correction for multiple testing.
Protein-protein link evaluation
The LD-independent associated intervals contained 28 genes (S2 Table) that were tested for protein-protein interaction in DAPPLE software. DAPPLE could not identify 3 genes: OR3A2, DYTN and LOC200726. Analysis of the remaining genes revealed no direct connections among proteins in our associated intervals. Nonetheless, several significant non-direct interactors were identified. This may suggest that although proteins encoded by genes in our associated intervals do not interact directly with each other, they may represent converging hubs of ADHD-relevant protein networks. Table 4 and Fig 3 present the details of DAPPLE results.
Table 4. Results of protein-protein link evaluation in DAPPLE. List of indirect interactors.
| Protein | number of binding proteins | Binding proteins | crude p-value | corrected p-value | Function |
|---|---|---|---|---|---|
| CDH1 | 2 | CTNND2, BOC | 0.001 | 0.008 | Calcium-dependent cell-adhesion protein |
| CDH2 | 2 | CTNND2, BOC | 0.001 | 0.008 | Calcium-dependent cell-adhesion protein |
| IL6 | 2 | PRLR, ZBTB16 | 0.001 | 0.008 | Cytokine functioning in inflammation and the maturation of B cell |
| EIF2S2 | 2 | EIF3H, ZBTB16 | 0.005 | 0.039 | Eukaryotic translation initiation factor 2 |
| CTNNB1 | 3 | CTNND2, BOC, CSNK1A1L | 0.005 | 0.039 | Adherens junction protein, adhesion between cells |
Presented p-values reflect the probability that by chance individual interactors would be as connected to seed proteins (S2 Table) as was observed in the constructed network.
Fig 3. Protein-protein interaction network build from proteins encoded in associated intervals.
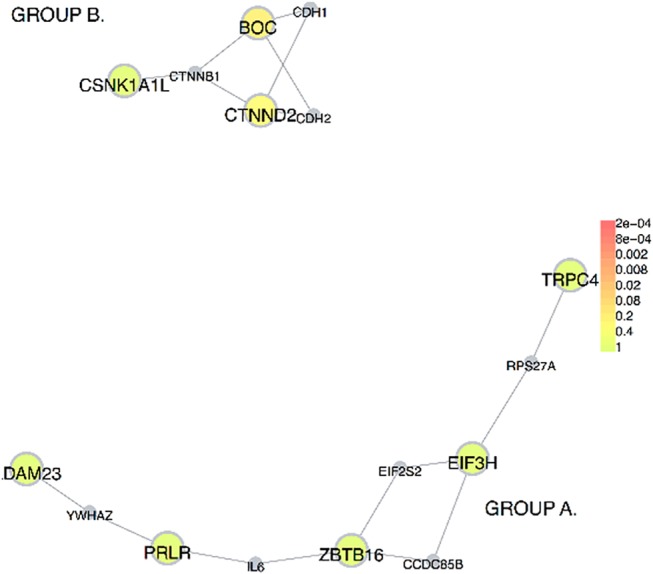
The colored, full circles represent proteins encoded in associated intervals (S2 Table). The smaller, grey circles represent interactors of indirect connections. Functionally, the DAPPLE-constructed diagram can be divided into two main groups: group “A” mostly involved in the regulation of gene expression and inflammation; and group “B” mostly involved in cell adhesion.
Gene-based association tests
In total, our dataset contained 16.546 genes with at least two annotated variants that were tested for gene-based association. Seventeen genes revealed p-values below 1.00E-03, with the most prominent signal observed for CCRN4L (p = 2.00E-07). We observed three SNPs annotated to CCRN4L that contributed to the detected gene-wide signal: rs10212985 (p = 1.48E-03), rs13108158 (p = 1.53E-03) and rs1112828 (p = 3.11E-04). S4 Table reports the details of the top hits in the gene-based analysis.
Analyses of previous ADHD GWA and candidate gene studies
Based on the information of the catalogue of published GWAS studies (http://www.genome.gov/gwastudies/), we curated a list of 159 SNPs with reported p-value ≤ 1.00E-05 in previous GWA analyses of ADHD. Out of these 159 SNPs, only two revealed significant result with p-value below 0.05 in our analysis: rs2241685 and rs7463256 (p-value in our study is 4.76E-03 and 0.01 respectively). The first SNP is an intronic variant in the MYT1L gene found to be associated with adult ADHD (reported p = 8.00E-06), while the second SNP is an intronic one in the CHMP7 gene and was noted in a meta-analysis of ADHD in children (reported p = 3.00E-06) [16, 21]. Since no odds ratio and standard error was reported, we were unable to meta-analyze our data with these previously published results. S5 Table contains details of all top hits (p-value ≤ 1.00E-06) from previous GWA analyses pursued in our study.
To analyze SNPs within previously reported ADHD candidate genes, we utilized the list of 51 such genes curated by Brookes et al [49]. Overall, our data contained 826 SNPs in these candidate genes and 16 of them revealed p-values below 0.01 in the following genes: ADRA1A, DDC, PER2, SLC9A9, STX1A and TPH2 (S6 Table). SLC9A9 revealed 7 significant SNPs with the strongest signal being rs1393072 (OR = 1.46, 95% CI = 1.21–1.77, p = 9.95E-05). TPH2 was noted as the second most prominent gene with 5 significant SNPs and its strongest signal being rs17110690 (OR = 1.38, 95% CI = 1.14–1.66, p = 8.31E-04). Gene-based association tests affirmed these observations as only SLC9A9 and TPH2 genes reached overall p-values below 0.05 (p = 0.047 for SLC9A9 based on 209 SNPs and p = 0.015 for TPH2 based on 32 SNPs). S2 Fig depicts regional plots representing observed association signals annotated to SLC9A9 and TPH2 in this study.
Meta-analysis of our main findings and PGC ADHD GWAS results
Apart from examining previously reported ADHD candidate genes and GWAS hits, we also performed a meta-analysis of our top SNPs (p<1.00E-04) with the data from a large-scale ADHD GWAS meta-analysis conducted by PGC. Out of the 64 most significant SNPs observed in our study (S1A Table), 47 were available in the PGC data. The strongest signal was observed for rs11121424 (p = 4.32E-05) in the LOC100506022 gene (S7 Table).
Discussion
This is the first ADHD GWA analysis performed in the Norwegian population. Similarly to previous ADHD studies, we found no genome-wide significant SNPs at the standard genome-wide significance threshold (p<5.00E-08). However, several nominally significant (p<1.00E-05) variants were identified (Table 2). In addition, pathways analyses of associated intervals revealed a number of biological processes as well as protein interactions that are potentially relevant in the pathogenesis of ADHD (Tables 3 and 4).
The strongest signal in this GWAS was observed for rs9949006 on chromosome 18 (OR = 1.51, 95% CI 1.28–1.79, p = 1.64E-06). This SNP is a transcript variant of the non-coding RNA ENSG00000263745 gene. We have evaluated a possible function of rs9949006 using SNPinfo webserver (http://snpinfo.niehs.nih.gov), where no obvious gene-expression regulating activity was observed for this SNP. Nonetheless, non-protein coding RNAs play a critical role in regulation of gene expression and have been associated with a spectrum of human disorders, including neurodegeneration [51] and schizophrenia [52]. Non-coding RNA genes have also been observed among top hits in previous ADHD GWAS (S5 Table). In addition, it has been recently observed that SNPs previously associated with neurological and psychiatric conditions may be highly concentrated in the regions of long non-protein coding RNA genes [53].
Among our most significant SNPs, we have also noted a region on chromosome 3 as well as the TRIM36 and ZBTB16 genes (Table 2). The region on chromosome 3 can be identified as the regulatory ENSR00001484632 transcription factor binding feature, while both TRIM36 and ZBTB16 encode proteins that are expressed in the brain and are involved in the cell cycle regulation [54]. Functional evaluation of these SNPs in SNPinfo server (http://snpinfo.niehs.nih.gov) revealed possible gene-expression altering activity for rs17137481 only. This missense variant in the TRIM36 gene is predicted to be benign by both PolyPhen and SIFT. However, this SNP (rs17137481) is in strong LD (r2 = 0.826 in CEU population) with rs4146835, predicted to be a transcription-binding site (SNPinfo server). In addition, rs17137481 is also in strong LD with rs3805596 and rs2974527 (r2 = 0.885 and 0.826 respectively in CEU population), which are located in 3’-UTR region of the TRIM36 gene and are anticipated to be microRNA binding sites (SNPinfo server).
The TRIM36 protein is a multidomain E3 ubiquitin ligase that interacts with centromere protein-H and may be involved in differentiation and development during embryogenesis [54, 55]. This protein may be involved in protein–protein interactions [56], with a function in cell adhesion [57], the process implicated in the pathogenesis of ADHD by several previous studies [16, 17, 21, 58].
The variant in ZBTB16 is an intronic SNP involved in nonsense mediated RNA decay. Similarly to TRIM26, ZBTB16 is involved in cell cycle regulation by encoding a transcriptional repressor that was identified in patients with acute promyelocytic leukemia [59], while mutations in mice have revealed that ZBTB16 also plays an important role in skeletal development and spermatogonial stem-cell maintenance [60, 61]. Deletions of the chromosomal region containing ZBTB16 are known to associate with mental retardation, skeletal defects and genital hypoplasia (OMIM # 612447) [62]. Interestingly, ZBTB16 is associated with ethanol preference in mice [63]. It is well established that human ADHD patients have an increased risk of alcohol dependence and substance abuse [9, 64].
Apart from being involved in cell cycle regulation, both TRIM36 and ZBTB16 are also among genes in the reactome pathways of Class I MHC mediated antigen processing & presentation and Immune System (REACT_75842.1 and REACT_75820.1). Class I MHC pathways may be involved in brain development [65]. In addition, several neuro-immunological hypotheses have been offered as a possible explanation for the development of neuro-psychiatric disorders [66–68], including ADHD [69]. It is also known that some immune conditions (e.g. asthma) often co-occur with ADHD [70].
Examining enrichment of associated intervals among GO nodes revealed possible engagement of mechanisms involved in rRNA processing as well as skeletal and central nervous system development in the pathogenesis of ADHD (Table 3). The strongest enrichment was observed for rRNA processing (p = 2.00E-03) due to association signals in the regions containing UTP23 and EXOSC8 genes. Both UTP23 (encoding a small subunit processome component) and EXOSC8 (encoding exosome component) are involved in multiple cellular RNA processing and degradation events. Enrichment for these genes may suggest that, similarly to other neuro-developmental condition, gene expression regulating components could be involved in the etiology of ADHD [52, 71]. This observation is also in line with our main finding being located within a long non-protein coding RNA gene.
Interestingly, the ZBTB16 gene, where we noted some of our most prominent single point associations, was contained by the region contributing to the enrichment observed for the development of both skeletal and central nervous systems. In addition, signals in two other regions, encompassing POSTN and ADAM23 genes, also conferred enrichment for these two nodes. POSTN encodes the extracellular matrix glycoprotein periostin that is found in blood and peripheral tissues, while ADAM23 encodes a membrane-anchored protein (metalloprotease). Protein products of both of these genes are involved in cell adhesion, cell-cell and cell-matrix interactions, playing an important role in a variety of biological processes, including ADHD-relevant neurogenesis.
Since GO nodes are based on gene annotations only, we also conducted a protein-protein link exploration in DAPPLE software that utilizes experimental data. The results of this analysis did not show any direct interaction between proteins encoded by our nominally ADHD-associated loci. However, a number of significant intermediate interactors was recognized, with five of them surviving correction for multiple testing: CDH1 and CDH2, IL6, EIF2S2 and CTNNB1 (Table 4). Thus, it could be hypothesized that these genes highlight a protein network that may be impaired in ADHD. These protein-protein interactions may implicate two major networks (Fig 3): (1) cell adhesion (CDH1, CDH2, CTNNB1, CTNND2, BOC and CSNK1A1L genes); and (2) gene expression regulation and inflammation (ADAM23, YWHAZ, EIF2S2, IL6, EIF3H, ZBTB16, RPS27A, TRPC4, CCDC85B and PRLR genes). The above pathways are in line with previous findings showing that dysregulation during brain development (e.g. neurite outgrowth) may be important in the pathology of ADHD [13, 16, 25, 72].
Association with ADHD in this study was also examined in the form of gene-based tests. The most significant signal was noted for CCRN4L (p = 2.00E-07) that encodes a component of the circadian clock or downstream effector of clock function. In mammals, the circadian timing system controls many aspects of behavior and physiology, with its disruptions being implicated in major neuro-psychiatric disorders (including ADHD) at behavioral, endocrine and molecular levels [73–75].
To investigate the contribution of common SNPs to ADHD liability, we have estimated SNP-heritability using GCTA software. Similarly to previous observation in the large sample of European ancestry [76], our evaluation revealed the heritability of 28%. However, it is important to note that the large standard error in our estimations mirror the limited power to reliably determine the SNP-heritability.
The results of this study have been evaluated in the light of previously identified ADHD candidate genes and genome-wide association scans. While none of the previous GWAS hits replicated in our study (S5 Table), two candidate genes displayed several signals of association. SLC9A9 showed the strongest evidence of association with an intronic rs1393072, p-value of 9.95E-05 (S6 Table and S2 Fig). SLC9A9 encodes a sodium/hydrogen exchanger and may be of particular relevance to ADHD. This gene was found to be associated with a combined type of ADHD and it was noted among main signals in previous genome-wide linkage and association studies of ADHD [13, 49, 77]. Another candidate gene with a number of association signals observed in this study was TPH2 gene (S6 Table and S2 Fig). It encodes the enzyme tryptophan hydroxylase 2 that initiates serotonin synthesis in the nervous system [78]. Similarly to SLC9A9, the association between ADHD and TPH2 has previously been reported in numerous studies [19, 49, 79–81], although some negative results have also been reported [82].
This study should be viewed in the light of its limitations. There was no genome-wide significant observation for any SNP. One explanation for this could be that our study is of modest size (478 cases and 880 controls) and has examined common (MAF>1%) variants only. Thus, it has low power to detect common variants of small effect sizes.
Although assuming that performing GWAS on joined childhood and adult ADHD samples may improve our understanding of ADHD, it may also be a potential limitation. Thus, clinical heterogeneity may weaken the association signals [83]. This may occur, for example, due to the use of different assessment protocols; or due to the real genetic heterogeneity among different subtypes of ADHD [84]. It is currently unknown to which degree genetic and phenotypic heterogeneity impacts gene discovery in ADHD, and, in particular, how the genetics of ADHD change across the lifetime (from childhood to persistent ADHD).
In summary, we did not identify any gene loci reaching genome-wide significance, but found several promising candidates. Although replication in independent samples is warranted, these findings underline the genetic and phenotypic heterogeneity of ADHD. Taken together with previous findings, our results confirm the connection between biological processes important for brain development and ADHD, providing targets for further genetic exploration of this complex disorder.
Supporting Information
A) Associated SNPs with p < 1.00E-04. SNPs with p-value below 1.00E-05 are highlighted in bold. B) Association Intervals based on the tagging of the SNPs in part A. of this table.
(DOCX)
(DOCX)
(DOCX)
A) List of the genes reaching gene-based association p-value below 1.00E-03. "no.snps" refers to the number of SNPs annotated to the specified gene and tested as gene-based association. B) SNPs within CCRN4L gene.
(DOCX)
"NR" stands for "not reported", "NA" stands for "non-applicable" and "-" stands for no data in our dataset. SNPs reaching significance at 5% level in our GWAS analyses are highlighted in bold.
(DOCX)
The most significant SNP is highlighted in bold.
(DOCX)
"P(Fixed)", "OR(Fixed)" and "P(Random)","OR(Random)" refer to p-values and odds ratios under fixed and random effects modeling. "OR" refers to odds ratio, "SE" refers to standard error, "I" refers to I2 heterogeneity measure and "Q" refers to Cochran's Q heterogeneity measure.
(DOCX)
Top SNPs were defined as variants reaching p-value below 1.00E-05 in the performed GWAS. The SNPs are detailed in Table 2 in the main text. Results are presented in the form of graphs detailing expression of the probes containing the SNP of interest across its genomic region. Y axis refers to –log10 of the expression p-value, X axis refers to chromosomal position in basepairs and each colored line refers to the examined HapMap3 population. A) rs12497166 in intergenic region on chromosome 3. B) rs1019897 in intergenic region on chromosome 3. C) rs17137481 in TRIM36 gene. D) rs9949006 in ENSG00000263745 gene. E) rs2856244 in the vicinity of our top hit within ZBTB16 gene.
(TIFF)
A) SNPs observed around SLC9A9 gene. B) SNPs observed around TPH2 gene
(TIFF)
Data Availability
According to IRB approvals, data regarding participating individuals cannot be made publicly available. The paper and supplemental files contain extensive summary statistics information that should be adequate for most researchers who wish to follow up on the findings. In addition, the data used in this paper has been submitted to Psychiatric Genetics Consortium (PGC) repository where it can be accessed in accordance with PGC regulations (http://www.med.unc.edu/pgc/data-sharing). Furthermore, the leader of this project - Jan Haavik (jan.haavik@biomed.uib.no) - can be contacted for further details.
Funding Statement
The research leading to these results has received funding from the European Community's Seventh Framework Programme (FP7/2007–2013) under grant agreement n° 602805, from K.G. Jebsen foundation, from Research Council of Norway (#213837, #223273) and from South-East Norway Health Authority (#2013-123). The Norwegian Longitudinal ADHD Study was supported by funds and grants from the Norwegian Ministry of Health, The Norwegian Health Directorate, The South Eastern Health Region, G & PJ Sorensen Fund for Scientific Research, and from The Norwegian Resource Centre for ADHD, Tourettes Syndrome and Narcolepsy. The Norwegian Mother and Child Cohort Study is supported by the Norwegian Ministry of Health and the Ministry of Education and Research, NIH/NIEHS (contract no NO-ES-75558), NIH/NINDS (Grant No. 1 UO1 NS 047537-01), and the Norwegian Research Council/FUGE (Grant No. 151918/S10). The funders had no role in study design, data collection and analysis, decision to publish, or preparation of the manuscript.
References
- 1. Faraone SV, Perlis RH, Doyle AE, Smoller JW, Goralnick JJ, Holmgren MA, et al. Molecular genetics of attention-deficit/hyperactivity disorder. Biol Psychiatry. 2005. Jun 1;57(11):1313–23. [DOI] [PubMed] [Google Scholar]
- 2. Polanczyk G, de Lima MS, Horta BL, Biederman J, Rohde LA. The worldwide prevalence of ADHD: a systematic review and metaregression analysis. Am J Psychiatry. 2007. Jun;164(6):942–8. [DOI] [PubMed] [Google Scholar]
- 3. Harpin VA. The effect of ADHD on the life of an individual, their family, and community from preschool to adult life. Arch Dis Child. 2005. Feb;90 Suppl 1:i2–7. [DOI] [PMC free article] [PubMed] [Google Scholar]
- 4. Mannuzza S, Klein RG, Bessler A, Malloy P, LaPadula M. Adult outcome of hyperactive boys. Educational achievement, occupational rank, and psychiatric status. Arch Gen Psychiatry. 1993. Jul;50(7):565–76. [DOI] [PubMed] [Google Scholar]
- 5. Weiss G, Hechtman L. Hyperactive Children Grown Up: ADHD in Children, Adolescents, and Adults. New York: Guilford Press; 1993. [Google Scholar]
- 6. Matza LS, Paramore C, Prasad M. A review of the economic burden of ADHD. Cost Eff Resour Alloc. 2005. Jun 9;3:5 [DOI] [PMC free article] [PubMed] [Google Scholar]
- 7. Faraone SV, Biederman J. What is the prevalence of adult ADHD? Results of a population screen of 966 adults. J Atten Disord. 2005. Nov;9(2):384–91. [DOI] [PubMed] [Google Scholar]
- 8. Kessler RC, Adler L, Barkley R, Biederman J, Conners CK, Demler O, et al. The prevalence and correlates of adult ADHD in the United States: results from the National Comorbidity Survey Replication. Am J Psychiatry. 2006. Apr;163(4):716–23. [DOI] [PMC free article] [PubMed] [Google Scholar]
- 9. Halmoy A, Fasmer OB, Gillberg C, Haavik J. Occupational outcome in adult ADHD: impact of symptom profile, comorbid psychiatric problems, and treatment: a cross-sectional study of 414 clinically diagnosed adult ADHD patients. J Atten Disord. 2009. Sep;13(2):175–87. 10.1177/1087054708329777 [DOI] [PubMed] [Google Scholar]
- 10. Faraone SV, Mick E. Molecular genetics of attention deficit hyperactivity disorder. Psychiatr Clin North Am. 2010. Mar;33(1):159–80. 10.1016/j.psc.2009.12.004 [DOI] [PMC free article] [PubMed] [Google Scholar]
- 11. Freitag CM, Rohde LA, Lempp T, Romanos M. Phenotypic and measurement influences on heritability estimates in childhood ADHD. Eur Child Adolesc Psychiatry. 2010. Mar;19(3):311–23. 10.1007/s00787-010-0097-5 [DOI] [PubMed] [Google Scholar]
- 12. Kebir O, Tabbane K, Sengupta S, Joober R. Candidate genes and neuropsychological phenotypes in children with ADHD: review of association studies. J Psychiatry Neurosci. 2009. Mar;34(2):88–101. [PMC free article] [PubMed] [Google Scholar]
- 13. Franke B, Neale BM, Faraone SV. Genome-wide association studies in ADHD. Hum Genet. 2009. Jul;126(1):13–50. 10.1007/s00439-009-0663-4 [DOI] [PMC free article] [PubMed] [Google Scholar]
- 14. Gizer IR, Ficks C, Waldman ID. Candidate gene studies of ADHD: a meta-analytic review. Hum Genet. 2009. Jul;126(1):51–90. 10.1007/s00439-009-0694-x [DOI] [PubMed] [Google Scholar]
- 15. Johansson S, Halleland H, Halmoy A, Jacobsen KK, Landaas ET, Dramsdahl M, et al. Genetic analyses of dopamine related genes in adult ADHD patients suggest an association with the DRD5-microsatellite repeat, but not with DRD4 or SLC6A3 VNTRs. Am J Med Genet B Neuropsychiatr Genet. 2008. Dec 5;147B(8):1470–5. [DOI] [PubMed] [Google Scholar]
- 16. Lesch KP, Timmesfeld N, Renner TJ, Halperin R, Roser C, Nguyen TT, et al. Molecular genetics of adult ADHD: converging evidence from genome-wide association and extended pedigree linkage studies. J Neural Transm. 2008. Nov;115(11):1573–85. 10.1007/s00702-008-0119-3 [DOI] [PubMed] [Google Scholar]
- 17. Neale BM, Lasky-Su J, Anney R, Franke B, Zhou K, Maller JB, et al. Genome-wide association scan of attention deficit hyperactivity disorder. Am J Med Genet B Neuropsychiatr Genet. 2008. Dec 5;147B(8):1337–44. 10.1002/ajmg.b.30866 [DOI] [PMC free article] [PubMed] [Google Scholar]
- 18. Lasky-Su J, Anney RJ, Neale BM, Franke B, Zhou K, Maller JB, et al. Genome-wide association scan of the time to onset of attention deficit hyperactivity disorder. Am J Med Genet B Neuropsychiatr Genet. 2008. Dec 5;147B(8):1355–8. 10.1002/ajmg.b.30869 [DOI] [PMC free article] [PubMed] [Google Scholar]
- 19. Lasky-Su J, Neale BM, Franke B, Anney RJ, Zhou K, Maller JB, et al. Genome-wide association scan of quantitative traits for attention deficit hyperactivity disorder identifies novel associations and confirms candidate gene associations. Am J Med Genet B Neuropsychiatr Genet. 2008. Dec 5;147B(8):1345–54. 10.1002/ajmg.b.30867 [DOI] [PubMed] [Google Scholar]
- 20. Ashmore K, Cheng F. Genome-wide association studies on attention deficit hyperactivity disorder. Clinical and Experimental Pharmacology. 2013;3(1):119. [Google Scholar]
- 21. Neale BM, Medland SE, Ripke S, Asherson P, Franke B, Lesch KP, et al. Meta-analysis of genome-wide association studies of attention-deficit/hyperactivity disorder. J Am Acad Child Adolesc Psychiatry. 2010. Sep;49(9):884–97. 10.1016/j.jaac.2010.06.008 [DOI] [PMC free article] [PubMed] [Google Scholar]
- 22. Hinney A, Scherag A, Jarick I, Albayrak O, Putter C, Pechlivanis S, et al. Genome-wide association study in German patients with attention deficit/hyperactivity disorder. Am J Med Genet B Neuropsychiatr Genet. 2011. Dec;156B(8):888–97. 10.1002/ajmg.b.31246 [DOI] [PubMed] [Google Scholar]
- 23. Mick E, Todorov A, Smalley S, Hu X, Loo S, Todd RD, et al. Family-based genome-wide association scan of attention-deficit/hyperactivity disorder. J Am Acad Child Adolesc Psychiatry. 2010. Sep;49(9):898–905 e3. 10.1016/j.jaac.2010.02.014 [DOI] [PMC free article] [PubMed] [Google Scholar]
- 24. Stergiakouli E, Hamshere M, Holmans P, Langley K, Zaharieva I, Hawi Z, et al. Investigating the contribution of common genetic variants to the risk and pathogenesis of ADHD. Am J Psychiatry. 2012. Feb;169(2):186–94. [DOI] [PMC free article] [PubMed] [Google Scholar]
- 25. Poelmans G, Pauls DL, Buitelaar JK, Franke B. Integrated genome-wide association study findings: identification of a neurodevelopmental network for attention deficit hyperactivity disorder. Am J Psychiatry. 2011. Apr;168(4):365–77. 10.1176/appi.ajp.2010.10070948 [DOI] [PubMed] [Google Scholar]
- 26. Williams NM, Franke B, Mick E, Anney RJ, Freitag CM, Gill M, et al. Genome-wide analysis of copy number variants in attention deficit hyperactivity disorder: the role of rare variants and duplications at 15q13.3. Am J Psychiatry. 2012. Feb;169(2):195–204. [DOI] [PMC free article] [PubMed] [Google Scholar]
- 27. Addamo PK, Farrow M, Hoy KE, Bradshaw JL, Georgiou-Karistianis N. The effects of age and attention on motor overflow production—A review. Brain Res Rev. 2007. Apr;54(1):189–204. [DOI] [PubMed] [Google Scholar]
- 28. Rommelse NN, Altink ME, Arias-Vasquez A, Buschgens CJ, Fliers E, Faraone SV, et al. A review and analysis of the relationship between neuropsychological measures and DAT1 in ADHD. Am J Med Genet B Neuropsychiatr Genet. 2008. Dec 5;147B(8):1536–46. 10.1002/ajmg.b.30848 [DOI] [PubMed] [Google Scholar]
- 29. Barkley RA, Smith KM, Fischer M, Navia B. An examination of the behavioral and neuropsychological correlates of three ADHD candidate gene polymorphisms (DRD4 7+, DBH TaqI A2, and DAT1 40 bp VNTR) in hyperactive and normal children followed to adulthood. Am J Med Genet B Neuropsychiatr Genet. 2006. Jul 5;141B(5):487–98. [DOI] [PMC free article] [PubMed] [Google Scholar]
- 30. Elia J, Devoto M. ADHD genetics: 2007 update. Curr Psychiatry Rep. 2007. Oct;9(5):434–9. [DOI] [PubMed] [Google Scholar]
- 31. Franke B, Hoogman M, Arias Vasquez A, Heister JG, Savelkoul PJ, Naber M, et al. Association of the dopamine transporter (SLC6A3/DAT1) gene 9–6 haplotype with adult ADHD. Am J Med Genet B Neuropsychiatr Genet. 2008. Dec 5;147B(8):1576–9. 10.1002/ajmg.b.30861 [DOI] [PubMed] [Google Scholar]
- 32.Rohrer-Baumgartner N, Zeiner P, Eadie P, Egeland J, Gustavson K, Reichborn-Kjennerud T, et al. Language Delay in 3-Year-Old Children With ADHD Symptoms. J Atten Disord. 2013 Aug 13. [DOI] [PubMed]
- 33. Magnus P, Irgens LM, Haug K, Nystad W, Skjaerven R, Stoltenberg C. Cohort profile: the Norwegian Mother and Child Cohort Study (MoBa). Int J Epidemiol. 2006. Oct;35(5):1146–50. [DOI] [PubMed] [Google Scholar]
- 34. Egger HL, Erkanli A, Keeler G, Potts E, Walter BK, Angold A. Test-Retest Reliability of the Preschool Age Psychiatric Assessment (PAPA). J Am Acad Child Adolesc Psychiatry. 2006. May;45(5):538–49. [DOI] [PubMed] [Google Scholar]
- 35. Athanasiu L, Mattingsdal M, Kahler AK, Brown A, Gustafsson O, Agartz I, et al. Gene variants associated with schizophrenia in a Norwegian genome-wide study are replicated in a large European cohort. J Psychiatr Res. 2010. Sep;44(12):748–53. 10.1016/j.jpsychires.2010.02.002 [DOI] [PMC free article] [PubMed] [Google Scholar]
- 36. Westlye LT, Walhovd KB, Dale AM, Bjornerud A, Due-Tonnessen P, Engvig A, et al. Life-span changes of the human brain white matter: diffusion tensor imaging (DTI) and volumetry. Cereb Cortex. 2010. Sep;20(9):2055–68. 10.1093/cercor/bhp280 [DOI] [PubMed] [Google Scholar]
- 37. Tamnes CK, Ostby Y, Fjell AM, Westlye LT, Due-Tonnessen P, Walhovd KB. Brain maturation in adolescence and young adulthood: regional age-related changes in cortical thickness and white matter volume and microstructure. Cereb Cortex. 2010. Mar;20(3):534–48. 10.1093/cercor/bhp118 [DOI] [PubMed] [Google Scholar]
- 38. Selnes P, Fjell AM, Gjerstad L, Bjornerud A, Wallin A, Due-Tonnessen P, et al. White matter imaging changes in subjective and mild cognitive impairment. Alzheimers Dement. 2012. Oct;8(5 Suppl):S112–21. 10.1016/j.jalz.2011.07.001 [DOI] [PubMed] [Google Scholar]
- 39. Purcell S, Neale B, Todd-Brown K, Thomas L, Ferreira MA, Bender D, et al. PLINK: a tool set for whole-genome association and population-based linkage analyses. Am J Hum Genet. 2007. Sep;81(3):559–75. [DOI] [PMC free article] [PubMed] [Google Scholar]
- 40. Devlin B, Roeder K. Genomic control for association studies. Biometrics. 1999. Dec;55(4):997–1004. [DOI] [PubMed] [Google Scholar]
- 41. Yang TP, Beazley C, Montgomery SB, Dimas AS, Gutierrez-Arcelus M, Stranger BE, et al. Genevar: a database and Java application for the analysis and visualization of SNP-gene associations in eQTL studies. Bioinformatics. 2010. Oct 1;26(19):2474–6. 10.1093/bioinformatics/btq452 [DOI] [PMC free article] [PubMed] [Google Scholar]
- 42. Stranger BE, Montgomery SB, Dimas AS, Parts L, Stegle O, Ingle CE, et al. Patterns of cis regulatory variation in diverse human populations. PLoS Genet. 2012;8(4):e1002639 10.1371/journal.pgen.1002639 [DOI] [PMC free article] [PubMed] [Google Scholar]
- 43. Yang J, Lee SH, Goddard ME, Visscher PM. GCTA: a tool for genome-wide complex trait analysis. Am J Hum Genet. 2011. Jan 7;88(1):76–82. 10.1016/j.ajhg.2010.11.011 [DOI] [PMC free article] [PubMed] [Google Scholar]
- 44. Lee PH, O'Dushlaine C, Thomas B, Purcell SM. INRICH: interval-based enrichment analysis for genome-wide association studies. Bioinformatics. 2012. Jul 1;28(13):1797–9. 10.1093/bioinformatics/bts191 [DOI] [PMC free article] [PubMed] [Google Scholar]
- 45. Rossin EJ, Lage K, Raychaudhuri S, Xavier RJ, Tatar D, Benita Y, et al. Proteins encoded in genomic regions associated with immune-mediated disease physically interact and suggest underlying biology. PLoS Genet. 2011;7(1):e1001273 10.1371/journal.pgen.1001273 [DOI] [PMC free article] [PubMed] [Google Scholar]
- 46. Lips ES, Cornelisse LN, Toonen RF, Min JL, Hultman CM, Holmans PA, et al. Functional gene group analysis identifies synaptic gene groups as risk factor for schizophrenia. Mol Psychiatry. 2012. Oct;17(10):996–1006. 10.1038/mp.2011.117 [DOI] [PMC free article] [PubMed] [Google Scholar]
- 47. Hammerschlag AR, Polderman TJ, de Leeuw C, Tiemeier H, White T, Smit AB, et al. Functional gene-set analysis does not support a major role for synaptic function in attention deficit/hyperactivity disorder (ADHD). Genes (Basel). 2014;5(3):604–14. 10.3390/genes5030604 [DOI] [PMC free article] [PubMed] [Google Scholar]
- 48. Abecasis GR, Auton A, Brooks LD, DePristo MA, Durbin RM, Handsaker RE, et al. An integrated map of genetic variation from 1,092 human genomes. Nature. 2012. Nov 1;491(7422):56–65. 10.1038/nature11632 [DOI] [PMC free article] [PubMed] [Google Scholar]
- 49. Brookes K, Xu X, Chen W, Zhou K, Neale B, Lowe N, et al. The analysis of 51 genes in DSM-IV combined type attention deficit hyperactivity disorder: association signals in DRD4, DAT1 and 16 other genes. Mol Psychiatry. 2006. Oct;11(10):934–53. [DOI] [PubMed] [Google Scholar]
- 50. Identification of risk loci with shared effects on five major psychiatric disorders: a genome-wide analysis. Lancet. 2013. Apr 20;381(9875):1371–9. 10.1016/S0140-6736(12)62129-1 [DOI] [PMC free article] [PubMed] [Google Scholar]
- 51. Wapinski O, Chang HY. Long noncoding RNAs and human disease. Trends Cell Biol. 2011. Jun;21(6):354–61. 10.1016/j.tcb.2011.04.001 [DOI] [PubMed] [Google Scholar]
- 52. Perkins DO, Jeffries C, Sullivan P. Expanding the 'central dogma': the regulatory role of nonprotein coding genes and implications for the genetic liability to schizophrenia. Mol Psychiatry. 2005. Jan;10(1):69–78. [DOI] [PubMed] [Google Scholar]
- 53. Ning S, Zhao Z, Ye J, Wang P, Zhi H, Li R, et al. LincSNP: a database of linking disease-associated SNPs to human large intergenic non-coding RNAs. BMC Bioinformatics. 2014;15(1):152. [DOI] [PMC free article] [PubMed] [Google Scholar]
- 54. Miyajima N, Maruyama S, Nonomura K, Hatakeyama S. TRIM36 interacts with the kinetochore protein CENP-H and delays cell cycle progression. Biochem Biophys Res Commun. 2009. Apr 10;381(3):383–7. 10.1016/j.bbrc.2009.02.059 [DOI] [PubMed] [Google Scholar]
- 55. Yoshigai E, Kawamura S, Kuhara S, Tashiro K. Trim36/Haprin plays a critical role in the arrangement of somites during Xenopus embryogenesis. Biochem Biophys Res Commun. 2009. Jan 16;378(3):428–32. 10.1016/j.bbrc.2008.11.069 [DOI] [PubMed] [Google Scholar]
- 56. Kitamura K, Tanaka H, Nishimune Y. Haprin, a novel haploid germ cell-specific RING finger protein involved in the acrosome reaction. J Biol Chem. 2003. Nov 7;278(45):44417–23. [DOI] [PubMed] [Google Scholar]
- 57. Xu B, Ionita-Laza I, Roos JL, Boone B, Woodrick S, Sun Y, et al. De novo gene mutations highlight patterns of genetic and neural complexity in schizophrenia. Nat Genet. 2012. Dec;44(12):1365–9. 10.1038/ng.2446 [DOI] [PMC free article] [PubMed] [Google Scholar]
- 58. Mavroconstanti T, Johansson S, Winge I, Knappskog PM, Haavik J. Functional properties of rare missense variants of human CDH13 found in adult attention deficit/hyperactivity disorder (ADHD) patients. PLoS One. 2013;8(8):e71445 10.1371/journal.pone.0071445 [DOI] [PMC free article] [PubMed] [Google Scholar]
- 59. Chen Z, Brand NJ, Chen A, Chen SJ, Tong JH, Wang ZY, et al. Fusion between a novel Kruppel-like zinc finger gene and the retinoic acid receptor-alpha locus due to a variant t(11;17) translocation associated with acute promyelocytic leukaemia. EMBO J. 1993. Mar;12(3):1161–7. [DOI] [PMC free article] [PubMed] [Google Scholar]
- 60. Buaas FW, Kirsh AL, Sharma M, McLean DJ, Morris JL, Griswold MD, et al. Plzf is required in adult male germ cells for stem cell self-renewal. Nat Genet. 2004. Jun;36(6):647–52. [DOI] [PubMed] [Google Scholar]
- 61. Costoya JA, Hobbs RM, Barna M, Cattoretti G, Manova K, Sukhwani M, et al. Essential role of Plzf in maintenance of spermatogonial stem cells. Nat Genet. 2004. Jun;36(6):653–9. [DOI] [PubMed] [Google Scholar]
- 62. Fischer S, Kohlhase J, Bohm D, Schweiger B, Hoffmann D, Heitmann M, et al. Biallelic loss of function of the promyelocytic leukaemia zinc finger (PLZF) gene causes severe skeletal defects and genital hypoplasia. J Med Genet. 2008. Nov;45(11):731–7. 10.1136/jmg.2008.059451 [DOI] [PubMed] [Google Scholar]
- 63. Weng J, Symons MN, Singh SM. Ethanol-responsive genes (Crtam, Zbtb16, and Mobp) located in the alcohol-QTL region of chromosome 9 are associated with alcohol preference in mice. Alcohol Clin Exp Res. 2009. Aug;33(8):1409–16. 10.1111/j.1530-0277.2009.00971.x [DOI] [PubMed] [Google Scholar]
- 64. Haavik J, Halmoy A, Lundervold AJ, Fasmer OB. Clinical assessment and diagnosis of adults with attention-deficit/hyperactivity disorder. Expert Rev Neurother. 2010. Oct;10(10):1569–80. 10.1586/ern.10.149 [DOI] [PubMed] [Google Scholar]
- 65. Elmer BM, McAllister AK. Major histocompatibility complex class I proteins in brain development and plasticity. Trends Neurosci. 2012. Nov;35(11):660–70. 10.1016/j.tins.2012.08.001 [DOI] [PMC free article] [PubMed] [Google Scholar]
- 66. van Gent T, Heijnen CJ, Treffers PD. Autism and the immune system. J Child Psychol Psychiatry. 1997. Mar;38(3):337–49. [DOI] [PubMed] [Google Scholar]
- 67. Gabbay V, Klein RG, Alonso CM, Babb JS, Nishawala M, De Jesus G, et al. Immune system dysregulation in adolescent major depressive disorder. J Affect Disord. 2009. May;115(1–2):177–82. [DOI] [PMC free article] [PubMed] [Google Scholar]
- 68. Swedo SE, Leonard HL, Kiessling LS. Speculations on antineuronal antibody-mediated neuropsychiatric disorders of childhood. Pediatrics. 1994. Feb;93(2):323–6. [PubMed] [Google Scholar]
- 69. Warren RP, Odell JD, Warren WL, Burger RA, Maciulis A, Daniels WW, et al. Reading disability, attention-deficit hyperactivity disorder, and the immune system. Science. 1995. May 12;268(5212):786–8. [DOI] [PubMed] [Google Scholar]
- 70. Fasmer OB, Halmoy A, Eagan TM, Oedegaard KJ, Haavik J. Adult attention deficit hyperactivity disorder is associated with asthma. BMC Psychiatry. 2011;11:128 10.1186/1471-244X-11-128 [DOI] [PMC free article] [PubMed] [Google Scholar]
- 71. Ning S, Zhao Z, Ye J, Wang P, Zhi H, Li R, et al. LincSNP: a database of linking disease-associated SNPs to human large intergenic non-coding RNAs. BMC Bioinformatics. 2014;15:152 10.1186/1471-2105-15-152 [DOI] [PMC free article] [PubMed] [Google Scholar]
- 72. Yang L, Neale BM, Liu L, Lee SH, Wray NR, Ji N, et al. Polygenic transmission and complex neuro developmental network for attention deficit hyperactivity disorder: genome-wide association study of both common and rare variants. Am J Med Genet B Neuropsychiatr Genet. 2013. Jul;162B(5):419–30. 10.1002/ajmg.b.32169 [DOI] [PMC free article] [PubMed] [Google Scholar]
- 73. Rao ML, Gross G, Strebel B, Halaris A, Huber G, Braunig P, et al. Circadian rhythm of tryptophan, serotonin, melatonin, and pituitary hormones in schizophrenia. Biol Psychiatry. 1994. Feb 1;35(3):151–63. [DOI] [PubMed] [Google Scholar]
- 74. Mansour HA, Talkowski ME, Wood J, Chowdari KV, McClain L, Prasad K, et al. Association study of 21 circadian genes with bipolar I disorder, schizoaffective disorder, and schizophrenia. Bipolar Disord. 2009. Nov;11(7):701–10. 10.1111/j.1399-5618.2009.00756.x [DOI] [PMC free article] [PubMed] [Google Scholar]
- 75. Baird AL, Coogan AN, Siddiqui A, Donev RM, Thome J. Adult attention-deficit hyperactivity disorder is associated with alterations in circadian rhythms at the behavioural, endocrine and molecular levels. Mol Psychiatry. 2012. Oct;17(10):988–95. 10.1038/mp.2011.149 [DOI] [PubMed] [Google Scholar]
- 76. Lee SH, Ripke S, Neale BM, Faraone SV, Purcell SM, Perlis RH, et al. Genetic relationship between five psychiatric disorders estimated from genome-wide SNPs. Nat Genet. 2013. Sep;45(9):984–94. 10.1038/ng.2711 [DOI] [PMC free article] [PubMed] [Google Scholar]
- 77. Fisher SE, Francks C, McCracken JT, McGough JJ, Marlow AJ, MacPhie IL, et al. A genomewide scan for loci involved in attention-deficit/hyperactivity disorder. Am J Hum Genet. 2002. May;70(5):1183–96. [DOI] [PMC free article] [PubMed] [Google Scholar]
- 78. Lenartowski R, Goc A. Epigenetic, transcriptional and posttranscriptional regulation of the tyrosine hydroxylase gene. Int J Dev Neurosci. 2011. Dec;29(8):873–83. 10.1016/j.ijdevneu.2011.07.006 [DOI] [PubMed] [Google Scholar]
- 79. Sheehan K, Lowe N, Kirley A, Mullins C, Fitzgerald M, Gill M, et al. Tryptophan hydroxylase 2 (TPH2) gene variants associated with ADHD. Mol Psychiatry. 2005. Oct;10(10):944–9. [DOI] [PubMed] [Google Scholar]
- 80. Walitza S, Renner TJ, Dempfle A, Konrad K, Wewetzer C, Halbach A, et al. Transmission disequilibrium of polymorphic variants in the tryptophan hydroxylase-2 gene in attention-deficit/hyperactivity disorder. Mol Psychiatry. 2005. Dec;10(12):1126–32. [DOI] [PubMed] [Google Scholar]
- 81. McKinney J, Johansson S, Halmoy A, Dramsdahl M, Winge I, Knappskog PM, et al. A loss-of-function mutation in tryptophan hydroxylase 2 segregating with attention-deficit/hyperactivity disorder. Mol Psychiatry. 2008. Apr;13(4):365–7. 10.1038/sj.mp.4002152 [DOI] [PubMed] [Google Scholar]
- 82. Johansson S, Halmoy A, Mavroconstanti T, Jacobsen KK, Landaas ET, Reif A, et al. Common variants in the TPH1 and TPH2 regions are not associated with persistent ADHD in a combined sample of 1,636 adult cases and 1,923 controls from four European populations. Am J Med Genet B Neuropsychiatr Genet. 2010. Jul;153B(5):1008–15. 10.1002/ajmg.b.31067 [DOI] [PubMed] [Google Scholar]
- 83. Lee SH, Ripke S, Neale BM, Faraone SV, Purcell SM, Perlis RH, et al. Genetic relationship between five psychiatric disorders estimated from genome-wide SNPs. Nature Genetics. 2013. Sep;45(9):984-+. 10.1038/ng.2711 [DOI] [PMC free article] [PubMed] [Google Scholar]
- 84. McClellan J, King MC. Genetic heterogeneity in human disease. Cell. 2010. Apr 16;141(2):210–7. 10.1016/j.cell.2010.03.032 [DOI] [PubMed] [Google Scholar]
Associated Data
This section collects any data citations, data availability statements, or supplementary materials included in this article.
Supplementary Materials
A) Associated SNPs with p < 1.00E-04. SNPs with p-value below 1.00E-05 are highlighted in bold. B) Association Intervals based on the tagging of the SNPs in part A. of this table.
(DOCX)
(DOCX)
(DOCX)
A) List of the genes reaching gene-based association p-value below 1.00E-03. "no.snps" refers to the number of SNPs annotated to the specified gene and tested as gene-based association. B) SNPs within CCRN4L gene.
(DOCX)
"NR" stands for "not reported", "NA" stands for "non-applicable" and "-" stands for no data in our dataset. SNPs reaching significance at 5% level in our GWAS analyses are highlighted in bold.
(DOCX)
The most significant SNP is highlighted in bold.
(DOCX)
"P(Fixed)", "OR(Fixed)" and "P(Random)","OR(Random)" refer to p-values and odds ratios under fixed and random effects modeling. "OR" refers to odds ratio, "SE" refers to standard error, "I" refers to I2 heterogeneity measure and "Q" refers to Cochran's Q heterogeneity measure.
(DOCX)
Top SNPs were defined as variants reaching p-value below 1.00E-05 in the performed GWAS. The SNPs are detailed in Table 2 in the main text. Results are presented in the form of graphs detailing expression of the probes containing the SNP of interest across its genomic region. Y axis refers to –log10 of the expression p-value, X axis refers to chromosomal position in basepairs and each colored line refers to the examined HapMap3 population. A) rs12497166 in intergenic region on chromosome 3. B) rs1019897 in intergenic region on chromosome 3. C) rs17137481 in TRIM36 gene. D) rs9949006 in ENSG00000263745 gene. E) rs2856244 in the vicinity of our top hit within ZBTB16 gene.
(TIFF)
A) SNPs observed around SLC9A9 gene. B) SNPs observed around TPH2 gene
(TIFF)
Data Availability Statement
According to IRB approvals, data regarding participating individuals cannot be made publicly available. The paper and supplemental files contain extensive summary statistics information that should be adequate for most researchers who wish to follow up on the findings. In addition, the data used in this paper has been submitted to Psychiatric Genetics Consortium (PGC) repository where it can be accessed in accordance with PGC regulations (http://www.med.unc.edu/pgc/data-sharing). Furthermore, the leader of this project - Jan Haavik (jan.haavik@biomed.uib.no) - can be contacted for further details.