Abstract
Background & Aims
Nonalcoholic fatty liver disease (NAFLD) is independently associated with increased cardiovascular mortality. Although NAFLD is associated with dyslipidemia, it is not clear whether recently identified markers of cardiovascular risk indicate liver disease progression in patients with histologically confirmed NAFLD. We evaluated an extensive panel of serum markers of cardiovascular risk in non-diabetic patients with histologically proven NAFLD.
Methods
We performed a case–control study in which we compared serum levels of laboratory markers of cardiovascular risk among 81 non-diabetic subjects with histologically confirmed NAFLD vs lean (N=81) and obese (N=81) individuals without NAFLD (based on liver fat score, controls). For ex vivo studies, liver tissues were obtained from subjects undergoing elective cholecystectomy or a tissue repository.
Results
Subjects with NAFLD had increased serum levels of insulin, triglycerides, and apolipoprotein B (APOB); increased size and concentration of very large density lipoprotein particles; increased concentrations of low-density lipoprotein particles (LDL-Ps) and small-dense LDL (sdLDL) cholesterol, and increased percent sdLDL, compared with controls. Although nonalcoholic steatohepatitis was associated with a worse profile of serum atherogenic markers than NAFLD, these differences did not reach statistical significance. Despite hyperinsulinemia, levels of triglyceride and APOB, concentrations of LDL-P and LDL-C, and sdLDL-related parameters decreased significantly in patients with cirrhosis. Ex vivo studies showed that patients with NAFLD had increased sensitivity of hepatic triglyceride levels and cholesterol synthesis to insulin, and that sensitivity increased development of cirrhosis.
Conclusion
Atherogenic dyslipidemia is related to increased insulin-induced hepatic lipid synthesis in patients with NAFLD. Reduced dyslipidemia in patients with cirrhosis is associated with increased insulin resistance and possibly failed lipid synthesis.
Keywords: NASH, metabolic syndrome, obesity, steatosis, heart disease
Introduction
Nonalcoholic fatty liver disease (NAFLD) affects about a third of the adult population in North America1. It has two principal phenotypes2: (a) nonalcoholic fatty liver (NAFLD) and (b) nonalcoholic steatohepatitis (NASH). The presence of NAFLD, especially NASH, has been associated with increased cardiovascular events even after accounting for other features of the metabolic syndrome3,4. The underlying mechanisms for this are not fully understood. Historically, cardiovascular risk has been assessed in the laboratory from circulating levels of triglyceride, low-density lipoprotein cholesterol (LDL-C) and high-density lipoprotein cholesterol (HDL-C). It is now known that these laboratory parameters do not fully capture the cardiovascular risk and that lipoprotein particle size and concentration, apolipoprotein levels and other lipoprotein characteristics provide additional information about cardiovascular risk5–7. Consequently, cardiovascular risk profiling using an extended set of laboratory parameters is being increasingly used in routine clinical practice.
Several recent studies have evaluated the spectrum of lipoprotein abnormalities in NAFLD8–14. These studies are however limited by small sample size ranging from 8–16 subjects10–15 and lack of histological data8,9; consequently, it remains unknown whether the lipoprotein changes occur in all subjects with NAFLD or only those with NASH, the phenotype associated with increased cardiovascular mortality. Also, the impact of disease activity as well as progression to advanced fibrosis and cirrhosis on laboratory parameters reflective of cardiovascular risk remains unknown. This information is important to better define the “at risk” population and also to personalize management approaches in such individuals.
To address these gaps in knowledge, we performed studies to determine: (1) the impact of NAFLD phenotype (fatty liver versus steatohepatitis) on cardiovascular risk profile, (2) the impact of NAFLD disease activity on this profile, (3) the effect of disease progression to cirrhosis on the risk profile and (4) the potential mechanisms for these relationships.
MATERIALS AND METHODS
The test population included non-diabetic (DM) subjects with NAFLD of varying phenotypes who had an advanced cardiovascular risk profile obtained between 2010–2013. Such profiling is performed as part of routine care in the NAFLD clinic at the investigators institution. NAFLD was defined by consumption of less than 20 and 30 grams of alcohol every day for women and men respectively, and a liver biopsy demonstrating fatty liver disease2. The hepatic histology was assessed and quantified in a blinded manner by two hepatopathologists using the NASH-CRN criteria16. Presence of steatohepatitis was defined by steatosis, inflammation and either cytological ballooning or fibrosis; this criterion has been shown to correlate with liver related outcomes and overall mortality17. Cirrhosis was documented by a liver biopsy in all cases and in some cases the steatosis grade was < 1. In such cases, they were considered to have NASH-cirrhosis if they had a prior biopsy demonstrating NASH or met clinical criteria for cryptogenic cirrhosis due to NASH such as multiple features of the metabolic syndrome and absence of alternate causes of chronic liver disease. Only subjects with compensated cirrhosis and a CTP score<7 were included.
Many subjects with NAFLD have DM or are on hypolipidemic drugs, which would confound interpretation of the results. Therefore, to obtain proof of concept about whether various phenotypes of NAFLD affect atherogenic dyslipidemia, we limited our studies to nondiabetic subjects. We also excluded those taking any hypolipidemic agents.
Two control groups without NAFLD differing only in their BMI were studied: (1) lean (BMI<25 kg/m2) and (2) overweight-obese (BMI > 25 kg/m2). Both groups of control subjects had an ALT < 19 IU/l for women and < 31 IU/l for men, a liver fat score below the threshold for steatosis18, and absence of any known chronic medical disease. Imaging modality (i.e. liver ultrasound or MR spectroscopy) were not used in both groups of control subjects. They were age-, gender-, and BMI-matched (only in overweight-obese group) to the NAFLD population. For ex vivo studies of hepatic lipid metabolism, liver tissue was obtained from subjects who met these criteria who were undergoing elective cholecystectomy or from an anonymized tissue repository at the author’s institution.
Laboratory-Based Cardiovascular Risk Factors Measured
All of the tests were performed as part of a panel of tests for advanced cardiovascular risk assessment that is done routinely in a CLIA-approved commercial laboratory (Health Diagnostics LaboratoriesINC, Richmond, VA). The various atherogenic lipoproteins were measured are described in detailed further in Supplemental Material Section.
Ex vivo studies of lipid synthesis
Liver biopsy samples were obtained by percutaneous methods according to established protocols during elective cholecystectomy. The methodology is described in detail in the supplemental section but briefly; the liver tissue was incubated with a fixed concentration of palmitate/cyclodextrin (100µM of palmitate) and acetate (50µM). Individual liver samples were exposed to 14C palmitate (1 µCi), 3H acetate (10 µCi) as well as both together. Cellular lipids were extracted from the liver tissue following overnight19. Individual bands separated using thin layer chromatography were cut off the plate and placed into scintillation vials and radioactivity measured by scintillation counting. The incorporation of radiolabeled 14C and 3H into ketone bodies was assessed by measuring radioactivity of acid soluble medium.
Plan of Analysis
The data was analyzed in several steps. First, the distribution of lipid markers, lipoprotein particle characteristics, subparticles, markers of inflammation and metabolic parameters were compared in subjects with NAFLD with controls with and without increased BMI (lean vs. weight-matched controls). Next, to determine the impact of NASH, data for those with NASH were compared to those with NAFLD from within this cohort. Within the group of subjects with NAFLD, the relationship between the scores of individual histological parameters was correlated with individual laboratory markers of cardiovascular risk. Specifically, to assess the impact of fibrosis progression in patients with NAFLD on serum atherogenic risk profile, the risk profile was compared in patients with cirrhosis and non-cirrhotic patients.
Data analysis was performed using SPSS 20.0 (IBM, Chicago, IL). Across group comparisons of continuous variables were performed using ANOVA with corrections for multiple comparisons (Tukey’s HSD) as appropriate for normally distributed variables. A distribution-free test was used for variables that were not normally distributed. Spearman’s coefficient was computed to evaluate the correlation between various histological parameter scores and specific laboratory parameters. All data is presented as mean± S.D. unless otherwise stated. A P-value of less than .05 was considered significant.
Sample size
The sample size was calculated to identify differences of at least 25–30% between the groups with significance set 0.05 and power of 0.8 based on a standard deviation of 40% for individual lipoprotein parameters. Using these assumptions, a sample size of 30 in each group would be required to evaluate differences of 30% and 40 subjects would be required to identify differences of 25% between groups.
The data was analyzed entirely by the investigators who are fully responsible for the data and conclusions. The manuscript was reviewed and approved by all investigators prior to its submission.
RESULTS
Eighty-one subjects with biopsy-proven NAFLD met inclusion criteria and were used in the final analysis (Table 1). The obese control group was well matched to the NAFLD cohort with respect to age, gender and BMI. The lean group was well matched to the NAFLD and obese cohorts with respect to age and gender but the mean BMI was significantly lower (22.3±1.7kg/m2 vs. 32.9±6.1kg/m2 vs. 32.5±6.0kg/m2; P<.01). The serum AST and ALT levels were elevated in the NAFLD cohort compared to both lean and obese controls (P<.001 NAFLD vs. all).
Table 1.
Clinical and Histological Characteristics of Study Participants.
| Lean Normal (N=81) |
Obese Normal (N=81) |
NAFLD (N=81) |
|
|---|---|---|---|
| DEMOGRAPHICS | |||
| Age (years) | 57±11 | 54±13 | 54±13 |
| BMI (kg/m2) | 22.3±1.7 | 32.5±6.1 | 32.9±6.0* |
| Gender (%Male) | 71% | 71% | 62% |
| ETHNICITIES (% of cohort) | |||
| Caucasian | -- | -- | 94.6 |
| African American | -- | -- | 2.7 |
| Other | -- | -- | 2.7 |
| AMINOTRANSFERAES | |||
| ALT (IU/mL) | 17±5 | 17±5 | 56±39** |
| AST (IU/mL) | 22±6 | 20±4 | 45±31** |
| HISTOLOGY | |||
| Steatosis (%) | |||
| Less than 5% | -- | -- | 2.5 |
| Between 5–33% | -- | -- | 48.8 |
| Between 34–66% | -- | -- | 35.9 |
| More than 66% | -- | -- | 14.1 |
| Lobular Inflammation (%) | |||
| None | -- | -- | 11.7 |
| Less than 2/20× HPF | -- | -- | 63.6 |
| Between 2–4/20× per HPF | -- | -- | 22.1 |
| More than 4/20× per HPF | -- | -- | 2.6 |
| Cytologic Ballooning (%) | |||
| None | -- | -- | 46.2 |
| Few | -- | -- | 34.6 |
| Many | -- | -- | 19.2 |
| Fibrosis (%) | |||
| None | -- | -- | 34.6 |
| 1a: Zone 3 fibrosis Trichrome | -- | -- | 11.1 |
| 1b: Zone 3 fibrosis H & E | -- | -- | 2.5 |
| 1c: Portal fibrosis only | -- | -- | 7.4 |
| 2: Zone 3 and portal fibrosis | -- | -- | 11.1 |
| 3: Bridging Fibrosis | -- | -- | 16 |
| 4: Cirrhosis | -- | -- | 17.3 |
p<0.001 NAFLD vs lean;
P<.001 NAFLD vs lean/obese
Cardiovascular risk factor profile is worsened in subjects with NAFLD
There was a stepwise increase in fasting insulin concentrations from lean to obese controls to NAFLD (P<.0001) (Table 2). Serum free fatty acids levels were significantly higher in patients with NAFLD compared to both lean and obese individuals reflecting a higher level of adipose tissue insulin resistance. Subjects with NAFLD had a higher mean LDL-C (118±41mg/dl) compared to both control groups. They also had significantly higher serum concentrations of LDL particles (LDL-P) (NAFLD vs lean vs obese controls: 1717±684 vs 1432±456 vs 1447±469nmol/L) and sdLDL-C (36.8±17.3 vs 25.1±9.5 vs 24.1±9.6mg/dl) compared to both lean and obese controls (P<.01 for all comparisons). Similar data were also obtained for %sdLDL and sdLDL particle concentration (sdLDL-P). Subjects with NAFLD also had higher levels of apoB (101±31mg/dl) and VLDL-particle concentrations (VLDL-P; 3.2±3.1nmol/L) compared to both control groups (P<.001) while VLDL particle size were similar to obese controls and higher than in lean controls. HDL-cholesterol (HDL-C) and HDL-subclass 2 (HDL-2) was comparable between obese controls and those with NAFLD but lower compared to lean controls. Serum homocysteine levels were however higher in patients with NAFLD compared to obese controls (13±3.5 vs. 11.7±3.4; P<.001).
Table 2.
Serum Atherogenic Risk Profile in Lean, Obese and NAFLD Cohorts.
| LEAN (N=81) |
OBESE (N=81) |
NAFLD (N=81) |
|
|---|---|---|---|
| TRADITIONAL PARAMETERS | |||
| Cholesterol-Total (mg/dL) | 198±38 | 185±42*** | 203±49 |
| HDL-C (mg/dL) | 63±16 | 53±18‡ | 55±15* |
| LDL-C (mg/dL) | 105±29 | 98±31 | 118±41** |
| Triglycerides (mg/dL) | 104±53 | 113±58 | 154±87** |
| LOW DENSITY LIPOPROTEIN | |||
| LDL-P (nmol/L) | 1432±456 | 1447±469 | 1717±684** |
| Small-density LDL-C (mg/dL) | 25.1±9.5 | 24.1±9.6 | 36.8±17.3** |
| % Small-density LDL | 24.1±9.6 | 24.8±7,5 | 32.6±15.7** |
| Small density LDL-P (nmol/L) | 591±388 | 652±355 | 870±654** |
| VERY LOW DENSITY LIPOPROTEIN | 89±22 | 87±23 | 101±31** |
| Apolipoprotein-B (mg/dL) | 1.4±1.5 | 2.1±2.3 | 3.2±3.1** |
| VLDL-P (nmol/L) | 43.4±4.9 | 45.1±5.5‡ | 47.1±5.2* |
| VLDL size (nm) | |||
| HIGH DENSITY LIPOPROTEIN | |||
| Apolipoprotein-A1 (mg/dL) | 168±32 | 154±34‡ | 148±30* |
| HDL-2 (mg/dL) | 15.4±6.7 | 13.3±6.8 | 12.7±6* |
| HDL-P (nmol/L) | 36.7±6.2 | 33.8±7.5‡ | 33.0±5.7 |
| INSULIN RESISTANCE | |||
| Free Fatty Acids (mmol/L) | 0.65±0.28 | 0.60±0.23 | 0.76±0.24** |
| Glucose (mg/dL) | 89±3 | 89±5 | 83±14** |
| Insulin (uU/mL) | 6.6±4.4 | 12.6±10.4‡ | 19.7±13.2** |
| Hemoglobin A1c (%) | 5.3±0.3 | 5.5±0.4‡ | 5.6±0.5** |
| IRHOMA | 1.45±0.95 | 2.75±2.16‡ | 4.36±3.13** |
| INFLAMMATORY | |||
| Fibrinogen (mg/dL) | 390±114 | 447±117‡ | 406±85*** |
| hs-C-Reactive Protein (mg/L) | 2.0±4.0 | 4.1±5.8‡ | 3.7±3.4* |
| Myeloperoxidase (pmol/L) | 388±113 | 473±148‡ | 445±123* |
| METABOLIC | |||
| Homocysteine (umol/L) | 11.7±3.8 | 11.3±3.4 | 13±3.5*** |
| MISCELLANEOUS | |||
| ApoB:Apo-A1 ratio | 0.56±0.20 | 0.59±0.20 | 0.70±0.26** |
| Lp(a)-mass | 34.3±37 | 49.8±51.4‡ | 23.1±26.5*** |
| Lp-PLA2 | 157±42 | 130±40‡ | 163±40*** |
P<.01 lean vs obese,
P<.01 NAFLD vs lean;
P<.01 NAFLD vs lean/obese,
P <0.01 Obese vs. NAFLD
Atherogenic profile is similar between patients with NASH and NAFLD
Thirty-two subjects had NAFLD whereas 35 had NASH (Table 3). Patients with cirrhosis (N=14) were excluded because of the major effects of cirrhosis on hepatic metabolism and function. Subjects with NASH had higher circulating serum concentrations of LDL-P (1784±753nmol/L vs 1619±570nmol/L) and sdLDL-P (935±708nmol/L vs. 710±497nmol/L) but these did not reach statistical significance. Serum sdLDL and VLDL-related parameters were also similar between those with NAFLD and NASH. Finally, all measured metabolic, inflammatory and coagulation related parameters were comparable between NASH versus NAFLD.
Table 3.
Serum Atherogenic Profile in Patients with NAFLD, NASH and cirrhosis.
| Simple Steatosis (N=32) |
Steatohepatitis (N=35) |
Cirrhosis (N=14) |
|
|---|---|---|---|
| DEMOGRAPHICS | |||
| Age (years) | 53±13 | 56±13 | 61±8 |
| BMI (kg/m2) | 32.6±6.0 | 33.2±6.2 | 34.7±6.0 |
| ALT (IU/mL) | 61±42 | 51±37 | 41±17 |
| AST (IU/mL) | 49±38 | 42±25 | 48±21 |
| Gender (%M) | 13 (40.6%) | 11 (31.4) | 3 (21.4) |
| TRADITIONAL PARAMETERS | |||
| Cholesterol-Total (mg/dL) | 202±40 | 204±56 | 171±30** |
| HDL-C (mg/dL) | 58±22 | 49±13 | 49±11 |
| LDL-C (mg/dL) | 120±36 | 118±46 | 92±28** |
| Triglycerides (mg/dL) | 147±73 | 160±98 | 109±39** |
| LOW DENSITY LIPOPROTEIN | |||
| LDL-P (nmol/L) | 1619±570 | 1784±753 | 1327±601** |
| Small-density LDL-C (mg/dL) | 36.8±17.3 | 36.7±17.5 | 23.0±12.1** |
| % Small-density LDL | 31.8±13.5 | 33.1±17.3 | 24.1±6.4** |
| Small density LDL-P (nmol/L) | 710±497 | 935±708 | 736±361 |
| VERY LOW DENSITY LIPOPROTEIN | |||
| Apolipoprotein-B (mg/dL) | 97±26 | 103±34 | 81±25** |
| VLDL-P (nmol/L) | 3.3±3.7 | 3.1±2.9 | 1.9±1.3 |
| VLDL size (nm) | 46.3±7.8 | 47.5±3.2 | 45.8±3.8 |
| HIGH DENSITY LIPOPROTEIN | |||
| Apolipoprotein-A1 (mg/dL) | 154±26 | 144±31 | 136±49 |
| HDL-2 (mg/dL) | 12.5±5.3 | 12.8±6.1 | 15.1±9.4 |
| INSULIN RESISTANCE | |||
| Adiponectin | 12.4±7.9 | 9.7±5.4 | 11.4±6.7 |
| Free Fatty Acids (mmol/L) | 0.71±0.24 | 0.79±0.23 | 0.83±0.2 |
| Glucose (mg/dL) | 82±16 | 85±13 | 81±13 |
| Insulin (uU/mL) | 18.4±14.5 | 20.1±11.8 | 24±9 |
| Hemoglobin A1c (%) | 5.5±0.5 | 5.6±0.5 | 5.6±0.6 |
| INFLAMMATORY | |||
| Fibrinogen (mg/dL) | 411±81 | 403±89 | 426±86 |
| hs-C-Reactive Protein (mg/L) | 3.1±2.8 | 4.0±3.8 | 3.1±2.1 |
| Myeloperoxidase (pmol/L) | 423±112 | 458±131 | 454±81 |
| METABOLIC | |||
| Homocysteine (umol/L) | 12.9±3.3 | 13.0±3.8 | 14.0±3.8 |
| MISCELLANEOUS | |||
| ApoB:Apo-A1 ratio | 0.66±0.23 | 0.74±0.27 | 0.54±0.31** |
| Lp(a)-mass | 28.2±31.3 | 19.4±22.3 | 28.4±32.9 |
| Lp-PLA2 | 168±40 | 160±40 | 180±69 |
P<.01 NAFLD vs. NASH;
P<0.05 Cirrhosis vs No-Cirrhosis
Severity of disease activity affects cardiovascular risk factor profile
The severity of hepatic steatosis was directly related to VLDL-P, ALT and serum insulin concentrations and indirectly to homocysteine (Supplemental Table 1). Lobular inflammation was inversely related to HDL-C and apolipoprotein-A1 (apoA1) and directly related to LDL-P, sdLDL-P, %sdLDL, and serum triglyceride concentrations. The severity of inflammation and cytologic ballooning was directly related to serum insulin levels and inversely to HDL-C. The degree of hepatic fibrosis was directly related to age, FFA, insulin and homocysteine levels. Hepatic fibrosis was inversely related to ALT, HDL-C, HDL particle concentration (HDL-P), and LDL and total cholesterol concentrations.
Impact of disease progression to cirrhosis on cardiovascular risk factor profile (Table 3)
For this analysis, subjects with cirrhosis (n=14) were compared to those without cirrhosis (n=67). Non-cirrhotic and cirrhotic subjects were similar in regards to age, BMI and serum aminotransferases. Serum insulin concentrations were higher in subjects with higher steatotic and fibrosis grade. Adiponectin levels were similar in cirrhotic and non-cirrhotic subjects. Subjects with cirrhosis had both lower LDL-P and LDL-C levels compared to those with earlier stages of disease. Also, those with cirrhosis had lower sdLDL-C and % sdLDL compared to subjects without cirrhosis. Subject with cirrhosis also had lower serum triglyceride levels that were accompanied by a decrease in VLDL particle concentration and size.
Increased lipid synthesis drives dyslipidemia in pre-cirrhotic NAFLD
Triglyceride and cholesterol synthesis rates are known to drive circulating triglyceride, VLDL particle size and concentration, and LDL-C levels20. Insulin is the major circulating factor that drives lipid synthesis. We therefore looked for evidence for increased lipid synthesis and the relationship between insulin levels and markers of lipid synthesis versus circulating lipids and lipoprotein characteristics.
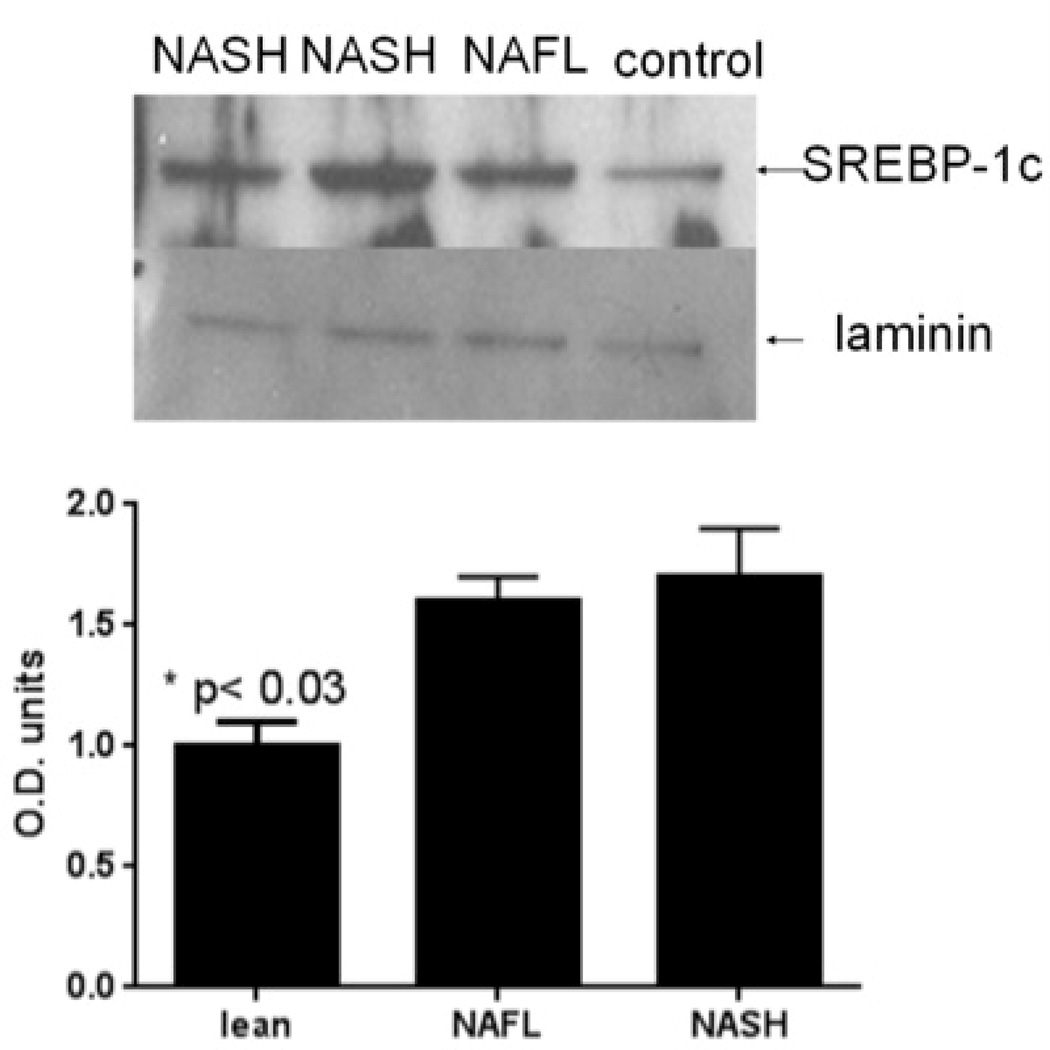
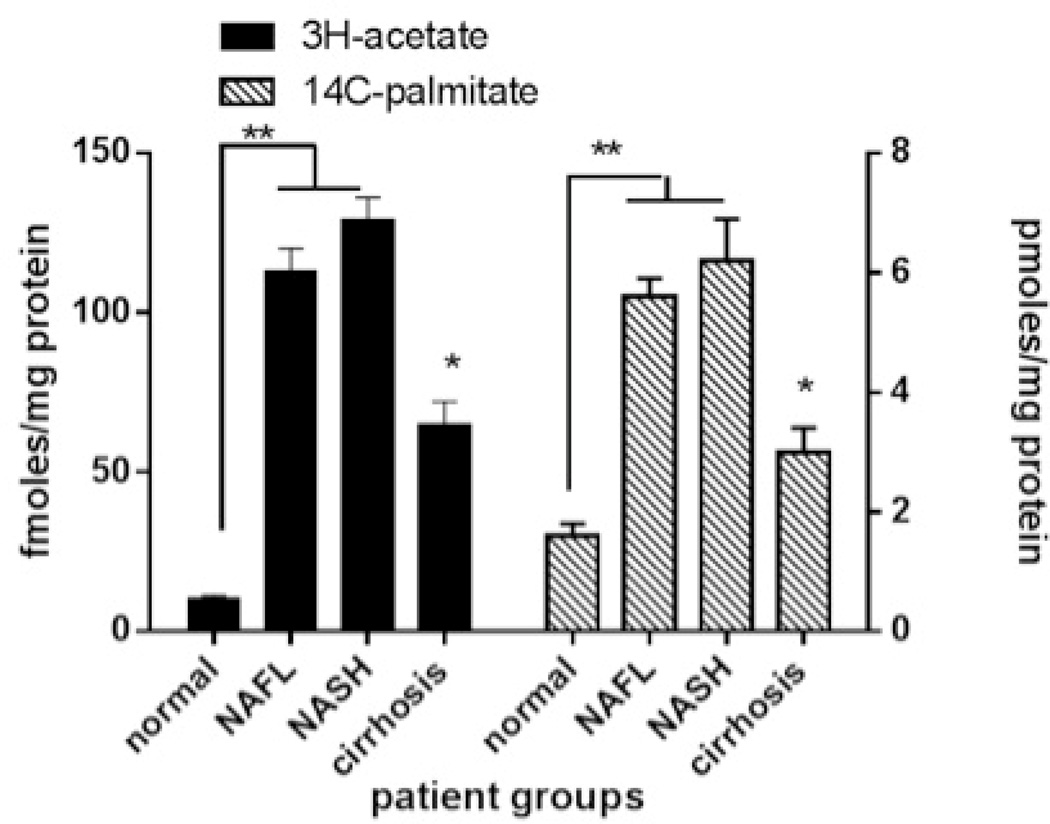
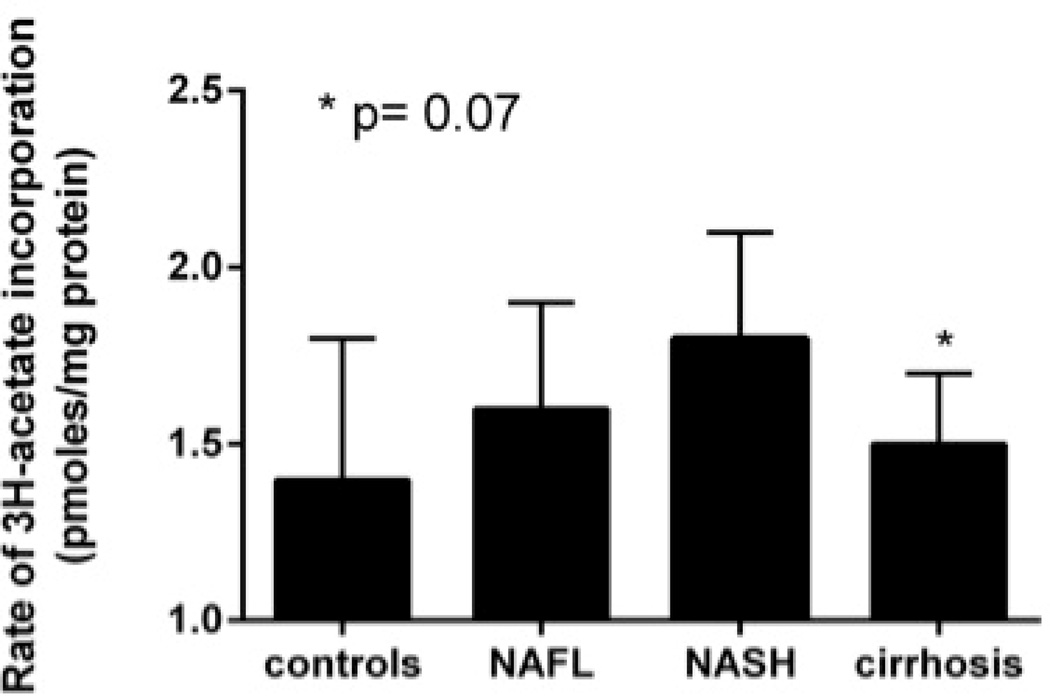
There was greater activation of SREBP-1c, the master transcriptional regulator of triglyceride synthesis that is activated by insulin, in subjects with NAFLD or pre-cirrhotic NASH compared to controls (Fig. 1A). To further confirm increased triglyceride and cholesterol synthesis in NAFLD and NASH, freshly harvested liver cores were incubated in media containing 3H-acetate (50 µM),14C-palmitate (100 µM) and 25 µU/ml of insulin (a relevant concentration seen in those with metabolic syndrome). Hepatic incorporation of both 3H-acetate and 14C-palmitate in to triglycerides in vitro were significantly higher in NAFLD or NASH compared to controls (Fig. 1B). When liver tissue was exposed to 3H-acetate in vitro, the incorporation of acetate in to cholesterol was also significantly higher in subjects with NAFLD and NASH compared to controls (Fig. 1C). Hepatic ketogenesis was also higher in subjects with NAFLD or NASH.
Figure 1. Hyperinsulinemia and dyslipidemia in NAFLD.
A. Compared to controls, patients with NAFLD and NASH had higher hepatic sterol regulatory element binding protein-1 (SREBP-1) expression (P<.03 NAFLD/NASH vs control). Laminin was used as a loading control.
B. Rate of 3H-acetate and 14C-palmitate incorporation into triglycerides by hepatocytes was increased in NAFLD/NASH (P<.01) and decreased with progression to cirrhosis (P<.01 NAFLD/NASH vs cirrhosis).
C. Rate of 3H-acetate into cholesterol in hepatocytes was significantly higher in NAFLD/NASH (P<.05 vs controls) and trended down with progression to cirrhosis (p=0.07 NAFLD/NASH vs cirrhosis).
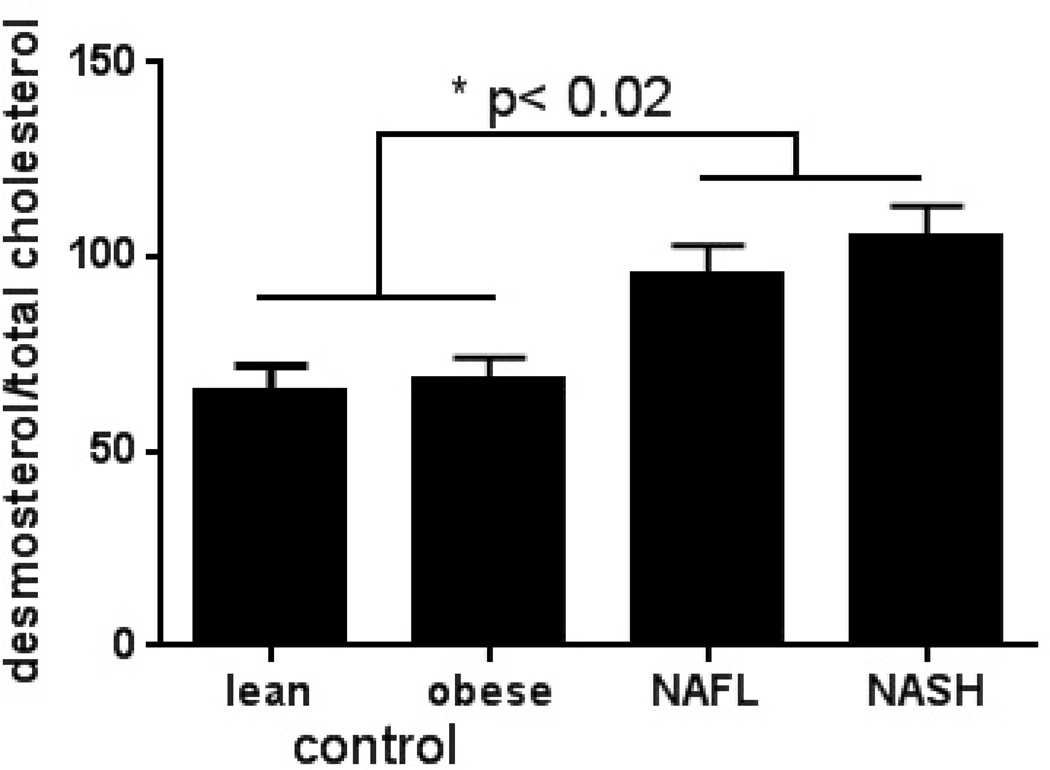
D. Desmosterol:total cholesterol ratio was significantly higher in subjects with NAFLD and NASH compared to lean and obese controls (P<.02 lean/obese controls vs. NAFLD/NASH). All data is presented as means ± S.E.M.
NAFLD and pre-cirrhotic NASH were also associated with greater degree of hyperinsulinemia (Table 3). The circulating insulin levels were directly correlated with triglycerides (R=0.242, P=.026), VLDL-P (R=0.242, P=.029) and VLDL-size (R=0.226, P=.06). The desmosterol:total cholesterol ratio, a validated marker of cholesterol synthetic activity21, was higher in pre- NAFLD and NASH compared to controls and tracked LDL-C and sdLDL-C (Fig. 1D).
Improvement in dyslipidemia in cirrhosis is due lipid synthetic failure
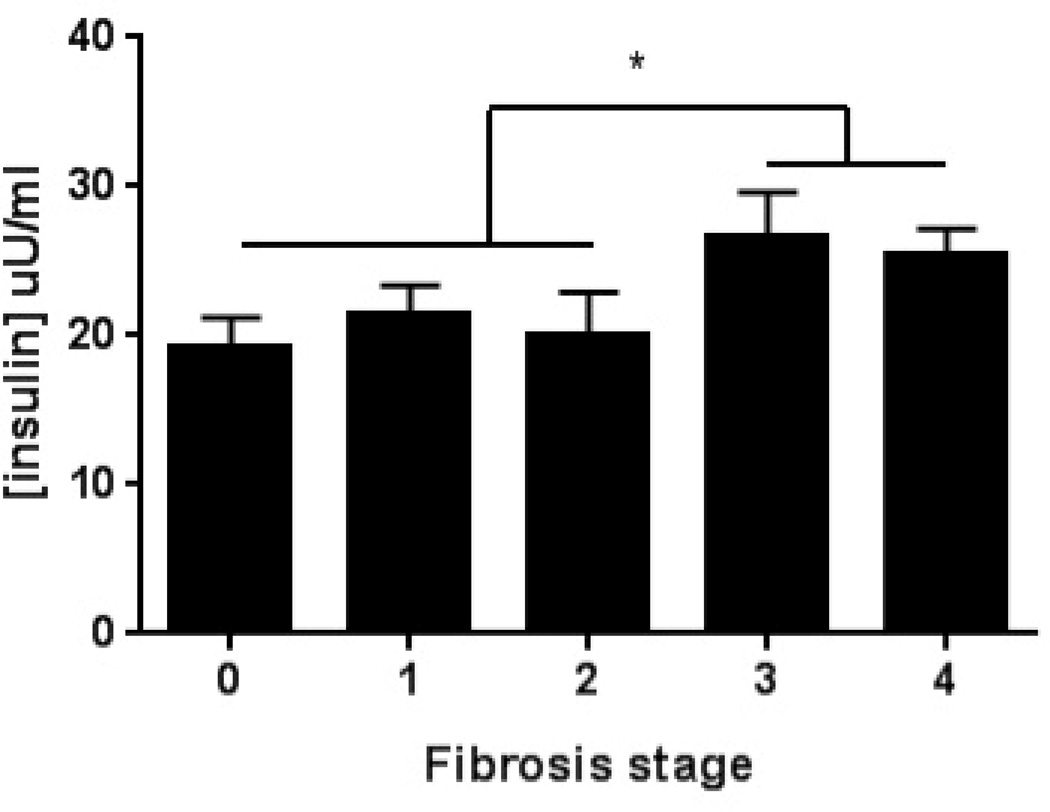
Subjects with cirrhosis had the most severe form of insulin resistance (Fig. 2A and Table 3). Ex vivo studies of triglyceride and cholesterol synthesis indicated that, at constant ambient insulin concentrations (25 mU/ml), the incorporation of 3H-acetate and 14C-palmitate in to triglycerides decreased in those with cirrhosis compared to pre-cirrhotic NAFLD (Fig. 1B). The incorporation of labeled acetate in to cholesterol also decreased in those with cirrhosis compared to pre-cirrhotic NAFLD (Fig. 1C).
Figure 2. Impact of cirrhosis on hepatic lipid synthesis in NAFLD.
A. Serum insulin concentrations are increased in patients with advanced fibrosis (P<.01 fibrotic stage 0–2 vs 3–4).
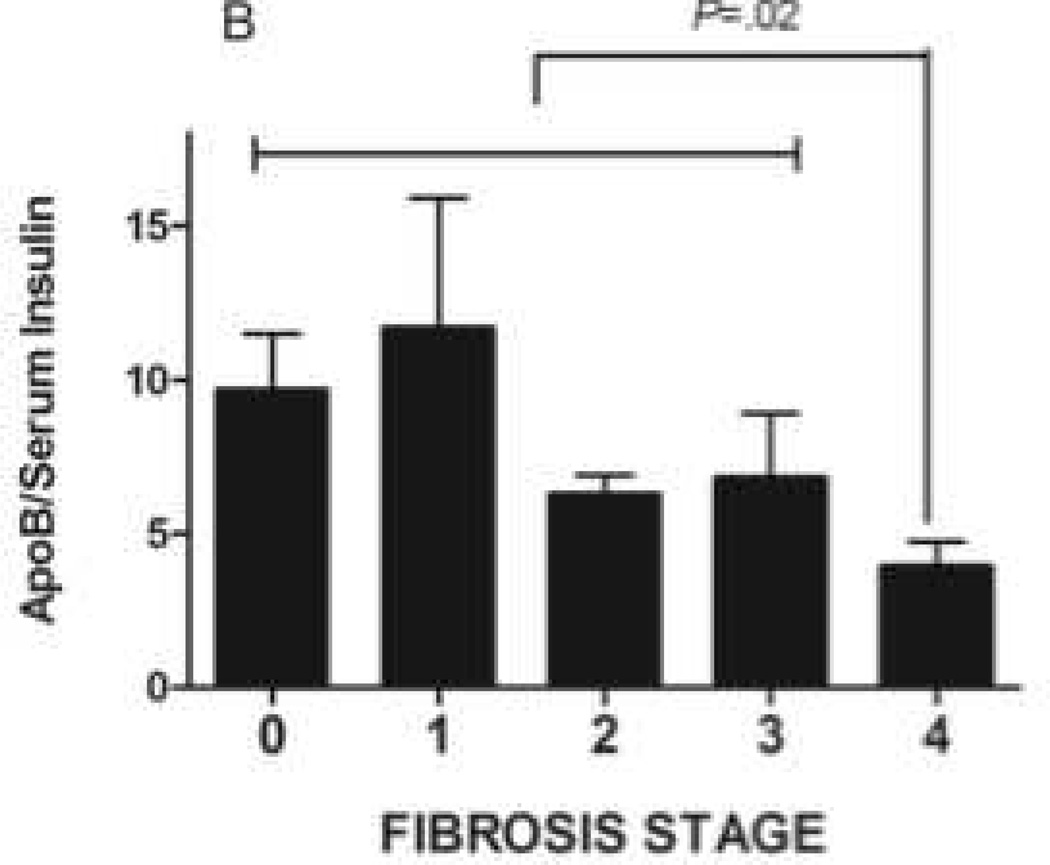
B. Serum apolipoprotein-B:insulin ratio decreased significantly as patients with NAFLD progressed to cirrhosis (P=.02)
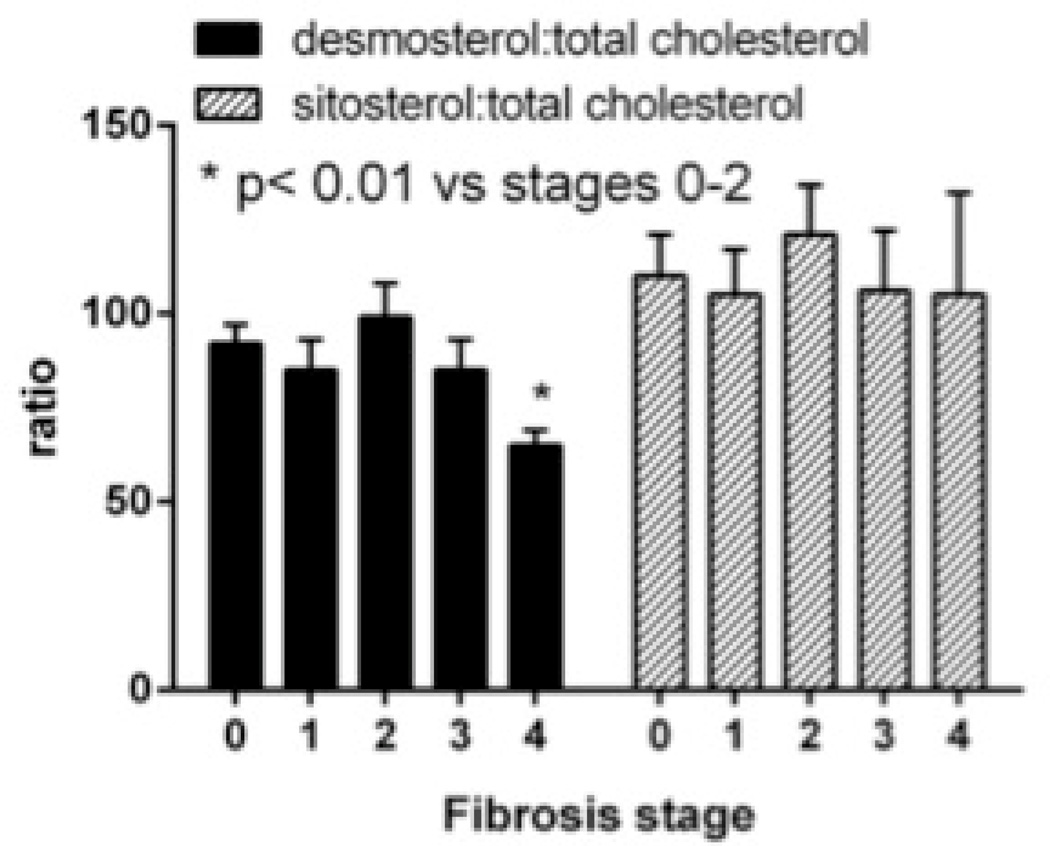
C. Desmosterol:total cholesterol declined in patients with cirrhosis (P<.01 cirrhosis vs. fibrosis stage 0–2). There was no significant difference in sitosterol:total cholesterol ratio.
There was additional indirect evidence connecting decreased lipid synthesis to reversal of pre-cirrhotic NAFLD related changes in lipids and lipoproteins with development of cirrhosis. ApoB and triglyceride levels, corrected for ambient insulin, both decreased significantly with disease progression to cirrhosis (Fig. 2B). The desmosterol:total cholesterol ratio also declined with progression to cirrhosis indicating decreased cholesterol synthetic activity (Fig. 2C). The sitosterol:total cholesterol ratio, a marker of cholesterol absorption was similar across the fibrosis stages.
Impaired HDL maturation in NAFLD
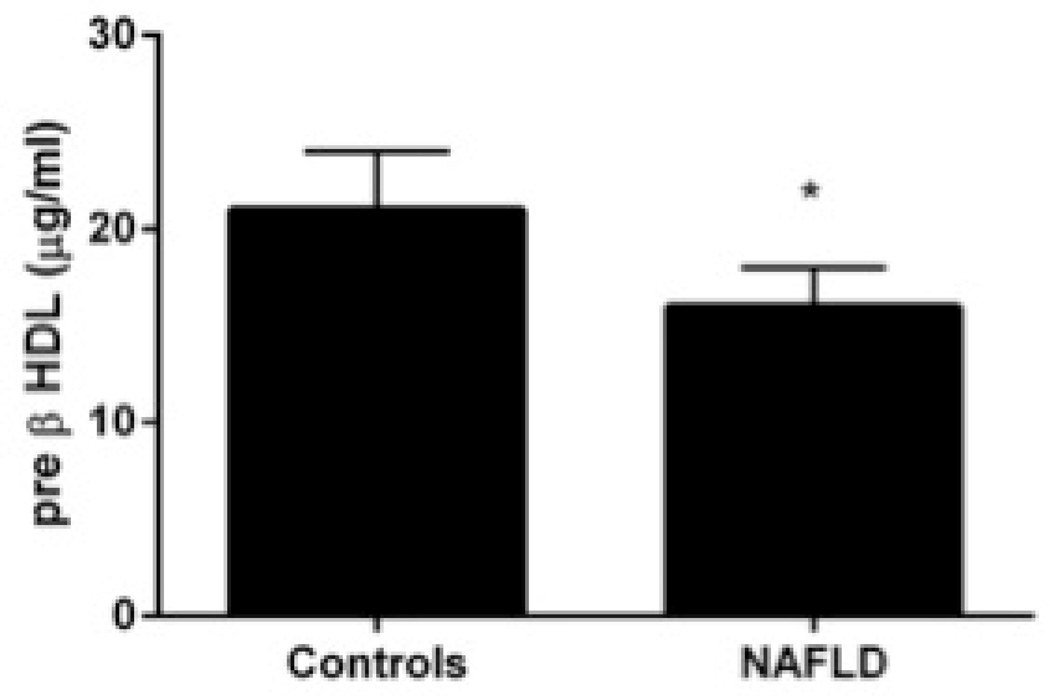
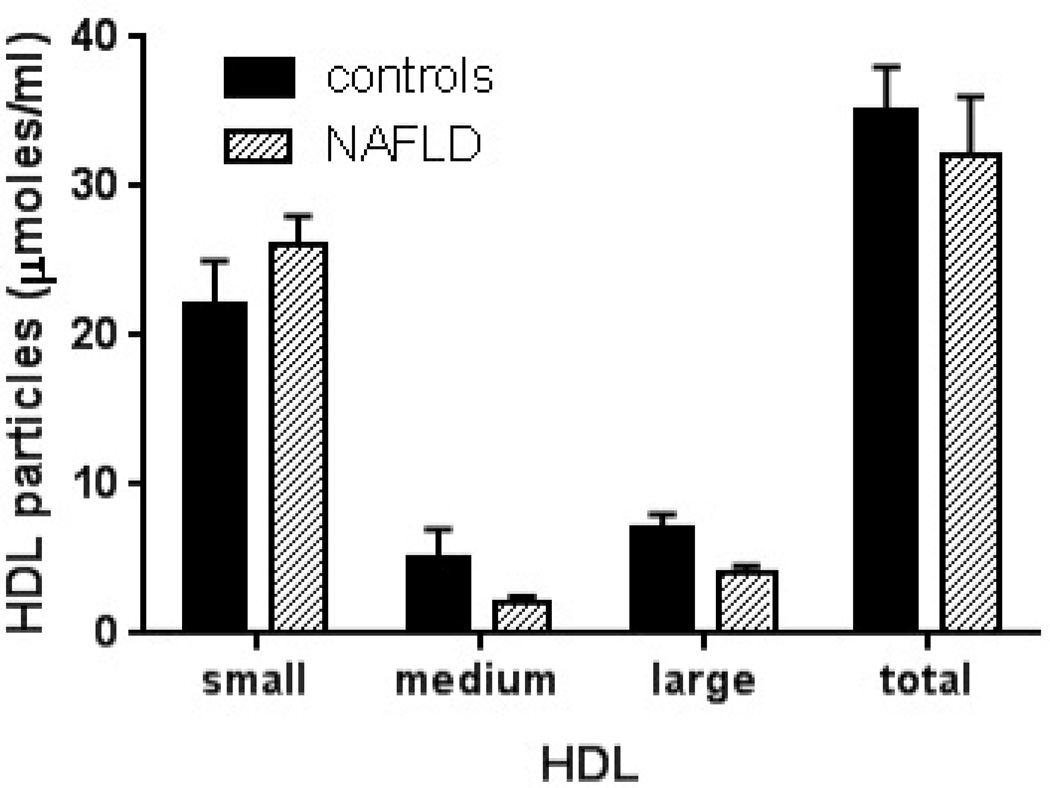
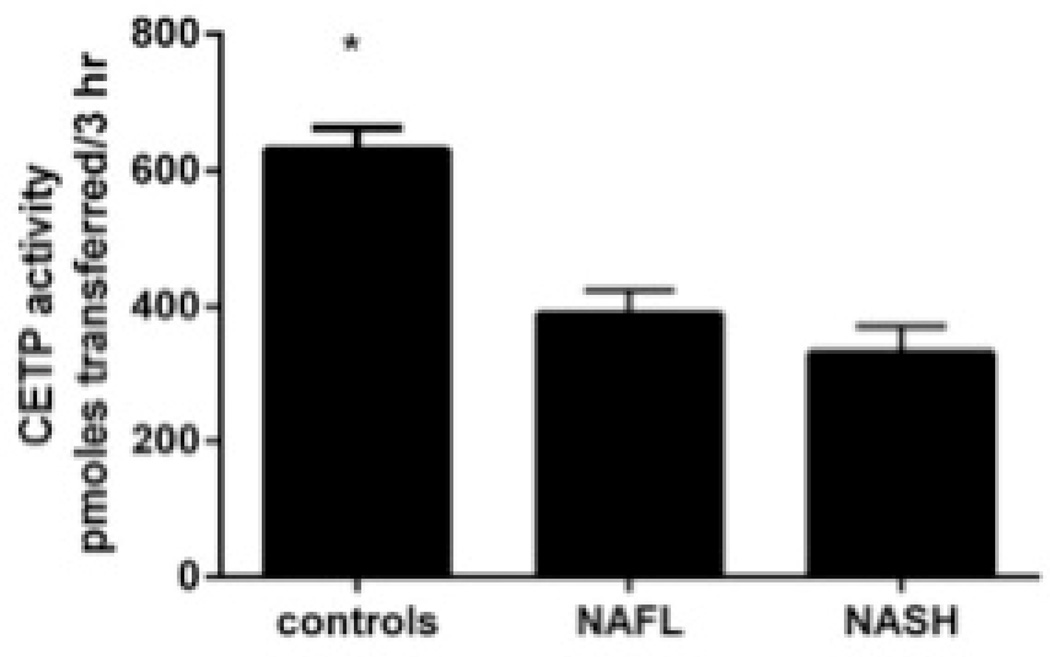
Compared to lean controls, both subjects with NAFLD and NASH had decreased HDL-C and HDL-2 (Table 2). The distribution of HDL particles was left shifted in subjects with NAFLD compared to controls (Fig. 3A). Pre β-HDL was decreased significantly in subjects with NAFLD compared to controls (Fig. 3B). The activity of lecithin cholesterol acyl transferase (LCAT) was relatively unchanged in those with NAFLD or NASH while a significant decrease in cholesterol ester transfer protein activity was present (Fig. 3C).
Figure 3. High-density lipoproteins in NAFLD.
A. HDL particle size and concentration is decreased in NAFLD
B. Serum concentrations of pre β-HDL is decreased in NAFLD (P<.01 controls).
C. Cholesterol ester transfer protein was significantly lower in NAFLD/NASH (P<.01 vs controls). All data is presented as means ± S.E.M.
DISCUSSION
Cardiovascular disease is the leading cause of death both in the general population and subjects with NAFLD3. The current study demonstrates that, even in the absence of diabetes, NAFLD is associated with changes in cardiovascular risk profile and that the histological features of NAFLD are significantly related to such changes.
The key findings of the study are that NAFLD is associated with increased VLDL-P and ApoB, sdLDL-P and sdLDL-C. NAFLD is also associated with an increased ApoB:ApoA ratio. The triglyceride levels, VLDL-P and VLDL-size as well as ApoB were directly related to the degree of fasting insulin levels which is consistent with the known effects of insulin on triglyceride synthesis. This is corroborated by the finding of increased SREBP-1c activation in subjects with NAFLD and NASH and direct evidence of increased triglyceride synthesis in ex vivo studies.
Increased VLDL-P and VLDL-size prevent lipoprotein lipase-mediated clearance of VLDL triglyceride thereby producing triglyceride rich lipoprotein remnants22. Hepatic lipases hydrolyze these remnant particles producing small dense lipoprotein particles. It is likely that VLDL had a similar fate in subjects with NAFLD given the increase in VLDL-P as well as ApoB compared to lean controls. The observed increased hepatic cholesterol synthetic activity is likely to further contribute to the cholesterol content of LDL and its subparticles in those with NAFLD and NASH. This is in line with our previous demonstration of a direct relationship between hepatic HMG CoA reductase expression and LDL-C23. The atherogenecity of the increase in sdLDL is likely to be further compounded by the previously noted decrease in LDL receptor expression in NASH.
It has long been known that advanced cirrhosis is associated with a decrease in total cholesterol. Here we find that with progression of NASH to cirrhosis, even with otherwise preserved synthetic function (normal bilirubin and albumin), the lipoprotein abnormalities seen with NASH tend to resolve. Specifically, circulating triglycerides, VLDL-P and VLDL-size and both LDL-P and sdLDL-P improved. This occurred despite unchanged hyperinsulinemia. This could reflect shunting of insulin-rich portal blood away from the liver due to portal hypertension or resistance to hyperinsulinemia-driven hepatic lipogenesis in cirrhosis. The observation that ex vivo studies showed decreased lipogenesis in cirrhotic livers compared to NASH despite holding insulin levels constant support the latter possibility. Of note, in precirrhotic NASH, despite hepatic insulin resistance, there is preserved sensitivity to the lipogenic actions of insulin which coupled with hyperinsulinemia drive increased de novo lipogenesis24. Thus, the observed decrease in triglyceride synthesis in cirrhosis may reflect an early manifestation of hepatic synthetic failure.
It is interesting to note that there were no major differences in lipoprotein abnormalities in those with NAFLD versus NASH. This is most likely a reflection of patient selection in this study where subjects with T2DM and impaired glucose tolerance were excluded to avoid their confounding effects on lipoproteins25. In previous studies demonstrating increased cardiovascular outcomes in subjects with NASH (versus NAFLD) included subjects with T2DM which is over-represented in NASH3,4. An alternative explanation for lack of significant differences in lipoproteins in NAFLD and NASH could be because the sample size of these two cohorts was not large enough to detect statistically significant differences. Additional studies with larger samples size are needed to investigate this further.
From a practical clinical point of view, the current study further confirms that development of NAFLD is associated with worsening of the cardiovascular risk factor profile. This is not obvious by looking at traditional parameters of cardiovascular risk and is only unraveled by additional expanded risk profiling.
A limitation of the current study is lack of liver histology or imaging modalities (i.e. ultrasonography or MR spectroscopy) in excluding hepatic steatosis in the control groups. Therefore, in order to minimize the bias from lack of information, only patients who had normal aminotransferases, fasting glucose <100mg/dL and a normal liver fat score were included to minimize unintentional inclusion of subclinical impaired glucose tolerance (IGT) or NAFLD. Despite excluding those with diabetes or IGT, insulin resistance was not directly measured and therefore we cannot determine the impact of varying degrees of insulin resistance on lipoproteins in NAFLD. Similarly, due to lack of data on body fat distribution, we are unable to evaluate the impact of visceral fat accumulation on lipoproteins. Additionally, majority of patients in the study are Caucasian males therefore, these results should be extrapolated to other ethnicities and the female gender with caution. Finally, since this is a cross-sectional study, well-designed prospective studies are needed to truly evaluate the link between serum atherogenic risk factors, NAFLD and cardiovascular events.
Supplementary Material
Key Points.
NAFLD and NASH is associated with increase in pro-atherogenic lipoprotein subclasses
Increased lipid synthesis drives dyslipidemia in pre-cirrhotic NAFLD
Improvement in dyslipidemia in cirrhosis is due lipid synthetic failure
HDL maturation is impaired in NAFLD
Acknowledgments
Grant Support: RO1 DK 081410 to Dr. Sanyal
Footnotes
Publisher's Disclaimer: This is a PDF file of an unedited manuscript that has been accepted for publication. As a service to our customers we are providing this early version of the manuscript. The manuscript will undergo copyediting, typesetting, and review of the resulting proof before it is published in its final citable form. Please note that during the production process errors may be discovered which could affect the content, and all legal disclaimers that apply to the journal pertain.
AUTHOR CONTRIBUTIONS:
Project Conceptualization: M. Shadab Siddiqui, Richard K. Sterling, Velimir A Luketic, Puneet Puri, Richard T. Stravitz, Sherry Boyett, Michael Fuchs, Carol Sargeant, Scott Matherly and Arun Sanyal
Histological Assessment Michael Idowu and Melissa Contos
Data Analysis: M. Shadab Siddiqui and Arun Sanyal
Manuscript Preparation: M. Shadab Siddiqui and Arun Sanyal
Manuscript Review: Richard K. Sterling, Velimir Luketic, Puneet Puri, Richard T. Stravitz, Sherry Boyett, Michael Fuchs, Carol Sargeant, Scott Matherly
Conflict of Interest: None of the authors have any conflict of interest to report except: Puneet Puri (Board Membership Health Diagnostic Laboratories)
References
- 1.Vernon G, Baranova A, Younossi ZM. Systematic review: the epidemiology and natural history of non-alcoholic fatty liver disease and non-alcholic steatohepatitis in adults. Hepatology. 2011;34:274–285. doi: 10.1111/j.1365-2036.2011.04724.x. [DOI] [PubMed] [Google Scholar]
- 2.Chalasani N, Younossi Z, Lavine JE, et al. The diagnosis and management of non-alcoholic fatty liver disease: Practice guideline by the american association for the study of liver diseases, American College of Gastroenterology, and the American Gastroenterological Association. Hepatology. 2012;55:n/a–n/a. doi: 10.1002/hep.25762. [DOI] [PubMed] [Google Scholar]
- 3.Adams LA, Lymp JF, St Sauver J, et al. The natural history of nonalcoholic fatty liver disease: a population-based cohort study. Gastroenterology. 2005;129:113–121. doi: 10.1053/j.gastro.2005.04.014. [DOI] [PubMed] [Google Scholar]
- 4.Targher G, Day CP, Bonora E. Risk of cardiovascular disease in patients with nonalcoholic fatty liver disease. N Engl J Med. 2010;363:1341–1350. doi: 10.1056/NEJMra0912063. [DOI] [PubMed] [Google Scholar]
- 5.Herder C, Karakas M, Koenig W. Biomarkers for the Prediction of Type 2 Diabetes and Cardiovascular Disease. Clinical Pharmacology & Therapeutics. 2011;90:52–66. doi: 10.1038/clpt.2011.93. [DOI] [PubMed] [Google Scholar]
- 6.Cromwell WC, Otvos JD, Keyes MJ, et al. LDL particle number and risk of future cardiovascular disease in the Framingham Offspring Study—Implications for LDL management. Journal of Clinical Lipidology. 2007;1:583–592. doi: 10.1016/j.jacl.2007.10.001. [DOI] [PMC free article] [PubMed] [Google Scholar]
- 7.Williams PT, Feldman DE. Prospective study of coronary heart disease vs. HDL2, HDL3, and other lipoproteins in Gofman's Livermore Cohort. Atherosclerosis. 2010 doi: 10.1016/j.atherosclerosis.2010.10.024. [DOI] [PMC free article] [PubMed] [Google Scholar]
- 8.Lorenzo C, Hanley AJ, Rewers MJ, Haffner SM. The association of alanine aminotransferase within the normal and mildly elevated range with lipoproteins and apolipoproteins: the Insulin Resistance Atherosclerosis Study. Diabetologia. 2013 doi: 10.1007/s00125-012-2826-4. [DOI] [PMC free article] [PubMed] [Google Scholar]
- 9.DeFilippis AP, Blaha MJ, Martin SS, et al. Nonalcoholic fatty liver disease and serum lipoproteins: the Multi-Ethnic Study of Atherosclerosis. Atherosclerosis. 2013;227:429–436. doi: 10.1016/j.atherosclerosis.2013.01.022. [DOI] [PMC free article] [PubMed] [Google Scholar]
- 10.Kotronen A, Seppanen-Laakso T, Westerbacka J, et al. Comparison of lipid and fatty acid composition of the liver, subcutaneous and intra-abdominal adipose tissue, and serum. Obesity (Silver Spring) 2010;18:937–944. doi: 10.1038/oby.2009.326. [DOI] [PubMed] [Google Scholar]
- 11.Kantartzis K, Rittig K, Cegan A, et al. Fatty liver is independently associated with alterations in circulating HDL2 and HDL3 subfractions. Diabetes Care. 2008;31:366–368. doi: 10.2337/dc07-1558. [DOI] [PubMed] [Google Scholar]
- 12.Adiels M, Taskinen MR, Packard C, et al. Overproduction of large VLDL particles is driven by increased liver fat content in man. Diabetologia. 2006;49:755–765. doi: 10.1007/s00125-005-0125-z. [DOI] [PubMed] [Google Scholar]
- 13.Matikainen N, Manttari S, Westerbacka J, et al. Postprandial lipemia associates with liver fat content. J Clin Endocrinol Metab. 2007;92:3052–3059. doi: 10.1210/jc.2007-0187. [DOI] [PubMed] [Google Scholar]
- 14.Fabbrini E, Magkos F, Mohammed BS, et al. Intrahepatic fat, not visceral fat, is linked with metabolic complications of obesity. Proc Natl Acad Sci U S A. 2009;106:15430–15435. doi: 10.1073/pnas.0904944106. [DOI] [PMC free article] [PubMed] [Google Scholar]
- 15.Cali AM, Zern TL, Taksali SE, et al. Intrahepatic fat accumulation and alterations in lipoprotein composition in obese adolescents: a perfect proatherogenic state. Diabetes Care. 2007;30:3093–3098. doi: 10.2337/dc07-1088. [DOI] [PubMed] [Google Scholar]
- 16.Kleiner DE, Brunt EM, Van Natta M, et al. Design and validation of a histological scoring system for nonalcoholic fatty liver disease. Hepatology. 2005;41:1313–1321. doi: 10.1002/hep.20701. [DOI] [PubMed] [Google Scholar]
- 17.Younossi ZM, Stepanova M, Rafiq N, et al. Pathologic criteria for nonalcoholic steatohepatitis: Interprotocol agreement and ability to predict liver-related mortality. Hepatology. 2011;53:1874–1882. doi: 10.1002/hep.24268. [DOI] [PubMed] [Google Scholar]
- 18.Kotronen A, Peltonen M, Hakkarainen A, et al. Prediction of non-alcoholic fatty liver disease and liver fat using metabolic and genetic factors. Gastroenterology. 2009;137:865–872. doi: 10.1053/j.gastro.2009.06.005. [DOI] [PubMed] [Google Scholar]
- 19.Folch J, Lees M, Sloane Stanley GH. A simple method for the isolation and purification of total lipides from animal tissues. J Biol Chem. 1957;226:497–509. [PubMed] [Google Scholar]
- 20.Gibbons GF, Wiggins D, Brown AM, Hebbachi AM. Synthesis and function of hepatic very-low-density lipoprotein. Biochem Soc Trans. 2004;32:59–64. doi: 10.1042/bst0320059. [DOI] [PubMed] [Google Scholar]
- 21.Simonen P, Kotronen A, Hallikainen M, et al. Cholesterol synthesis is increased and absorption decreased in non-alcoholic fatty liver disease independent of obesity. J Hepatol. 2010 doi: 10.1016/j.jhep.2010.05.037. [DOI] [PubMed] [Google Scholar]
- 22.Packard CJ. Triacylglycerol-rich lipoproteins and the generation of small, dense low-density lipoprotein. Biochem Soc Trans. 2003;31:1066–1069. doi: 10.1042/bst0311066. [DOI] [PubMed] [Google Scholar]
- 23.Min H, Kapoor A, Fuchs M, et al. Increased Hepatic Synthesis and Dysregulation of Cholesterol Metabolism Is Associated with the Severity of Nonalcoholic Fatty Liver Disease. Cell Metabolism. 2012;15:665–674. doi: 10.1016/j.cmet.2012.04.004. [DOI] [PMC free article] [PubMed] [Google Scholar]
- 24.Tessari P, Coracina A, Cosma A, Tiengo A. Hepatic lipid metabolism and non-alcoholic fatty liver disease. Nutr Metab Cardiovasc Dis. 2009;19:291–302. doi: 10.1016/j.numecd.2008.12.015. [DOI] [PubMed] [Google Scholar]
- 25.Schwarz JM, Linfoot P, Dare D, Aghajanian K. Hepatic de novo lipogenesis in normoinsulinemic and hyperinsulinemic subjects consuming high-fat, low-carbohydrate and lowfat, high-carbohydrate isoenergetic diets. Am J Clin Nutr. 2003;77:43–50. doi: 10.1093/ajcn/77.1.43. [DOI] [PubMed] [Google Scholar]
Associated Data
This section collects any data citations, data availability statements, or supplementary materials included in this article.


