

Abstract
The mammalian brain is composed of an outer layer of gray matter, consisting of cell bodies, dendrites, and unmyelinated axons, and an inner core of white matter, consisting primarily of myelinated axons. Recent evidence suggests that microstructural differences between gray and white matter play an important role during neurodevelopment. While brain tissue as a whole is rheologically well characterized, the individual features of gray and white matter remain poorly understood. Here we quantify the mechanical properties of gray and white matter using a robust, reliable, and repeatable method, flat-punch indentation. To systematically characterize gray and white matter moduli for varying indenter diameters, loading rates, holding times, post-mortem times, and locations we performed a series of n=192 indentation tests. We found that indenting thick, intact coronal slices eliminates the common challenges associated with small specimens: it naturally minimizes boundary effects, dehydration, swelling, and structural degradation. When kept intact and hydrated, brain slices maintained their mechanical characteristics with standard deviations as low as 5% throughout the entire testing period of five days post mortem. White matter, with an average modulus of 1.895kPa±0.592kPa, was on average 39% stiffer than gray matter, p<0.01, with an average modulus of 1.389kPa±0.289kPa, and displayed larger regional variations. It was also more viscous than gray matter and responded less rapidly to mechanical loading. Understanding the rheological differences between gray and white matter may have direct implications on diagnosing and understanding the mechanical environment in neurodevelopment and neurological disorders.
Keywords: Brain, gray matter, white matter, indentation, viscoelasticity
1. Motivation
Our brain is not only our softest, but also our least well-understood organ. Floating in the cerebrospinal fluid, embedded in the skull, it is almost perfectly isolated from its mechanical environment [35]. It is thus not surprising that most brain research focuses on the electrical rather than the mechanical characteristics of brain tissue [7]. Recent studies suggest, though, that the mechanical environment plays an important role during neurodevelopment [1]. Mechanical factors are closely associated with developmental disorders including lissencephaly and polymicrogyria [41], reduced or increased brain folding [6], brachycephaly and plagiocephaly, flat or asymmetric heads [26], and hydrocephalus, abnormal accumulation of cerebrospinal fluid [14].
Neuromechanics has traditionally displayed strong interest in the fast loading regime associated with dynamic phenomena on the order of seconds or milliseconds [11]. The prototype example is traumatic brain injury [36], where extreme loading rates cause intracranial damage associated with a temporary or permanent loss of function [27]. On these scales, time dependency plays a critical role [40]. Mathematical models for these phenomena naturally involve at least two time scales, one for the viscoelastic tissue and one for its poroelastic interaction with the cerebrospinal fluid [8].
Neurodevelopment, on the contrary, falls into the slow loading regime associated with quasi-static phenomena on the order of weeks or months [48]. A typical example that has recently received growing attention is cortical folding [43], where compressive forces between the gray matter layer and the white matter substrate cause structural instabilities and induce surface buckling [5]. Mathematical models for these phenomena naturally involve at least two distict materials, the gray matter layer with cell bodies, dendrites, and unmyelinated axons, and the white matter core with bundles of myelinated axons [1].
To understand the mechanisms that drive neurodevelopment and trigger morphological abnormalities, it is critical to understand the rheological differences between gray and white matter tissue [42]. Gyral wavelengths - and with them clinical markers such as gyrification indices - are directly correlated to the stiffness contrast between gray and white matter [20]. Controversies about the stiffness contrast have caused ongoing debate between the neuromechanics and neurobiology communities [46]. While five decades of research have generated a profound understanding of brain tissue as a whole [7], the individual rheology of gray and white matter remains understudied and poorly understood. As a result of inconsistent sample preparation, post-mortem time, and testing conditions, reported stiffness values are often irreproducible and may vary by an order of magnitude or more [35]: Some studies reported that gray matter was substantially stiffer than white matter [9], others found that they were of equal stiffness [12], and yet others observed that white matter was stiffer [45]. Here, to address this discrepancy, we adopt a robust, reliable, and repeatable method to quantify the mechanical properties of gray and white matter, flat-punch indentation. To systematically probe the sensitivity to indenter diameter, loading rate, holding time, post-mortem time, and location we perform a series of n=192 indentation tests. We demonstrate that indention consistently produces robust measurements that indicate that white matter tissue is approximately one third stiffer than gray matter tissue.
2. Methods
2.1. Sample preparation
We collected fresh bovine brain of 16 months old cows from a local slaughterhouse (Martin’s Custom Butchering, Wakarusa, IN). Within two hours post mortem, we prepared 5mm-thick coronal slices for gray and white matter indentation. To slow down tissue degradation and prevent tissue dehydration, we hydrated the sample surfaces with phosphate-buffered saline solution and kept the slices refrigerated until testing. To exclude effects of neurofilament protein alteration and ensure tissue integrity, we performed all standard tests within six hours post mortem [13]. In addition, we tested one specimen repeatedly within five days post mortem to longitudinally characterize the effect of post-mortem time on gray and white matter mechanical properties. Figure 1 illustrates the freshly harvested bovine brain, left, and a 5mm-thick coronal slice prepared for indentation testing, right.
Figure 1.
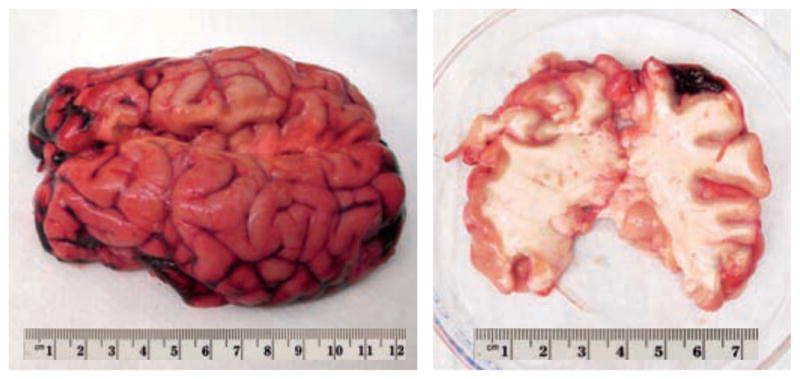
Freshly harvested bovine brain, left, and 5mm-thick coronal slice in petri dish prepared for indentation testing, right.
2.2. Experimental setup
We placed the fresh coronal slices in 100mm-diameter petri dishes and stabilized the samples using a 12mm-diameter stainless steel washer. To prevent specimen dehydration and minimize adhesion, we hydrated the surface inside the washer with phosphate-buffered saline solution before mounting the specimen into a Hysitron TI 950 TriboIndenter™ (Hysitron Inc., Eden Prairie, MN). Equipped with a three plate capacitive transducer, the TriboIndenter™ applies forces electrostatically at a resolution of <1nN and simultaneously measures displacements as a change in capacitance at a resolution of <0.02nm. We upgraded the standard TriboIndenter™ with an xZ 500 Extended Displacement Stage for soft matter testing to increase the common range of indentation depths to 500um. To ensure a homogeneous specimen response, we used circular flat punch indenters with diameters ranging from 0.75mm to 1.50mm. We fabricated the indenter tips from surface ground and polished tool steel, epoxied in a phenolic resin counter-bored pin [32]. Figure 2 illustrates the experimental setup with the coronal slice mounted underneath the force transducer of the TriboIndenter™.
Figure 2.
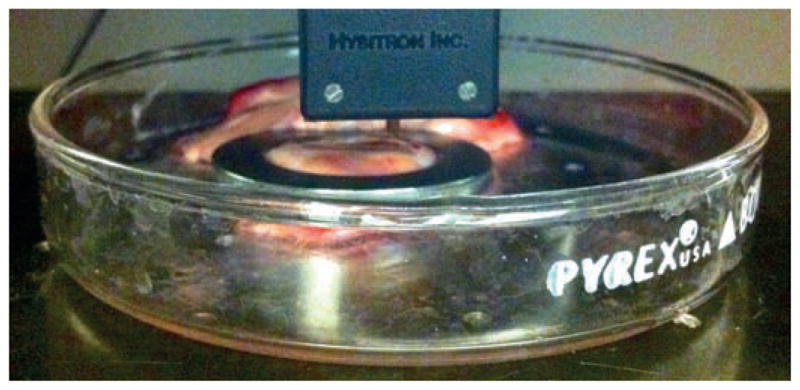
Experimental setup. A 5mm-thick coronal slice of freshly harvested brain tissue is placed in a 100mm-diameter petri dish and mounted underneath the force transducer of the TriboIndenter™. A 12mm-diameter washer marks the indentation region and stabilizes the sample. A circular flat punch of 1.5mm diameter ensures a homogenized specimen response.
2.3. Indentation procedure
We performed all indentation tests at room temperature, with closed loop feedback at 78kHz, under displacement control, using trapezoidal loading-holding-unloading profiles. We established two different loading protocols, single-long-range indentation and multiple-short-range indentation, and performed a series of n=40 long-range and n=152 short-range indentation tests. Figure 3 illustrates the characteristic force-depth behavior of brain tissue during single-long-range indentation, black line, and multiple-short-range indentation, colored lines.
Figure 3.

Characteristic force-depth behavior during brain tissue indentation under displacement control. The single-long-range indentation protocol consists of a single 400um-deep indent, black line. The multiple-short-range indentation protocol consists of four consecutive 10um-deep indents applied at 300um depth with increments of 10um, colored lines. The loading and unloading rates are 5um/s and the holding time is 10s.
The single-long-range indentation protocol consists of a single indent with an indentation depth of 400um, i.e., 8% of the specimen height, which lies within the recommended range of 10% to minimize boundary effects [18]. Brain slices were not explicitly fixed to the petri dish, but stabilized with a washer; no significant sliding was observed between the slice and the dish. Loading and unloading rates are 5um/s and the holding time is 10s. Since this first protocol requires special equipment for long-range indentation and is relatively time consuming, we established an additional second test protocol for multiple-short-range indentation.
The multiple-short-range indentation protocol consists of four consecutive indents with an indentation depth of 10um, i.e., 0.2% of the specimen height, applied at 300um depth with increments of 10um. Loading and unloading rates are 5um/s and the holding time is 10s. The recovery time between two consecutive indents is 120s, which is more than twice the recommended recovery time of 50s [45].
We used the first protocol to gain a better understanding of the mechanical properties of gray and white matter in general. To demonstrate our motivation for using a circular flat punch, we performed ten long-range indents in white matter tissue with varying punch diameters of 0.75mm, 1.00mm, 1.25mm, and 1.50mm. After this initial study, we performed all following indentations with the 1.50mm-diameter punch. To illustrate the influence of the loading rate, we performed eight long-range indents in gray and white matter tissue with loading rates of 1um/s, 2.5um/s, 5um/s, 10um/s, 20um/s, 40um/s, 80um/s, and 160um/s. To illustrate the influence of the holding time, we performed eight long-range indents in white matter tissue with holding times of 1s, 2.5s, 5s, 10s, 20s, 40s, 80s, and 160s. We supplemented this series of relaxation tests by six long-term holding experiments with an expedited loading and unloading rate of 100um/s and an extended holding time of 600s, performed at three different locations in gray and white matter. Overall, this resulted in a series of n=40 long-range indentations, n=10 to characterize the sensitivity with respect to the punch diameter, n=16 to characterize the sensitivity with respect to the loading rate, and n=14 to characterize the sensitivity with respect to the holding time.
We used the second protocol to quantify the mechanical properties of bovine gray and white matter tissue. The second protocol is less invasive than the first, and also markedly faster, which allowed us to perform a series of systematic tests to characterize temporal and regional variations of gray and white matter moduli. To characterize temporal variations, we performed multiple-short-range indentation at the same spatial position in gray and white matter at ten different time points: 2hrs, 3 hrs, 4 hrs, 6 hrs, 8hrs, 10hrs, 12hrs, 1d, 2d, and 5d post mortem. To characterize regional variations, we performed multiple-short-range indentation immediately after slice preparation at 18 different spatial positions: at three different locations of three different coronal slices in both gray and white matter. Overall, this resulted in a series of n=152 short-range indentations, n=80 to characterize temporal variations and n=72 to characterize regional variations.
2.4. Mechanical properties
We defined the contact stiffness k of each indent as the average slope of the upper segment of the loading curve. To minimize the influence of adhesion [22], we averaged the contact stiffness over the region between 50% and 100% of the maximum indentation force. The effective elastic modulus Eeff then follows directly from the standard relation [37],
| (1) |
where A is the projected contact area underneath the indenter. For a circular flat punch, the contact area, A = 1/4 π d2, is independent of the indentation depth and simply a function of the punch diameter d. This implies that the reduced elastic modulus simplifies to the following expression,
| (2) |
In general, the effective elastic modulus accounts for the elastic deformations in both sample and indenter [37],
| (3) |
where Esmp and Eind are the Young’s moduli and νsmp and νind are the Poisson’s ratios of the sample and of the indenter. In our case, the stiffness of the indenter is orders of magnitude larger than the stiffness of the sample, Eind ≫ Esmp, and we can simplify this relation as follows,
| (4) |
Since our test setup does not allow us to directly quantify the compressive features of brain tissue, we adopt the common assumption of incompressibility, νsmp = 0.5, and simplify the sample modulus to following expression [11],
| (5) |
This implies that the gray and white matter moduli are directly proportional to the contact stiffness k and inversely proportional to the punch diameter d. To test this hypothesis, we measured the contact stiffness k at a constant, fixed location using circular flat punches of varying diameters d to ensure that our method reliably records constant sample moduli Esmp.
3. Results
3.1. General indentation characteristics
Figure 3 displays the general indentation characteristics of brain tissue under single-long-range and multiple-short-range indentation. For the single-long-range indentation, we chose the starting position of the indenter tip 100um above the sample surface to guarantee that the initial setup is contact-free. We then gradually increased the indentation depth. At first, we recorded a small negative force resulting from adhesive forces between the indenter tip and the hydrated sample surface. With increasing indentation depth, the tip gradually came in contact with the sample and the recorded force began to increase. Eventually, the resistance of the sample balanced the adhesive forces and the total force vanished. Then the force increased gradually until the tip surface was in full contact with the sample. From this point onward, the force recording was stable; the force-depth relation was initially slightly strain stiffening, but then almost linear. At a maximum indentation depth of 400um, we held the indentation depth constant, and the force decreased upon relaxation. We then gradually decreased the indentation depth and the force decreased accordingly. Towards the end of the unloading regime, the recorded force temporarily dropped below zero indicating adhesive effects, until it finally recovered its initial value. Since single-long-range indentation required extended recovery times, we used it primarily to calibrate the method and then switched to multiple-short-range indentation to perform repeated tests for gray and white matter characterization. To ensure a linear response during short-range indentation, we performed four consecutive indents with an indentation depth of 10um at depth increments of 10um. The colored curves in Figure 3 confirm that the behavior during these four indents was indeed linear and lay well within the linear regime of the black single long-range indentation curve.
3.2. Indenting with a circular flat punch
Figure 4 illustrates the tissue response when varying the diameter of the indenter. To ensure that our method reliably records constant sample moduli, we performed a series of ten single-long-range indents in white matter tissue with varying punch diameters of 0.75mm, 1.00mm, 1.25mm, and 1.50mm.
Figure 4.

Variation of punch diameter. Sensitivity of indentation force vs. indentation depth for circular flat punches with different diameter reveals a linear relation between contact stiffness and punch diameter. The slope of the force-depth curve increases with increasing punch diameter, left. The contact stiffness increases linearly with increasing punch diameter and the sample modulus is constant.
Figure 4, left, shows that the contact stiffness, the slope of the force-depth curve, increased with increasing punch diameter, from 1.732±0.129N/m at a diameter of 0.75mm via 2.233±0.048N/m at a diameter of 1.00mm and 2.359±0.167N/m at a diameter of 1.25mm to 3.106±0.038N/m at a diameter of 1.50mm. Figure 4, right, illustrates the linear relation between contact stiffness and punch diameter with a slope of 2.138±0.191N/m d. This confirms our initial hypothesis that the specimen modulus is directly proportional to the contact stiffness and inversely proportional to the punch diameter, here with a factor of 1.604±0.143kPa. From now on, we performed all remaining indentations with the 1.50mm-diameter punch illustrated in Figure 4.
3.3. Mechanical properties of gray and white matter
Figures 5 and 6 illustrate the loading rate sensitivity of gray and white matter. To explore the rate-dependent nature of brain tissue, we performed a series of 16 single-long-range indents, eight in gray and eight in white matter, at eight different loading rates of 1um/s, 2.5um/s, 5um/s, 10um/s, 20um/s, 40um/s, 80um/s, and 160um/s.
Figure 5.

Loading rate sensitivity of gray and white matter. Sensitivity of indentation force vs. indentation depth for varying loading rates reveals the rate dependent nature of brain tissue. Indentation force and modulus increase with increasing loading rate.
Figure 6.

Loading rate sensitivity of gray and white matter. Sensitivity of indentation force vs. indentation depth for varying loading rates reveals the rate dependent nature of brain tissue. Indentation force and modulus increase with increasing loading rate.
Figure 5 shows that for a displacement-controlled trapezoidal loading-holding-unloading profile, the indentation force increased gradually towards its maximum value, then decayed quickly during holding, and finally decreased towards zero. The maximum indentation force increased markedly with increasing loading rate. Within our analyzed velocity range from 1um/s to 160um/s, the maximum force in gray matter increased from 318uN to 559uN and the maximum force in white matter increased from 605uN to 1,242uN. Both gray and white matter approximately doubled their maximum forces when increasing the loading rate by two orders of magnitude.
Figure 6, illustrates the gray and white matter force-depth behavior and the corresponding moduli throughout the entire loading rate spectrum. Maximum forces and moduli increased with increasing loading rate. Within our analyzed loading rate regime from 1um/s to 160um/s, the gray matter modulus increased from 0.689kPa to 1.440kPa and the white matter modulus increased from 1.259kPa to 2.510kPa. Both gray and white matter doubled their moduli when increasing the loading rate by two orders of magnitude. From now on, we performed all remaining indentations at loading and unloading rates of 5um/s to reduce loading rate sensitivity and tissue preservation time.
Figures 7 and 8 illustrate the holding time sensitivity of gray and white matter. To explore the rate-dependent nature of brain tissue, we performed eight single-long-range indents in white matter tissue with holding times of 1s, 2.5s, 5s, 10s, 20s, 40s, 80s, and 160s and an additional six relaxation tests with extended holding times of 600s in gray and white matter, at three different locations each.
Figure 7.

Holding time sensitivity of white matter. Sensitivity of relaxation force vs. indentation depth for varying holding times reveals the rate dependent nature of brain tissue. The relaxation force increases for increasing holding times. The total stress decreases for increasing holding times and converges asymptotically towards its plateau value.
Figure 8.

Stress relaxation of gray and white matter. Individual relaxation tests reveal the rate dependent nature of brain tissue. The plateau stress is associated with the storage modulus and characterizes the elastic response; the difference between peak stress and plateau stress is associated with the loss modulus and characterizes the viscoelastic response. Black curves indicate the mean; gray zones indicate the standard deviation.
Figure 7 illustrates the increase in relaxation force for increasing holding times and summarizes the individual relaxation tests in a single characteristic relaxation curve. The curve shows that the total stress decreased rapidly with increasing holding time and then converges gradually towards its static equilibrium value. Within our analyzed holding range from 1s to 160s, the normalized stress decreased from 0.983 to 0.712, i.e., it reduced its initial value by more than one fourth.
Figure 8 illustrates the characteristic stress relaxation behavior of gray and white matter. To quantify the viscoelastic response, we adopted a multi-term Prony series, , with n characteristic time constants τi. The plateau stress σ∞ at t → ∞ is associated with the storage modulus and mimics the elastic response; the difference between peak stress and plateau stress [σi − σ∞] is associated with the loss modulus and mimics the viscoelastic response. We found the best approximation for a two-term Prony series.
Table 1 summarizes the two time constants τ1 and τ2 for gray and white matter. The short and long time scales of both gray and white matter differed by almost two orders of magnitude: White matter, with a fast time constant of τ1 = 4.40 ± 0.22 s, responded equally fast to loading as gray matter, with a fast time constant of τ1 = 4.24 ± 0.59 s. White matter, with a slow time constant of τ2 = 160.74±18.37 s, displayed slightly longer relaxation times than gray matter, with a slow time constant of τ2 = 105.74 ± 50.97 s. This slower response of white matter is clearly visible in the relaxation curves of Figure 8, in which the gray matter stress plateaued within the 600s time interval, while the white matter stress still decayed beyond 600s. From now on, we performed all remaining indentations with holding times of 10s to reduce both experimental time and preservation time.
Table 1.
Stress relaxation of gray and white matter. Least squares fit reveal the best approximation for a two-term Prony series suggesting that brain tissue possesses two characteristic time scales τ1 and τ2.
| gray matter [s] | ||||
|---|---|---|---|---|
| indent | I1 | I2 | I3 | mean ± std |
| τ1 | 4.08 | 4.90 | 3.75 | 4.24 ± 0.59 |
| τ2 | 71.24 | 164.29 | 81.70 | 105.74 ± 50.97 |
| white matter [s] | ||||
| indent | I1 | I2 | I3 | mean ± std |
| τ1 | 4.63 | 4.38 | 4.20 | 4.40 ± 0.22 |
| τ2 | 139.81 | 174.22 | 168.18 | 160.74 ± 18.37 |
3.4. Temporal variation of gray and white matter properties
Figures 9 and 10 and Table 2 summarize the temporal evolution of the gray and white matter moduli for different indentation times post mortem. To characterize the impact of tissue preservation on the mechanical response, we performed multiple-short-range indentations at the identical spatial position in gray and white matter at ten different time points, 2hrs, 3hrs, 4hrs, 6hrs, 8hrs, 10hrs, 12hrs, 1d, 2d, and 5d post mortem.
Figure 9.

Temporal variation of gray and white matter indentation force on at four different depths at days d0, d1, d2, and d5 post mortem. The consistent shape of the indentation curves reveals that brain slices are virtually insensitive to the time of preservation. The indentation force in gray matter, left, is consistently lower than white matter, right.
Figure 10.

Temporal variation of gray and white matter moduli. The consistent moduli within five days post mortem reveal that brain slices are virtually insensitive to the time of preservation. The stiffness increases moderately with indentation depth, from black dots to white dots. Gray matter, left, is consistently softer than white matter, right. Black horizontal lines indicate the mean; gray zones indicate the standard deviation.
Table 2.
Temporal variation of gray and white matter moduli. Measurements at ten time points, rows, for four consecutive indentations, columns, with indentation depths of 10um at increments of 10um, tested within five days post mortem.
| gray matter moduli [kPa] | white matter moduli [kPa] | ||||||||||
|---|---|---|---|---|---|---|---|---|---|---|---|
| indent | I1 | I2 | I3 | I4 | mean ± std | indent | I1 | I2 | I3 | I4 | mean ± std |
| 2 hrs | 1.037 | 1.054 | 1.072 | 1.087 | 1.063 ± 0.021 | 2 hrs | 1.875 | 1.951 | 1.999 | 2.036 | 1.966 ± 0.070 |
| 3 hrs | 1.301 | 1.329 | 1.342 | 1.372 | 1.336 ± 0.030 | 3 hrs | 1.598 | 1.683 | 1.767 | 1.843 | 1.723 ± 0.106 |
| 4 hrs | 1.377 | 1.400 | 1.431 | 1.450 | 1.414 ± 0.032 | 4 hrs | 1.587 | 1.671 | 1.743 | 1.839 | 1.710 ± 0.107 |
| 6 hrs | 1.228 | 1.366 | 1.393 | 1.410 | 1.349 ± 0.083 | 6 hrs | 1.723 | 1.809 | 1.883 | 1.957 | 1.843 ± 0.100 |
| 8 hrs | 1.085 | 1.101 | 1.130 | 1.146 | 1.115 ± 0.028 | 8 hrs | 1.946 | 2.034 | 2.100 | 2.154 | 2.059 ± 0.090 |
| 10 hrs | 1.212 | 1.249 | 1.271 | 1.296 | 1.257 ± 0.036 | 10 hrs | 1.832 | 1.937 | 2.023 | 2.108 | 1.975 ± 0.118 |
| 12 hrs | 1.227 | 1.248 | 1.253 | 1.278 | 1.251 ± 0.021 | 12 hrs | 1.620 | 1.754 | 1.873 | 1.960 | 1.802 ± 0.147 |
| 1 day | 1.095 | 1.142 | 1.104 | 1.181 | 1.131 ± 0.039 | 1 day | 1.727 | 1.816 | 1.897 | 2.002 | 1.860 ± 0.117 |
| 2 days | 1.019 | 1.053 | 1.089 | 1.099 | 1.065 ± 0.037 | 2 days | 1.726 | 1.819 | 1.884 | 1.967 | 1.849 ± 0.102 |
| 5 days | 1.161 | 1.174 | 1.177 | 1.188 | 1.175 ± 0.011 | 5 days | 1.883 | 1.958 | 2.011 | 2.065 | 1.979 ± 0.078 |
| mean | 1.174 | 1.211 | 1.226 | 1.251 | 1.216 | mean | 1.752 | 1.843 | 1.918 | 1.993 | 1.877 |
| ± std | 0.116 | 0.127 | 0.131 | 0.130 | ± 0.124 | ± std | 0.128 | 0.123 | 0.114 | 0.103 | ± 0.145 |
Figure 9 illustrates the force-depth response of gray and white matter tissue on days d0, d1, d2, and d5 post mortem. The consistent shape of the indentation curves indicates that, when kept intact and hydrated, brain slices were virtually insensitive to the time of preservation. Within our analyzed time interval, the gray matter modulus varied between 1.063kPa on day 0, 1.131kPa on day 1, 1.065kPa on day 2, and 1.175kPa on day 5, and the white matter modulus varied between 1.966kPa on d0, 1.860kPa on day 1, 1.849 on day 2, and 1.979kPa on day 5. The indentation force in white matter, right, was consistently larger than in gray matter, left.
Figure 10 illustrates the temporal variation of the gray and white matter moduli within five days post mortem. The dashed vertical lines highlight the moduli at days d0, d1, d2 and d5 corresponding to the curves in Figure 9. Both gray and white matter moduli consistently increased with the number of indents and increasing indentation depths. Both gray and white matter moduli varied moderately during the first day of repeated mechanical testing, but displayed consistent moduli when tested after long periods of rest at d0, d1, d2, and d5. Throughout all ten time points, gray matter, left, was consistently softer than white matter, right. White matter, with an average modulus of 1.877±0.145kPa, was stiffer than gray matter, with an average modulus of 1.216±0.124kPa. Standard deviations in white and gray matter moduli were 8% and 10%. When restricting averaging to the rested tissue samples from d0, d1, d2, and d5 in Figure 9 alone, i.e., when excluding the measurements from 3hrs, 4hrs, 6hrs, 8hrs, 10hrs, 12hrs post mortem, for which the sample had possibly not fully recovered, the average white and gray matter moduli were 1.913±0.104kPa and 1.108±0.055kPa, with even lower standard deviations of 5% in both gray and white matter. Table 2 summarizes the gray and white matter moduli for all n=80 short-range indentations. From now on, we performed all remaining indentations within six hours post mortem to reduce tissue preservation time.
3.5. Regional variation of gray and white matter properties
Figure 11 and Table 3 summarize the regional variations of gray and white matter properties. To characterize regional variations, we performed multiple-short-range indentations at 18 different spatial positions within six hours post mortem, at three different locations of three different coronal slices in both gray and white matter.
Figure 11.

Regional variation of gray and white matter moduli. Measurements at three different slices and three different locations reveal that the specimen moduli vary markedly across the brain. Gray matter, left, is softer than white matter, right, and displays smaller regional variations. Black horizontal lines indicate the mean; gray zones indicate the standard deviation.
Table 3.
Regional variation of gray and white matter moduli. Measurements at nine different locations, rows, for four consecutive indentations, columns, with indentation depths of 10um at increments of 10um, tested within six hours post mortem.
| gray matter moduli [kPa] | white matter moduli [kPa] | ||||||||||
|---|---|---|---|---|---|---|---|---|---|---|---|
| indent | I1 | I2 | I3 | I4 | mean ± std | indent | I1 | I2 | I3 | I4 | mean ± std |
| #1 | 1.386 | 1.392 | 1.419 | 1.428 | 1.406 ± 0.020 | #1 | 1.295 | 1.329 | 1.347 | 1.381 | 1.338 ± 0.036 |
| #2 | 1.730 | 1.780 | 1.816 | 1.848 | 1.794 ± 0.051 | #2 | 1.594 | 1.617 | 1.647 | 1.676 | 1.633 ± 0.036 |
| #3 | 1.702 | 1.777 | 1.820 | 1.874 | 1.794 ± 0.072 | #3 | 2.896 | 2.996 | 3.068 | 3.141 | 3.025 ± 0.104 |
| #4 | 0.948 | 0.974 | 1.001 | 1.028 | 0.988 ± 0.035 | #4 | 2.071 | 2.145 | 2.148 | 2.197 | 2.140 ± 0.052 |
| #5 | 1.403 | 1.431 | 1.473 | 1.510 | 1.454 ± 0.047 | #5 | 2.390 | 2.429 | 2.474 | 2.504 | 2.449 ± 0.050 |
| #6 | 1.004 | 1.051 | 1.087 | 1.158 | 1.075 ± 0.065 | #6 | 1.331 | 1.369 | 1.405 | 1.445 | 1.387 ± 0.049 |
| #7 | 1.194 | 1.236 | 1.281 | 1.304 | 1.254 ± 0.049 | #7 | 1.018 | 1.035 | 1.055 | 1.093 | 1.050 ± 0.032 |
| #8 | 1.054 | 1.057 | 1.075 | 1.095 | 1.070 ± 0.019 | #8 | 1.883 | 1.914 | 1.946 | 1.970 | 1.928 ± 0.038 |
| #9 | 1.410 | 1.451 | 1.499 | 1.542 | 1.476 ± 0.058 | #9 | 1.987 | 2.058 | 2.142 | 2.234 | 2.105 ± 0.107 |
| mean | 1.314 | 1.350 | 1.386 | 1.421 | 1.368 | mean | 1.830 | 1.877 | 1.915 | 1.960 | 1.895 |
| ± std | 0.287 | 0.299 | 0.304 | 0.307 | ± 0.289 | ± std | 0.590 | 0.612 | 0.627 | 0.638 | ± 0.592 |
Figure 11 illustrates the regional variation of the specimen moduli at nine locations in gray and nine locations in white matter. Both gray and white matter moduli consistently increased with the number of indents and increasing indentation depths. White matter, with an average modulus of 1.895±0.592kPa, was on average 39% stiffer than gray matter, p<0.01, with an average modulus of 1.368±0.289kPa. White matter, with a standard deviation of 31%, displayed stronger regional variations than gray matter, with a standard deviation of 21%. Table 3 summarizes the gray and white matter moduli for all n=72 short-range indentations.
4. Discussion
4.1. General indentation characteristics
Despite intense efforts towards characterizing the mechanical properties of brain tissue, the rheological differences between gray and white matter remain poorly understood. Reported gray and white matter moduli differ by an order of magnitude and more, mainly because of inconsistencies in sample preparation, post-mortem time, and testing conditions [35]. The extremely soft nature and the small sample size make standard rheological testing challenging and only a few techniques are capable of truly distinguishing between gray and white matter properties [7]. Here we established an easy-to-use protocol to robustly, reliably, and reproducibly test gray and white matter brain tissue. To illustrate the features of this method, we performed a series of n=192 indentation tests of freshly harvested bovine brain, n=40 long-range indentations to establish our protocols and calibrate our method and n=152 short-range indentations to characterize temporal and regional variations. Indentation testing for various indenter diameters, loading rates, holding times, post-mortem times, and locations consistently produced robust results.
4.2. Indenting with a circular flat punch
A common challenge when indenting soft biological tissue is that, in contrast to stiff materials such as bone [47], adhesion can significantly alter the contact area beneath the indenter and induce errors in the mechanical characterization [29]. To address this issue, we used a circular flat punch [32] instead of the commonly used spherical indenter [19, 22, 45]. Using custom-designed indenter tips with four different diameters, we have shown that in flat-punch indentation, the contact area between indenter and sample remains constant over wide ranges of indentation depths [2]. This implies that the specimen modulus Esmp = 3/4 k/d is directly proportional to the contact stiffness k and inversely proportional to the punch diameter d, independent of the indentation depth [32]. Our linear force-depth response during multiple-short-range indentation in Figures 3 and 9 con-firms this hypothesis. Our gray and white matter moduli agree with those derived in 1.50mm-diameter circular flat punch indentation of porcine brain, which, however, required a complex finite-element based analysis to determine the specimen moduli Esmp from the measured contact stiffnesses k [28].
4.3. Elastic properties of gray and white matter
Our study suggests that white matter displays higher maximum indentation forces and steeper indentation curves than gray matter as illustrated in Figures 5 and 6. White matter, with a modulus of 1.895kPa, was on average 36% stiffer than gray matter, with a modulus of 1.389kPa. This stiffness difference is microstructurally plausible since white matter consists primarily of myelinated axons [24], which act as a network of biopolymer filaments [25], while gray matter is largely composed of cell bodies. Contrary to the common belief that biofilaments are non-load-bearing under compression, recent studies have shown that biofilaments contribute notably to the compressive load carrying capacity of soft tissues [4]. Only one indentation study found opposite results and reported that white matter, with a modulus of 0.294kPa, was softer than gray matter, with a modulus of 0.454kPa, using atomic force microscopy on ultra thin rodent brain slices [9]. Other studies of porcine brain agreed favorably with our measurements and reported an average stiffness difference of 39% between white matter, with 3.083kPa, and gray matter, with 2.223kPa [45]. These moduli are overall 60% stiffer than ours, but were also recorded at higher loading rates. Our measurements agree closely with the white and gray matter moduli of 1.787kPa and 1.195kPa for porcine brain, found by indenting 10mm-thick slices at a depth of 160um [28]. In contrast to our method, however, this study required complex finite-element analyses to evaluate the relationship between specimen modulus and contact stiffness.
4.4. Viscoelastic properties of gray and white matter
Variations in loading rate and holding time illustrated in Figures 5 to 8 reveal the extreme rate-sensitivity of brain tissue [16]. White matter was as loading-rate sensitive as gray matter. Both doubled their maximum indentation forces, and with them their moduli, when increasing the loading rate by two orders of magnitude as illustrated in Figures 5 and 6. This agrees well with split Hopkinson pressure bar compression tests, which reported increasing moduli with increasing loading rate in bovine brain samples [38]. Similar to our study, this study found that white matter was consistently stiffer than gray matter. However, since this study was motivated by understanding brain mechanics during traumatic brain injury, it focused on the fast-loading-rate regime. Here, since we are interested in understanding brain mechanics during brain development, we focused on the slow-loading-rate regime [17]. Our loading rates are comparable to the medium loading rates in early compression tests [34] and to the slow loading rates in recent indentation tests [45]. Our findings are in general agreement with the literature, where the specimen modulus increased with increasing loading rate [7, 34, 45].
White matter, with a stress relaxation of 70% and relaxation times larger than 600s, was more viscous and responded more slowly than gray matter, with a stress relaxation of 50% and relaxation times of 400s. This rheological difference is closely related to the microstructural architecture of gray and white matter tissue and reflects the network properties of white matter, similar to filled elastomers [14]. This is in agreement with recent studies, which have explained macroscopic viscoelasticity with the intracellular interaction between cytoplasm, nucleus, and membrane during cellular deformation [27]. Our long-time relaxation curves in Figure 8, right, with white matter plateau stresses of σ∞/σ0 < 0.30 and relaxation times larger than 600s, agree both qualitatively and quantitatively with the white matter relaxation curves reported in the literature, for which the stresses decayed to σ∞/σ0 < 0.30 and had still not fully converged after 500s [8]. Our larger but slower drop in white matter stress agrees with the recently reported larger but slower drop in white matter stiffness when compared to gray matter [45].
We found that a first-order viscoelastic model, σ(t) = σ∞ + [σ0 − σ∞] exp(−t/τ), underestimated early relaxation and over-estimated late relaxation. This suggests that a first-order viscoelastic model might be too simplistic to characterize the complex rate-dependent nature of brain tissue. Several authors have suggested to use a Prony series with additional terms, , to capture the different time scales of brain tissue [34]. While some authors suggest that a two-term model provides a sufficiently accurate fit [19, 39], others prefer a three-term model, either plain [10, 44], or in combination with the cerebrospinal fluid in a poroviscoelastic formulation [8].
We found that a second-order Prony series, σ(t) = σ∞ + [σ0 − σ∞] exp(−t/τ1) + [σ0 − σ∞] exp(−t/τ2), with two time scales τ1 and τ2 provided an accurate approximation of both early and late relaxation. The characteristic time scales differed by almost two orders of magnitude for both gray and white matter. From a rheological point of view, this suggests that one time scale could be associated with the viscous and one with the porous nature of brain tissue. Including porous effects seems particularly important when modeling the interplay between early and late relaxation at high loading rates [31], which was beyond the scope of the current study.
4.5. Temporal variation of gray and white matter properties
Our study suggests that, when kept intact and hydrated, thick brain slices can be preserved over periods of days without significant alteration in mechanical properties. To prevent specimen dehydration, rather than bathing the entire sample, we only hydrated the specimen surface to reduce the effects of osmotic swelling and long-term water evaporation in the near-surface region [35]. Inherent advantages of testing thick, structurally intact brain slices, rather than small cylindrical [14], disc-shaped [38] or cuboid [39, 45] specimens, is that larger structural dimensions naturally minimize dehydration, swelling, structural degradation, and boundary effects [35]. Because of boundary effects, traditional consolidation tests on brain samples can be challenging [8]. In practice, un-confined compression is often used as an approximation to calibrate the poroviscoelastic properties of brain tissue [14]. Since our indentation of thick brain slices is inherently local, it closely mimics the in situ environment and naturally provides realistic lateral confinement conditions for both solid deformation and fluid flow.
Our study revealed that both gray and white matter tissue are insensitive to preservation times. From systematic post-mortem reports of protein level alterations, we know that six hours after death, brain tissue displays noticeable signs of proteolysis, a possible indicator for structural degradation [13]. Oscillatory shear tests of freshly harvested porcine brain samples revealed a marked increase in tissue stiffness starting six hours post mortem [18]. However, these studies were performed upon continued mechanical loading. Here, we minimized exposure to mechanical testing to clearly separate the effects of mechanical history and post-mortem time. When comparing frequently tested specimens on the first day post mortem, gray and white matter moduli displayed standard deviations of 13% and 16% as summarized in Figure 10 and Table 2. When comparing rested and recovered specimens within five days post mortem, standard deviations in both gray and white matter moduli were as low as 5% as indicated in Figures 9 and 10. Early findings from almost half a decade ago reported that the mechanical properties of live, dead, and fixed mammalian brain tissue were virtually indistinguishable [33]. A comparison of in vivo, in situ, and in vitro tissue properties confirmed these observations, and suggested that perfusion does not affect the stiffness of living brain tissue [19].
Both gray matter and white matter moduli consistently increased with the number of indentation cycles during multiple-short-range indentation as highlighted in Figure 10 and Table 2. This is in agreement with the reported structural stiffening upon preconditioning, an effect that disappeared after five to six cycles [19]. Our results suggest that the effect of preconditioning is fully reversible within a few hours of rest. In summary, the mechanical history of the specimen might play a more important role than previously assumed [40]: The recommended rest period of 50s between two consecutive tests might seriously underestimate the necessary recovery time, especially when testing at low lowing rates for long testing times [45].
4.6. Regional variation of gray and white matter properties
Our study indicates that white matter, with an average modulus of 1.895kPa±0.592kPa, was on average 39% stiffer than gray matter, with an average modulus of 1.368kPa±0.289kPa, as illustrated in Figure 11. A two-sample t-test revealed a significant difference in white and gray matter stiffness, p<0.01. White matter, with a standard deviation of 31%, displayed stronger regional variations than gray matter, with a standard deviation of 21%, as indicated in Table 3. Various studies have shown that brain tissue properties do indeed display a strong regional variation [7]. Our trends are in agreement with the recent literature and suggest that the microstructural architecture of white matter is more heterogeneous than gray matter, and also more anisotropic [45].
4.7. Limitations
Our current study focused on characterizing the differences between gray and white matter tissue. We are currently enhancing our model to characterize tissue nonlinearities in the large deformation regime. We are also performing dynamic testing to characterize storage and loss moduli for different frequencies [35] and compare the results to the quasi-static relaxation tests reported here. This will allow us to better characterize the time-dependent behavior, and, possibly, by using inverse finite element analysis [3], to correlate it closely to a poroviscoelastic material model [14]. Since the present study was initially motivated by the long time scales of brain development [15], nonlinearities and short time scales were less relevant here.
While our indentation method reliably recorded gray and white matter moduli, it remains an ex vivo technique that cannot predict the mechanical characterstics of living brain tissue in situ. Within the past decade, magnetic resonance elastography has rapidly advanced as a non-invasive, in vivo tool, directly applicable to living human brain tissue [23]. Magnetic resonance elastography measures the mechanical properties of soft tissues by introducing shear waves and assessing their propagation velocity using magnetic resonance imaging. A recent study in ferrets suggested that, at loading rates from 400Hz to 800Hz, elastic and viscous properties of gray and white matter were indistinguishable [12]. Another study in humans at loading rates of 200Hz found that gray matter storage moduli, with 3.1kPa, were on average 12% larger than white matter storage moduli, with 2.7kPa, while loss moduli of gray and white matter, with 2.5kPa, were identical [21]. This is in strong disagreement with another magnetic resonance elastography study in humans, which found that white matter moduli, with 40.8kPa, were on average 161% larger than the gray matter moduli, with 15.6kPa [30]. Despite its tremendous potential, magnetic resonance elastography data seem to vary markedly, both qualitatively and quantitatively, mainly because the technology itself is still in its infancy [7].
5. Concluding remarks
We have presented an easy-to-use, robust, reliable, and repeatable method to characterize the mechanical properties of gray and white matter tissue. To probe coronal slices of fresh mammalian brain, we used a commercially-available nanoindentation instrument, initially designed for stiff inorganic materials, and replaced its commonly-used sharp indenter tip with a circular flat punch. Flat-punch indentation of thick, intact brain slices minimizes adhesion effects and other challenges associated with small specimens and naturally minimizes boundary effects, dehydration, swelling, and structural degradation. Our coronal slices maintained their structural integrity within five days post mortem, and their mechancial properties remained virtually unchanged: white matter was approximately one third stiffer than gray matter and displayed larger regional variations; it was more viscous than gray matter and displayed longer relaxation times. Understanding the rheological differences between gray and white matter may have direct implications on diagnosing, understanding, and eventually manipulating mechanical phenomena during neurodevelopment including lissencephaly, polymicrogyria, brachycephaly, plagiocephaly, and hydrocephalus.
Acknowledgments
This work was supported by the German National Science Foundation grant STE 544/50-1 to Silvia Budday and Paul Steinmann, by the Stanford Bio-X Interdisciplinary Initiatives Program, by the National Science Foundation CAREER award CMMI 0952021, and by the National Institutes of Health Grant U01 HL119578 to Ellen Kuhl.
Footnotes
Publisher's Disclaimer: This is a PDF file of an unedited manuscript that has been accepted for publication. As a service to our customers we are providing this early version of the manuscript. The manuscript will undergo copyediting, typesetting, and review of the resulting proof before it is published in its final citable form. Please note that during the production process errors may be discovered which could affect the content, and all legal disclaimers that apply to the journal pertain.
References
- 1.Bayly PV, Taber LA, Kroenke CD. Mechanical forces in cerebral cortical folding: A review of measurements and models. J Mech Beh Biomed Mat. 2014;29:568–581. doi: 10.1016/j.jmbbm.2013.02.018. [DOI] [PMC free article] [PubMed] [Google Scholar]
- 2.Blum MM, Ovaert TC. Experimental and numerical tribological studies of a boundary lubricant functionalized poroviscoelastic PVA hydrogel in normal contact and sliding. J Mech Beh Biomed Mat. 2012;14:248–258. doi: 10.1016/j.jmbbm.2012.06.009. [DOI] [PubMed] [Google Scholar]
- 3.Böl M, Kruse R, Ehret AE. On a staggered iFEM approach to account for friction in compression testing of soft materials. J Mech Beh Biomed Mat. 2013;27:204–213. doi: 10.1016/j.jmbbm.2013.04.009. [DOI] [PubMed] [Google Scholar]
- 4.Böl M, Ehret AE, Leichsenring K, Weigert C, Kruse R. On the anisotropy of skeletal muscle tissue under compression. Acta Biomat. 2014;10:3225–3234. doi: 10.1016/j.actbio.2014.03.003. [DOI] [PubMed] [Google Scholar]
- 5.Budday S, Raybaud C, Kuhl E. A mechanical model predicts morphological abnormalities in the developing human brain. Scientific Reports. 2014;4:5644. doi: 10.1038/srep05644. [DOI] [PMC free article] [PubMed] [Google Scholar]
- 6.Budday S, Steinmann P, Kuhl E. The role of mechanics during brain development. J Mech Phys Solids. 2014;72:75–92. doi: 10.1016/j.jmps.2014.07.010. [DOI] [PMC free article] [PubMed] [Google Scholar]
- 7.Chatelin S, Constantinesco A, Willinger R. Fifty years of brain tissue mechanical testing: From in vitro to in vivo investigations. Biorheology. 2010;47:255–276. doi: 10.3233/BIR-2010-0576. [DOI] [PubMed] [Google Scholar]
- 8.Chen S, Bilston LE. Unconfined compression of white matter. J Biomech. 2007;40:117–124. doi: 10.1016/j.jbiomech.2005.11.004. [DOI] [PubMed] [Google Scholar]
- 9.Christ AF, Franze K, Gautier H, Moshayedi P, Fawcett J, Franklin RJM, Karadottir RT, Guck J. Mechanical difference between white and gray matter in the rat cerebellum measured by scanning force microscopy. J Biomech. 2010;43:2986–2992. doi: 10.1016/j.jbiomech.2010.07.002. [DOI] [PubMed] [Google Scholar]
- 10.Elkin BS, Morrison B. Viscoelastic properties of the P17 and adult rat brain from indentation in the coronal plane. J Biomech Eng. 2013;135:114507. doi: 10.1115/1.4025386. [DOI] [PubMed] [Google Scholar]
- 11.Fallenstein GT, Hulce VD, Melvin JW. Dynamic mechanical properties of human brain tissue. J Biomech. 1969;2:217–226. doi: 10.1016/0021-9290(69)90079-7. [DOI] [PubMed] [Google Scholar]
- 12.Feng Y, Clayton EH, Chang Y, Okamoto RJ, Bayly PV. Viscoelastic properties of the ferret brain measured in vivo at multiple frequencies by magnetic resonance elastography. J Biomech. 2013;46:863–870. doi: 10.1016/j.jbiomech.2012.12.024. [DOI] [PMC free article] [PubMed] [Google Scholar]
- 13.Fountoulakis M, Hardmeier R, Höger H, Lubec G. Postmortem changes in the level of brain proteins. Exp Neurol. 2001;167:86–94. doi: 10.1006/exnr.2000.7529. [DOI] [PubMed] [Google Scholar]
- 14.Franceschini G, Bigoni D, Regitnig P, Holzapfel GA. Brain tissue deforms similar to filled elastomers and follows consolidation theory. J Mech Phys Solids. 2006;54:2592–2620. [Google Scholar]
- 15.Franze K, Janmey PA, Guck J. Mehcanics in neuronal development and repair. Annu Rev Biomed Eng. 2013;15:227–251. doi: 10.1146/annurev-bioeng-071811-150045. [DOI] [PubMed] [Google Scholar]
- 16.Galford JE, McElhaney JH. A viscoelastic study of scalp, brain, and dura. J Biomech. 1970;3:211–221. doi: 10.1016/0021-9290(70)90007-2. [DOI] [PubMed] [Google Scholar]
- 17.Garcia JA, Pena JM, McHugh S, Jérusalem A. A model of the spatially dependent mechanical properties of the axon during its growth. CMES. 2012;1:1–22. [Google Scholar]
- 18.Garo A, Hrapko M, van Dommelen JAW, Peters GWM. Towards a reliable characterization of the mechanical behavior of brain tissue: The effects of post-mortem time and sample preparation. Biorheology. 2007;44:51–58. [PubMed] [Google Scholar]
- 19.Gefen A, Margulies SS. Are in vivo and in situ brain tissues mechanically similar? J Biomech. 2004;37:1339–1352. doi: 10.1016/j.jbiomech.2003.12.032. [DOI] [PubMed] [Google Scholar]
- 20.Goriely A, Geers MGD, Holzapfel GA, Jayamohan J, Jerusalem A, Sivaloganathan S, Squier W, van Dommelen JAW, Waters S, Kuhl E. Mechanics of the brain: Perspectives, challenges, and opportunities. Biomech Mod Mechanobio. 2015 doi: 10.1007/s10237-015-0662-4. available online first. [DOI] [PMC free article] [PubMed] [Google Scholar]
- 21.Green MA, Bilston LE, Sinkurs R. In vivo brain viscoelastic properties measured by magnetic resonance elastography. NMR in Biomed. 2008;21:755–764. doi: 10.1002/nbm.1254. [DOI] [PubMed] [Google Scholar]
- 22.Gupta S, Carrillo F, Li C, Pruitt L, Puttlitz C. Adhesive forces significantly affect elastic modulus determination of soft polymeric materials in nanoindentation. Mat Lett. 2007;61:448–451. [Google Scholar]
- 23.Hamhaber U, Sack I, Papazoglou S, Rump J, Klatt D, Braun J. Three-dimensional analysis of shear wave propagation observed by in vivo magnetic resonance elastography of the brain. Acta Biomat. 2007;3:127–137. doi: 10.1016/j.actbio.2006.08.007. [DOI] [PubMed] [Google Scholar]
- 24.Holland MA, Miller KE, Kuhl E. Emerging brain morphologies from axonal elongation. 2014. submitted for publication. [DOI] [PMC free article] [PubMed] [Google Scholar]
- 25.Holzapfel GA, Ogden RW. Elasticity of biopolymer filaments. Acta Biomat. 2013;9:7320–7325. doi: 10.1016/j.actbio.2013.03.001. [DOI] [PubMed] [Google Scholar]
- 26.Hutchinson BL, Hutchinson LAD, Thompson JMD, Mitchell EA. Plagiocephaly and brachycephaly in the first two years of life: a prospective cohort study. Pediatrics. 2004;114:970–980. doi: 10.1542/peds.2003-0668-F. [DOI] [PubMed] [Google Scholar]
- 27.Jérusalem A, Dao M. Continuum modeling of a neuronal cell under blast loading. Acta Biomat. 2012;8:3360–3371. doi: 10.1016/j.actbio.2012.04.039. [DOI] [PMC free article] [PubMed] [Google Scholar]
- 28.Kaster T, Sack I, Samani A. Measurement of the hyperelastic properties of ex vivo brain tissue slices. J Biomech. 2011;44:1158–1163. doi: 10.1016/j.jbiomech.2011.01.019. [DOI] [PubMed] [Google Scholar]
- 29.Kohn JC, Ebenstein DM. Eliminating adhesion errors in nanoindentation of compliant polymers and hydrogels. J Mech Beh Biomed Mat. 2013;20:316–326. doi: 10.1016/j.jmbbm.2013.02.002. [DOI] [PubMed] [Google Scholar]
- 30.Kruse SA, Rose GH, Glaser KJ, Manduca A, Felmlee JP, Jack CR, Ehman RL. Magentic resonance elastography of the brain. NeuroImage. 2008;39:231–237. doi: 10.1016/j.neuroimage.2007.08.030. [DOI] [PMC free article] [PubMed] [Google Scholar]
- 31.Lang GE, Stewart PS, Vella D, Waters SL, Goriely A. Is the Donnan effect sufficient to explain swelling in brain tissue slices? J R Soc Interface. 2014;11:20140123. doi: 10.1098/rsif.2014.0123. [DOI] [PMC free article] [PubMed] [Google Scholar]
- 32.Liu K, VanLandingham MR, Ovaert TC. Mechanical characterization of soft viscoelastic gels via indentation and optimization-based inverse finite element analysis. J Mech Beh Biomed Mat. 2009;2:355–363. doi: 10.1016/j.jmbbm.2008.12.001. [DOI] [PubMed] [Google Scholar]
- 33.Metz H, McElhancy J, Ommaya AK. A comparison of the elasticity of live, dead, and fixed brain tissue. J Biomech. 1970;3:453–458. doi: 10.1016/0021-9290(70)90017-5. [DOI] [PubMed] [Google Scholar]
- 34.Miller K, Chinzei K. Constitutive modelling of brain tissue: Experiment and theory. J Biomech. 1997;30:1115–1121. doi: 10.1016/s0021-9290(97)00092-4. [DOI] [PubMed] [Google Scholar]
- 35.Miller K. Biomechanics of the Brain. Springer; New York: 2011. [Google Scholar]
- 36.Moore DF, Jérusalem A, Nyein M, Noels L, Jaffee MS, Radovitzky RA. Computational biology - Modeling of primary blast effects on the central nervous system. NeuroImage. 2009;47:T10–T20. doi: 10.1016/j.neuroimage.2009.02.019. [DOI] [PubMed] [Google Scholar]
- 37.Oliver WC, Pharr GM. Measurement of hardness and elastic modulus by instrumented indentation: Advances in understanding and refinements to methodology. J Mat Res. 2004;19:3–20. [Google Scholar]
- 38.Pervin F, Chen WW. Dynamic mechanical response of bovine gray matter and white matter brain tissues under compression. J Biomech. 2009;42:731–735. doi: 10.1016/j.jbiomech.2009.01.023. [DOI] [PubMed] [Google Scholar]
- 39.Prange MT, Margulies SS. Regional, directional, and age-dependent properties of the brain undergoing large deformation. J Biomech Eng. 2002;124:244–252. doi: 10.1115/1.1449907. [DOI] [PubMed] [Google Scholar]
- 40.Prevost TP, Balakrishnan A, Suresh S, Socrate S. Biomechanics of brain tissue. Acta Biomat. 2011;7:83–95. doi: 10.1016/j.actbio.2010.06.035. [DOI] [PubMed] [Google Scholar]
- 41.Raybaud C, Widjaja E. Development and dysgenesis of the cerebral cortex: Malformations of cortical development. Neuroimag Clin N Am. 2011;21:483543. doi: 10.1016/j.nic.2011.05.014. [DOI] [PubMed] [Google Scholar]
- 42.Richman DP, Stewart RM, Hutchinson JW, Caviness VS. Mechanical model of brain convolutional development. Science. 1975;189:18–21. doi: 10.1126/science.1135626. [DOI] [PubMed] [Google Scholar]
- 43.Sun T, Hevner RF. Growth and folding of the mammalian cerebral cortex: from molecules to malformations. Nature Neurosci. 2014;15:217–231. doi: 10.1038/nrn3707. [DOI] [PMC free article] [PubMed] [Google Scholar]
- 44.Tamura A, Hayashi S, Watanabe I, Nagayama K, Matsumoto T. Mechanical characterization of brain tissue in high-rate compression. J Biomech Sci Eng. 2007;2:115–126. [Google Scholar]
- 45.van Dommelen JAW, van der Sande TPJ, Hrapko M, Peters GWM. Mechanical properties of brain tissue by indentation: Interregional variation. J Mech Beh Biomed Mat. 2010;3:158–166. doi: 10.1016/j.jmbbm.2009.09.001. [DOI] [PubMed] [Google Scholar]
- 46.Xu G, Knutsen AK, Dikranian K, Kroenke CD, Bayly PV, Taber LA. Axons pull on the brain, but tension does not drive cortical folding. J Biomech Eng. 2010;132:071013. doi: 10.1115/1.4001683. [DOI] [PMC free article] [PubMed] [Google Scholar]
- 47.Zhang J, Michalenko MM, Kuhl E, Ovaert TC. Characterization of indentation response and stiffness reduction of bone using a continuum damage model. J Mech Beh Biomed Mat. 2010;3:189–202. doi: 10.1016/j.jmbbm.2009.08.001. [DOI] [PMC free article] [PubMed] [Google Scholar]
- 48.Zilles K, Palomero-Gallagher N, Amunts K. Deveopment of cortical folding during evolution and ontogeny. Trends Neurosci. 2013;36:275–284. doi: 10.1016/j.tins.2013.01.006. [DOI] [PubMed] [Google Scholar]