

A quarter century ago, neuroscientists discovered that a slowly drifting bar within a receptive field causes visual cortex field potentials to oscillate at a frequency between 30 and 80 Hz (reviewed in [1]). One circuit-level explanation is that recurrent connections between excitatory and inhibitory cell populations produce a resonance; the resonant frequency depends on the decay time constants in the neural populations [2]. Cognitive hypotheses about these oscillations posit that they mediate perceptual binding, attention, or feedforward signaling [1]. The strongest version is that gamma oscillations are necessary for signal propagation and hence for seeing.
It is this strong view that we and others challenge [3, 4, 9]. Using human ECoG, we observed that some stimuli (gratings and some natural images) elicit robust gamma oscillations (30–80Hz) in visual cortex, manifest as a 10-fold elevation in power. In the same subjects and with the same recording apparatus, we observed that gamma oscillations evoked by other stimuli (noise patterns and some natural images) were indistinguishable from baseline. All stimuli were plainly visible, dissociating seeing and the oscillations.
Measuring gamma oscillations
In a recent Spotlight, Brunet and colleagues [5] question this interpretation and assert that suitable statistical analysis can detect oscillations above 30Hz for nearly any stimulus, including uniform fields. They suggest that we masked spectral peaks by plotting power spectra (Figure 2 of [3]), rather than power change from baseline. For three principal reasons, these criticisms are without merit. First, Figure 1 of [3] did show power change from baseline (here Figure 1A): gratings elicited sustained narrowband gamma increases around 50 Hz, whereas noise patterns did not. Second, our quantification of the response incorporated their metric of power change from baseline (Figures 3–5 in [3]). Third, we performed additional analyses and confirmed a spectral peak 10 times above baseline in the 30–80 Hz band from gratings, but no such peak from noise stimuli. We provided these new analyses, along with the relevant data and code, in a publicly accessible form online (http://hdl.handle.net/2451/33750).
Figure 1. Stimulus effects on Gamma oscillations.
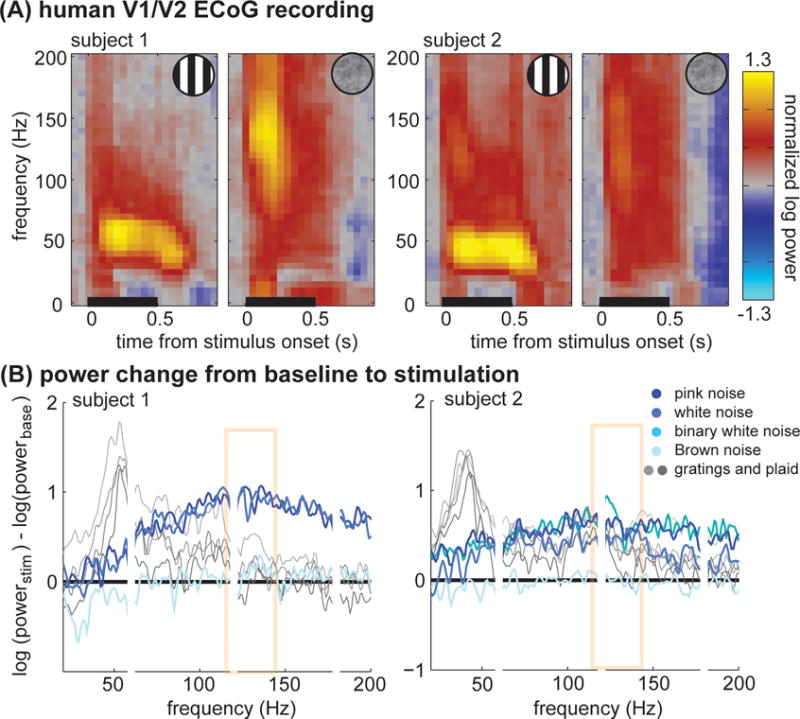
(A) Power changes from baseline from ECoG recordings in human V1/V2, plotted as a function of time and frequency. Grating stimuli elicit large, sustained gamma oscillations around 50 Hz. In higher frequencies (above 80Hz), a transient response is present. Noise stimuli elicit a different pattern of responses. Narrowband gamma oscillations from 30–80 Hz are not evident. In higher frequencies (above 80Hz), both a large transient and a smaller sustained response are present. Adapted from Figure 1 of [3].
(B) Plots of spectral power change from baseline for several stimuli. The Brunet et al. article [5] argues that the power changes from baseline show a convincing spectral peak around 130Hz for noise patterns. This area is highlighted in yellow. Adapted from Figure 2 of [3].
Brunet et al. [5] further propose that our noise stimuli elicited oscillations centered at 130 Hz, which we failed to detect because our analysis searched for oscillations in the gamma band (30–80 Hz). For 25 years, gamma oscillations have been reported as a sharp spectral peak between 30 and 80 Hz (40–80 Hz in [1]). Recently, numerous groups have reported visual-stimulus-related power changes in higher frequencies (around 80–200 Hz). Most have interpreted this signal as spectrally broadband (non-oscillatory), arising from a distinct physiological mechanism [3, 6, 7]. Because our data were hardware filtered between 0.5 and 300 Hz, and high frequency signals are lost in a noise-floor [6], it is unwise to directly interpret signal attenuation between 200 and 300 Hz as evidence of bounded 100–150Hz oscillations (Figure 1D of [5]).
In their article, Brunet and colleagues [5] re-plot power change for one condition and one electrode in a manner that visually accentuates a 130Hz response. This 130-Hz oscillation is not reproduced across conditions and subjects (Figure 1B) and is unlike classical gamma oscillations (30–80 Hz), which begin at the onset of neural firing, remain steady during the response, and are restricted to a narrow frequency band spanning approximately 10–30 Hz [8].
Neither time-frequency analysis nor between area coherence show sustained synchrony at 130 Hz (Figures 1 and S4 in [3]). Stimulus-driven oscillations above 100 Hz in visual cortex would be a novel phenomenon requiring careful description [6, 7]. Our analysis suggests this single observation is likely to arise from the onset transient and instrumental properties rather than cortical oscillations.
Stimulus dependence
Our central claim in [3] is that the spatial structure of the stimulus powerfully influences the amplitude of oscillations (30–80Hz), and for some stimuli there are no oscillations larger than the experimental noise. This stimulus dependence has also been demonstrated using multiple instruments across species [3, 7, 9]. Brunet et al. [5], argue that gamma activity is abundant during the awake state, both in monkey [10] and human ECoG [3], for nearly all stimuli. No one can rule out the possibility that gamma oscillations are present below instrumental sensitivity for many stimulus classes. However, in both data sets [3, 10], narrowband gamma amplitudes evoked by various stimuli differ by more than an order of magnitude. Theories claiming that gamma oscillations reflect cognitive and perceptual processes irrespective of the stimulus omit the largest factor affecting this signal: the image itself.
Brunet et al. [5] argue that rhythms not visible in the power spectrum may be evident in spike-field coupling or between-site coherence spectra. We cannot address all results cited in [5]; however, we tested for between-site coherence and found strong gamma coherence for grating stimuli but not noise patterns (Figure S4 in [3]), further supporting the claim that the presence of narrowband gamma oscillations is stimulus dependent. We made much of our data and code available [3]. We encourage others to do the same so that competing computational theories can be rigorously tested and improved through cooperative work.
Acknowledgments
This work was funded by National Science Foundation (NSF) Grant BCS1228397 (B.A.W.), National Institutes of Health (NIH) Grant T32- EY20485 (D.H.), and National Institutes of Health (NIH) Grant R00- EY022116 (J.W.).
References
- 1.Fries P. Neuronal gamma-band synchronization as a fundamental process in cortical computation. Annu Rev Neurosci. 2009;32:209–24. doi: 10.1146/annurev.neuro.051508.135603. [DOI] [PubMed] [Google Scholar]
- 2.Kang K, et al. LFP spectral peaks in V1 cortex: network resonance and cortico-cortical feedback. J Comput Neurosci. 2010;29(3):495–507. doi: 10.1007/s10827-009-0190-2. [DOI] [PMC free article] [PubMed] [Google Scholar]
- 3.Hermes D, et al. Stimulus Dependence of Gamma Oscillations in Human Visual Cortex. Cereb Cortex. 2014 doi: 10.1093/cercor/bhu091. [DOI] [PMC free article] [PubMed] [Google Scholar]
- 4.Ray S, Maunsell JH. Differences in gamma frequencies across visual cortex restrict their possible use in computation. Neuron. 2010;67(5):885–96. doi: 10.1016/j.neuron.2010.08.004. [DOI] [PMC free article] [PubMed] [Google Scholar]
- 5.Brunet N, et al. Gamma or no gamma, that is the question. Trends Cogn Sci. 2014 doi: 10.1016/j.tics.2014.08.006. [DOI] [PubMed] [Google Scholar]
- 6.Miller KJ, et al. Power-law scaling in the brain surface electric potential. PLoS computational biology. 2009;5(12):e1000609. doi: 10.1371/journal.pcbi.1000609. [DOI] [PMC free article] [PubMed] [Google Scholar]
- 7.Ray S, Maunsell JH. Different origins of gamma rhythm and high-gamma activity in macaque visual cortex. PLoS biology. 2011;9(4):e1000610. doi: 10.1371/journal.pbio.1000610. [DOI] [PMC free article] [PubMed] [Google Scholar]
- 8.Fries P, Scheeringa R, Oostenveld R. Finding gamma. Neuron. 2008;58(3):303–5. doi: 10.1016/j.neuron.2008.04.020. [DOI] [PubMed] [Google Scholar]
- 9.Henrie JA, Shapley R. LFP power spectra in V1 cortex: the graded effect of stimulus contrast. J Neurophysiol. 2005;94(1):479–90. doi: 10.1152/jn.00919.2004. [DOI] [PubMed] [Google Scholar]
- 10.Brunet N, et al. Visual Cortical Gamma-Band Activity During Free Viewing of Natural Images. Cereb Cortex. 2013 doi: 10.1093/cercor/bht280. [DOI] [PMC free article] [PubMed] [Google Scholar]