Abstract
Objective:
To evaluate ictal adipokine levels in episodic migraineurs and their association with pain severity and treatment response.
Methods:
This was a double-blind, placebo-controlled trial evaluating peripheral blood specimens from episodic migraineurs at acute pain onset and 30 to 120 minutes after treatment with sumatriptan/naproxen sodium vs placebo. Total adiponectin (T-ADP), ADP multimers (high molecular weight [HMW], middle molecular weight, and low molecular weight [LMW]), leptin, and resistin levels were evaluated by immunoassays.
Results:
Thirty-four participants (17 responders, 17 nonresponders) were included. In all participants, pretreatment pain severity increased with every quartile increase in both the HMW:T-ADP ratio (coefficient of variation [CV] 0.51; 95% confidence interval [CI]: 0.08, 0.93; p = 0.019) and resistin levels (CV 0.58; 95% CI: 0.21, 0.96; p = 0.002), but was not associated with quartile changes in leptin levels. In responders, T-ADP (CV −0.98; 95% CI: −1.88, −0.08; p = 0.031) and resistin (CV −0.95; 95% CI: −1.83, −0.07; p = 0.034) levels decreased 120 minutes after treatment as compared with pretreatment. In addition, in responders, the HMW:T-ADP ratio (CV −0.04; 95% CI: −0.07, −0.01; p = 0.041) decreased and the LMW:T-ADP ratio (CV 0.04; 95% CI: 0.01, 0.07; p = 0.043) increased at 120 minutes after treatment. In nonresponders, the LMW:T-ADP ratio (CV −0.04; 95% CI: −0.07, −0.01; p = 0.018) decreased 120 minutes after treatment. Leptin was not associated with treatment response.
Conclusions:
Both pretreatment migraine pain severity and treatment response are associated with changes in adipokine levels. Adipokines represent potential novel migraine biomarkers and drug targets.
Adipokines are biologically active proteins, predominantly secreted from adipose tissue, that participate in multiple processes, including the drive to feed and pain processesing.1–4 Adiponectin (ADP), leptin (LEP), and resistin are 3 such adipokines. These adipokines modulate inflammation and endothelial function—processes that overlap with the proposed mechanisms of migraine pathophysiology. In addition, receptors for these adipokines are expressed in key structures implicated in migraine, including the hypothalamus and the cerebral microvasculature.1–4
Previous studies have reported that interictal ADP levels are increased in those with migraine, and that ictal ADP levels decline with successful abortive treatment in women episodic migraineurs.5–7 Studies evaluating interictal LEP levels in migraineurs have been inconclusive.8–12 No previous studies have evaluated ictal LEP or resistin levels in migraineurs.
Given the inflammatory roles of these adipokines and the prior research suggesting that targeted adipokine levels are altered in migraine, we hypothesized that ictal ADP, LEP, and resistin are associated with migraine pain severity and acute abortive treatment response.
METHODS
This was a multicenter, randomized, double-blind, placebo-controlled study evaluating serum ADP, LEP, and resistin levels in those with episodic migraine, before and after treatment with 85 mg sumatriptan/500 mg naproxen sodium (suma/nap) vs placebo, during acute migraine attacks.
Standard protocol approvals, registrations, and patient consents.
This study was registered at ClinicalTrials.gov (NCT01138150) and was approved by the institutional review board from each site, as previously reported in the pilot study.7 All participants gave written informed consent.
Participants.
Participants were recruited from 3 tertiary care headache clinics between December 2009 and May 2013. Full inclusion and exclusion criteria have been previously published.7 In brief, adults aged 18 years or older with 2 to 12 headache days per month, who fulfilled criteria for episodic migraine as determined by a headache specialist based on the International Classification of Headache Disorders, second edition (ICHD-2) criteria, were included.7 Those with infectious, inflammatory, metabolic, autoimmune, and cardiovascular diseases, as well as those with pain disorders other than migraine were excluded. Migraine with aura was determined at screening by a headache specialist based on ICHD-2 criteria.
Study protocol.
All participants underwent neurologic examinations and completed standardized questionnaires to identify demographics, medical history, and headache characteristics. Following completion of one 28-day prospectively maintained headache calendar, a research pharmacist randomized participants to suma/nap or placebo with a ratio of 1:1 in blocks of 4. Participants and treating research staff were blinded to treatment assignments.7
Participants were headache-free for at least 24 hours before onset of the acute episode and returned within 4 hours of onset of a moderate to severe acute migraine attack. Blood was drawn via an IV catheter at presentation and after confirmation of moderate to severe pain before treatment (T0), and at 30, 60, and 120 minutes after treatment. Pain severity was assessed with a verbal numeric rating scale (NRS) from 0 (no pain) to 10 (most severe pain). Treatment responders were defined as those with a reduction of pain from moderate to severe (≥4/10 on the NRS) at T0 to no to mild (≤3/10 on the NRS) at 120 minutes after treatment with either suma/nap or placebo. Headache rescue medications (e.g., sumatriptan, nonsteroidal anti-inflammatory medications, antihistamines, dopamine antagonists) were permitted after the final blood draw.
Covariates.
Headache-related disability was evaluated using the Headache Impact test–6. Depression was evaluated using the Patient Health Questionnaire–9, with a score of ≥15 classified as major depressive disorder. Body mass index was evaluated based on measured height to the nearest 0.5 inch and weight to the nearest 0.5 pound.
Laboratory methods.
After sampling, blood was centrifuged, aliquoted, and stored at −80°C until assayed. The Core Laboratory of the Center for Clinical and Translational Science, Nutrition Obesity Research Center, and Diabetes Research Center at the University of Alabama at Birmingham conducted all laboratory analyses.7
Adipokines.
All adipokine assays were measured in duplicate and were above the lower limit of detection.
Adiponectin.
Total ADP (T-ADP) was evaluated by a radioimmunoassay (Millipore Corp., Billerica, MA) with a minimum assay sensitivity of 0.92 ng/mL, interassay coefficient of variation (CV) of 10.87%, and intra-assay CV of 4.80%. ADP multimers were evaluated by an enzyme immunosorbent assay (ALPCO, Salem, NH). High-molecular-weight (HMW), middle-molecular-weight (MMW), and low-molecular-weight (LMW) species were differentiated by the digestion and separation steps of the assay, with a sensitivity of 0.019 ng/mL, interassay CV of 7.01%, and intra-assay CV of 5.77%. In addition, given the opposing role of HMW-ADP and LMW-ADP in inflammation, the ADP ratios, including HMW:LMW, LMW:T-ADP, and HMW:T-ADP, were calculated using the ALPCO enzyme immunoassay.
Leptin.
Leptin was determined using a Millipore RIA kit (Millipore Corp.) with a minimum assay sensitivity of 0.92 ng/mL, an interassay CV of 7.13%, and an intra-assay CV of 6.61%.
Resistin.
Resistin was measured using a Millipore ELISA plate (Millipore Corp.) with a minimum sensitivity of 5 ng/mL, an interassay CV of 5.22%, and an intra-assay CV of 2.04%.
Baseline blood chemistry.
All baseline blood samples were drawn at T0 (i.e., pretreatment). Insulin, glucose, and total cholesterol levels were determined using standard laboratory techniques as previously described.7
Statistical analysis.
Stata 11.0 (StataCorp LP, College Station, TX) was used for all statistical analyses. Baseline demographic and clinical characteristics for treatment responders and nonresponders were summarized using means (±SD) for continuous variables and counts and percentages for categorical variables. For skewed variables, medians (interquartile range) were provided. Differences in categorical variables were evaluated using χ2 or Fisher exact tests. Independent t tests were used for continuous variables with normal distributions to evaluate differences in group mean values. Group differences in median values were examined using the Wilcoxon rank-sum test. Based on our prior studies among headache participants and controls,5 our sample size of 34 participants provides 80% power (α = 0.05) to detect a mean difference of 2.6 µg/mL and SD of 1.4 µg/mL in serum T-ADP levels between treatment and placebo groups. In treatment responders and nonresponders, the mean values of each adipokine and ADP ratio at the 3 posttreatment time points were compared with pain onset (T0) using paired t tests. The mean change in each adipokine and ADP ratios over time (to account for the differences in baseline levels) was assessed with random intercept longitudinal models, adjusted for age, race, body mass index, glucose, and study site (model 1). Univariate and multivariate linear mixed models were fit to examine the association between each adipokine level and pain severity (based on the continuous NRS) in all participants. Mixed models were used to estimate the pain severity in all participants per quartile increment of each adipokine. In addition, all adjusted analyses were repeated with treatment arm added to the model (model 2). Because the addition of treatment arm did not alter the results, all results reported refer to model 1. Post hoc sensitivity analyses excluding men from the study did not demonstrate any significant changes or materially different effect estimates from the results presented in model 1. All reported p values are 2-sided and deemed statistically significant at α = 0.05.
RESULTS
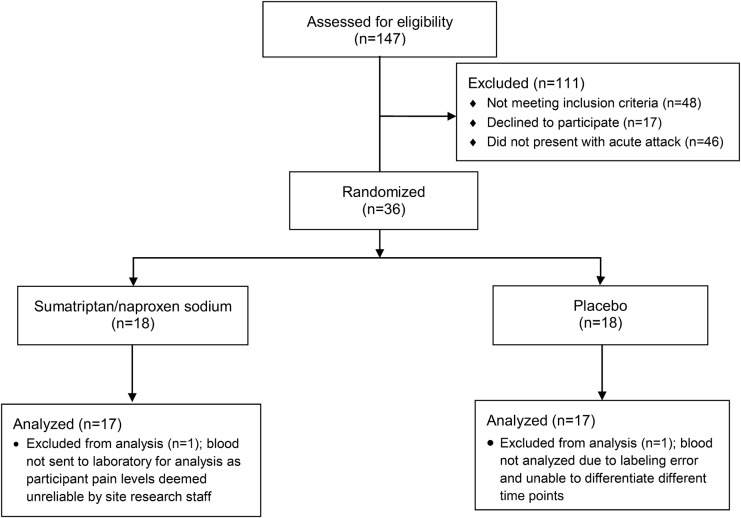
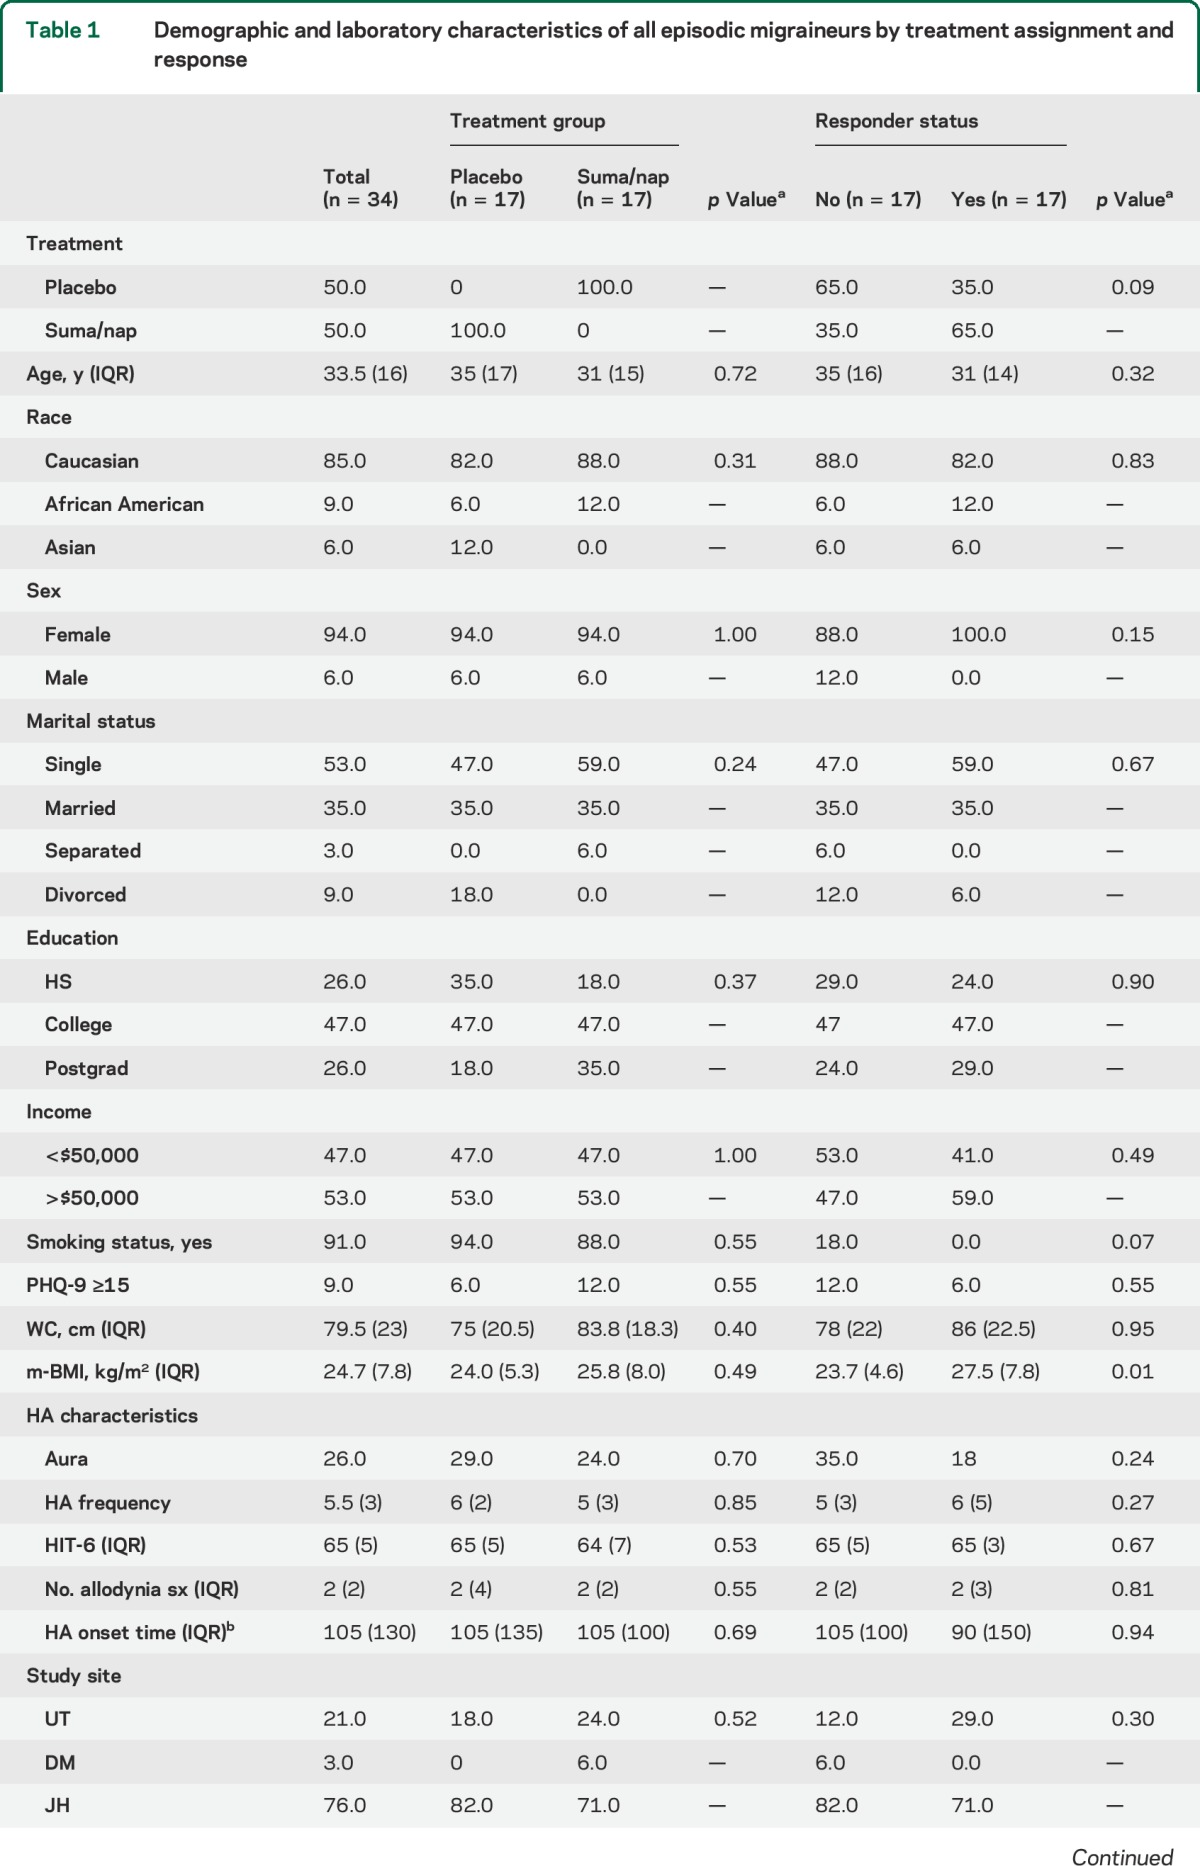
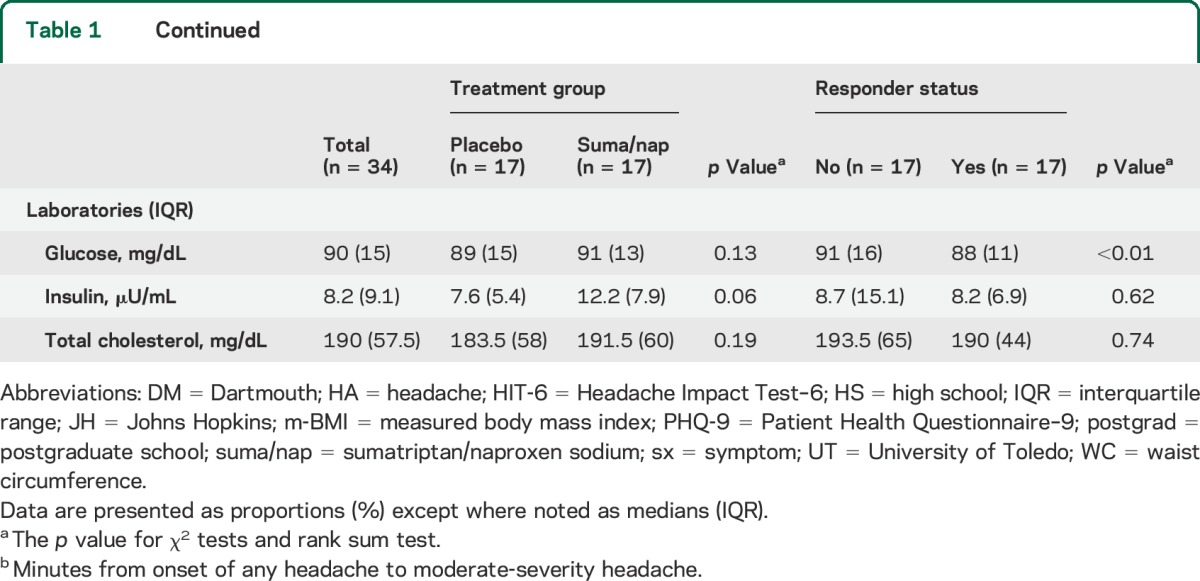
A total of 34 episodic migraineurs were randomized to receive treatment, of which 17 received suma/nap and 17 placebo. There were 17 treatment responders (11 suma/nap and 6 placebo) (figure 1). There were no demographic or baseline laboratory differences between the suma/nap and the placebo treatment groups; however, compared with nonresponders, responders had higher body mass indexes and lower glucose levels (table 1).
Figure 1. CONSORT flow diagram.
CONSORT = Consolidated Standards of Reporting Trials.
Table 1.
Demographic and laboratory characteristics of all episodic migraineurs by treatment assignment and response
Adipokine levels and pain severity.
Before study treatment (T0), in all migraine participants (n = 34), each 1-unit increase in the HMW:T-ADP ratio was associated with an increase in pain severity by 5.00 (95% confidence interval [CI]: 1.82, 8.18; p = 0.002) on the 10-point NRS. Similarly, each 1 µg/mL increase in resistin levels was associated with increased pain severity by 0.07 (95% CI: 0.01, 0.13; p = 0.029) (table 2). Incremental changes in T-ADP, the LMW:T-ADP ratio, as well as LEP were not associated with changes in pain severity before treatment. Similar associations were found for each adipokine and pain severity when evaluating across all time points, (pre- and posttreatment) (table 2).
Table 2.
Unadjusted and adjusted pain-severity trajectories in relation to changes in adipokine levels in all participants (n = 34)
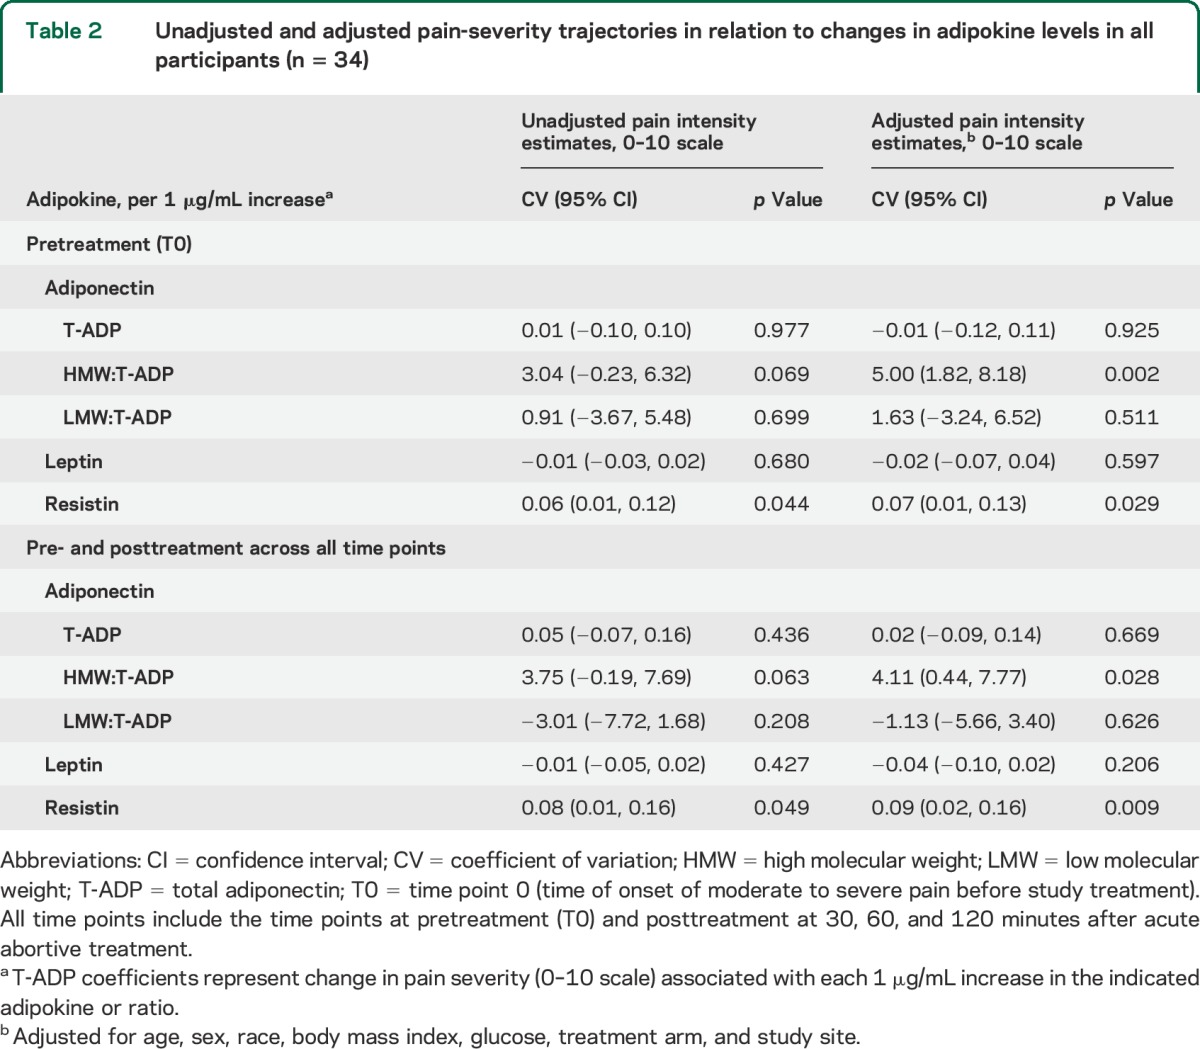
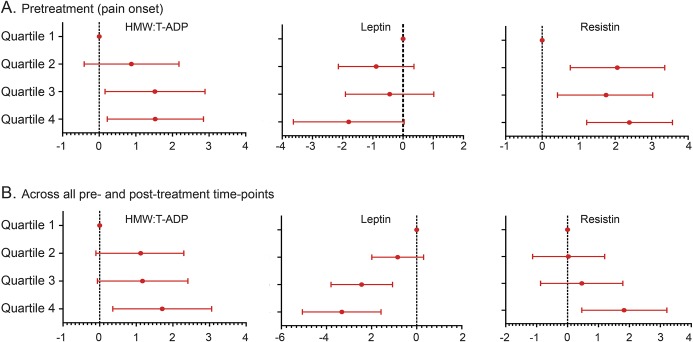
Pain severity was also evaluated by quartile increases of each adipokine. In all participants, pretreatment pain severity increased with every quartile increase in both the HMW:T-ADP ratio (CV 0.51; 95% CI: 0.08, 0.93; p = 0.019) and resistin levels (CV 0.58; 95% CI: 0.21, 0.96; p = 0.002) and was not associated with quartile changes in LEP (CV −0.54; 95% CI: −1.16, 0.09; p = 0.093) (figure 2). When pain severity was evaluated in all participants using all pre- and posttreatment time points, each quartile increase in the HMW:T ADP ratio and resistin levels remained correlated with increased pain severity (HMW:T-ADP: CV 0.51; 95% CI: 0.08, 0.95; p = 0.020; resistin: CV 0.6; 95% CI: 0.16, 1.04; p = 0.008) (figure 2). In addition, each 1-quartile increase in LEP level was associated with decreased pain severity by 1.12 (95% CI: −1.76, −0.64; p = 0.001) on the NRS (figure 2).
Figure 2. Migraine pain severity in association with quartile changes in adipokines.
Adjusted model depicting changes in the numeric pain rating scale in all 34 participants with each quartile increase in the adipokine ratio or level (μg/mL) at (A) pretreatment (i.e., onset of pain and before acute abortive treatment, T0) and (B) across all pre- and posttreatment time points (i.e., T0, and 30, 60, and 120 minutes after treatment). The model was adjusted for age, sex, race, body mass index, glucose, and study site. HMW = high molecular weight; T-ADP = total adiponectin.
Treatment response and ADP.
T-ADP.
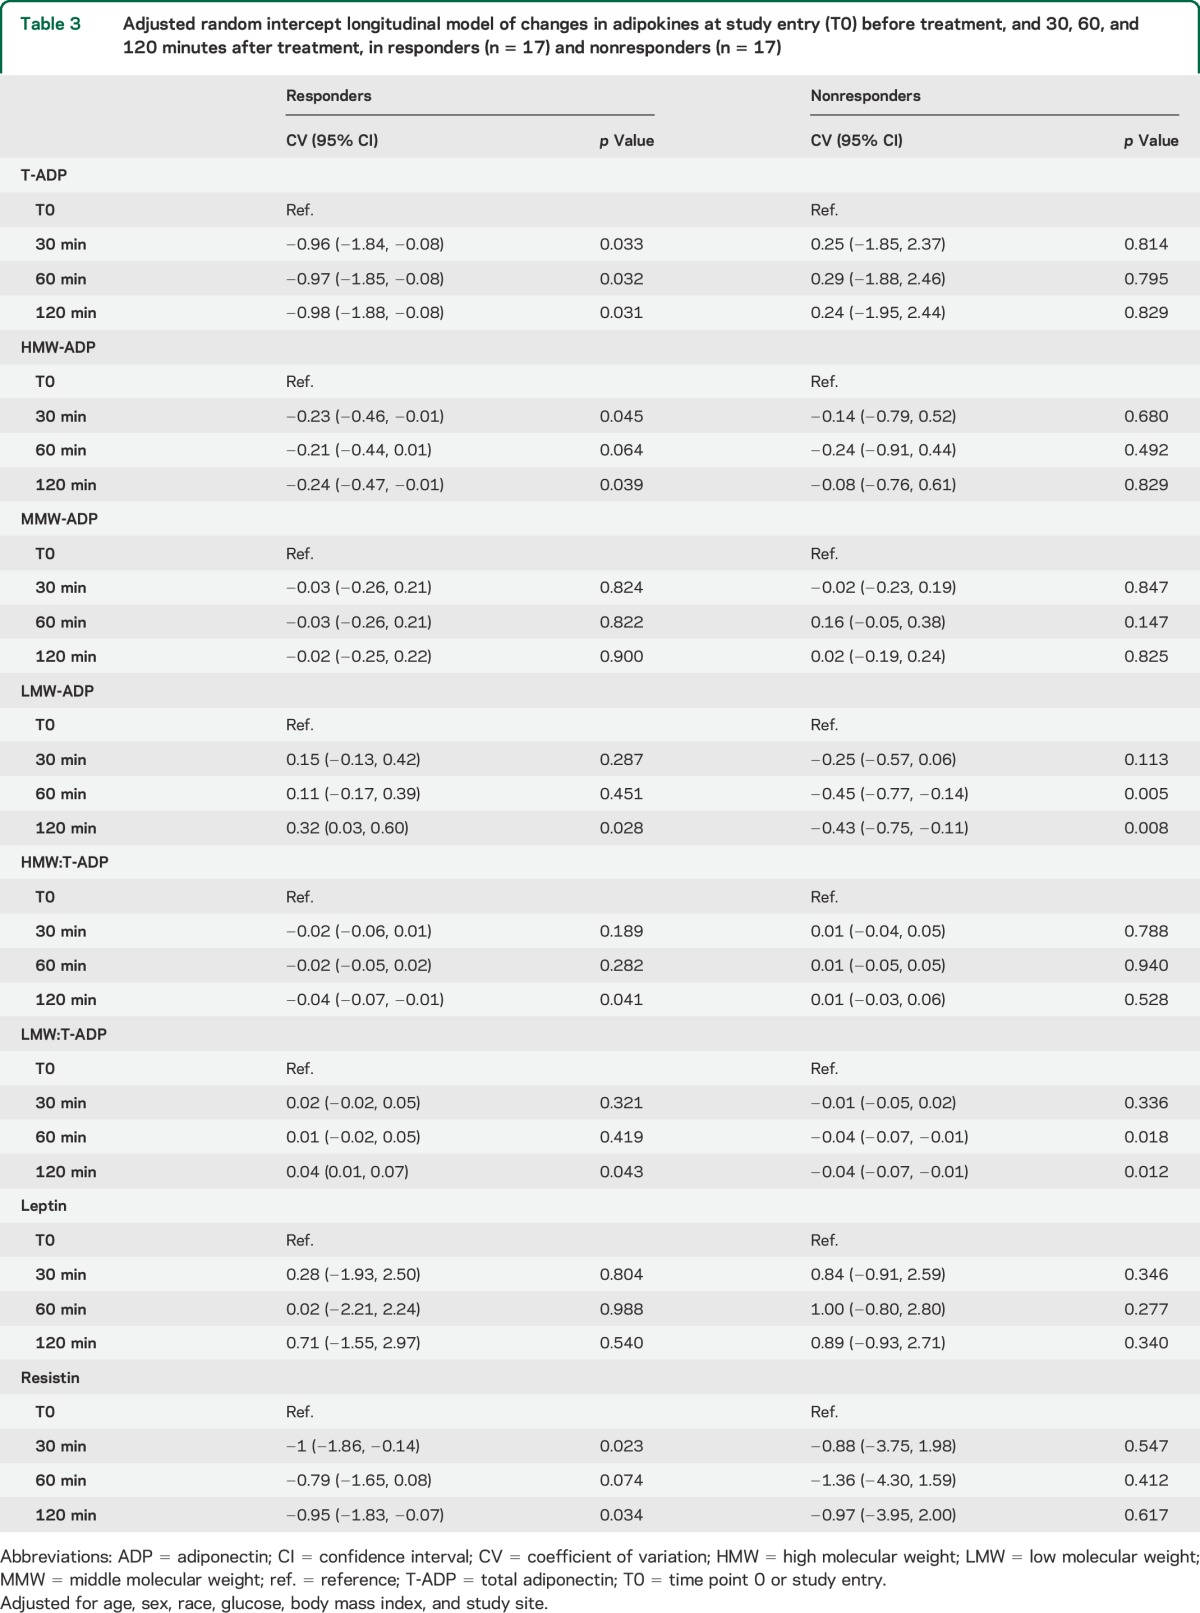
As compared with onset (12.47 ± SD 3.63 μg/mL), crude T-ADP levels were decreased at 30 minutes (11.49 ± SD 3.65 μg/mL; p = 0.001), 60 minutes (11.54 ± SD 3.16 μg/mL; p = 0.001), and 120 minutes (11.39 ± SD 3.69 μg/mL; p = 0.001) after treatment in all responders (table e-1 on the Neurology® Web site at Neurology.org). After adjustments, these changes in T-ADP levels remained significant at all posttreatment time points (table 3). In nonresponders, the crude and adjusted T-ADP levels did not change after treatment (tables 3 and e-1).
Table 3.
Adjusted random intercept longitudinal model of changes in adipokines at study entry (T0) before treatment, and 30, 60, and 120 minutes after treatment, in responders (n = 17) and nonresponders (n = 17)
HMW-ADP.
Crude HMW-ADP levels did not change after treatment; however, after adjustments, they were significantly reduced at 30 minutes (CV −0.23 μg/mL; 95% CI: −0.46, −0.01; p = 0.045), 60 minutes (CV −0.21 μg/mL; 95% CI: −0.44, −0.01; p = 0.064), and 120 minutes (CV −0.24 μg/mL; 95% CI: −0.47, −0.01; p = 0.039) (table 3). In nonresponders, HMW levels were not modulated at any time point after treatment (table 3).
MMW-ADP.
Treatment response was not associated with changes in MMW-ADP levels (table 3).
LMW-ADP.
In responders, crude LMW-ADP did not change after treatment, but after adjustments increased at 120 minutes after treatment (CV 0.32; 95% CI: 0.03, 0.60; p = 0.028) (table 3). In nonresponders, crude LMW-ADP level decreased at 120 minutes after treatment (1.19 ± 0.53 μg/mL; p = 0.021), as compared with onset (1.58 ± 0.67 μg/mL). In nonresponders, after adjustments, LMW-ADP decreased as early as 60 minutes (CV −0.45 μg/mL; 95% CI: −0.77, −0.14; p = 0.005) after treatment and remained decreased at 120 minutes (CV −0.43 μg/mL; 95% CI: −0.75, −0.11; p = 0.008) (table 3).
HMW:LMW.
Treatment response was not associated with changes in the HMW:LMW ratio.
HMW:T-ADP.
In responders, the crude HMW:T-ADP ratio did not change after treatment but after adjustments was significantly reduced at 120 minutes (CV −0.04; 95% CI: −0.07, −0.01; p = 0.41) (table 3). In nonresponders, the crude and adjusted HMW:T-ADP ratios were not significantly modulated after treatment (table 3).
LMW:T-ADP.
After treatment, the crude LMW-ADP:T-ADP ratio did not change but after adjustments was increased (in an anti-inflammatory direction) in responders at 120 minutes (CV 0.04; 95% CI: 0.01, 0.07; p = 0.043) (table 3). In nonresponders, as compared with onset, the LMW:T-ADP ratio decreased significantly, toward a proinflammatory direction, at 60 minutes (CV −0.04; 95% CI: −0.07, −0.01; p = 0.018) and at 120 minutes (CV −0.04; 95% CI: −0.07, −0.01; p = 0.012) after treatment following adjustments (table 3).
Leptin, resistin, and treatment response.
Leptin.
Treatment response was not associated with changes in LEP levels (tables 3 and e-1).
Resistin.
In responders, crude resistin levels were reduced at 30 minutes (12.98 ± 3.76 μg/mL; p = 0.048), 60 minutes (13.27 ± 4.27 μg/mL; p = 0.032), and 120 minutes (12.93 ± 3.07 μg/mL; p = 0.052) after treatment as compared with onset (14 ± 4.29 μg/mL) (table e-1). After adjustments, resistin levels decreased in responders at 30 minutes (CV −1 μg/mL; 95% CI: −1.86, −0.14; p = 0.023) and 120 minutes (CV −0.95 μg/mL; 95% CI: −1.83, −0.07; p = 0.034) (table 3). In nonresponders, there was no significant change in resistin levels after treatment (tables 3 and e-1).
DISCUSSION
In the current study, pretreatment ictal levels of ADP and resistin increased with increasing pain severity and decreased after successful acute abortive therapy. These findings are in line with results from our previous pilot study evaluating only ictal ADP levels in a smaller cohort (n = 20).7 We also found in the current study that LMW-ADP decreased, in a proinflammatory direction, in nonresponders. These results were independent of treatment arm. Notably, although in our pilot study the HMW:LMW ratio increased (in a proinflammatory direction) with increasing pain severity,7 changes in the HMW:LMW ratio were not significant in the current study. However, increases in the HMW:T-ADP ratio (also toward a proinflammatory direction) were associated with increasing pain severity. It is likely that these differences are related to differences in sample size.
In addition to ADP, we also evaluated resistin levels in episodic migraineurs for the first time. Resistin (also known as adipocyte-secreted factor [ADSF] or found in inflammatory zone 3 [FIZZ3]) was initially discovered as a substance produced by adipocytes in rats with the function of insulin resistance.13 However, in humans, resistin is primarily secreted by macrophages and is associated with activation of tumor necrosis factor α (TNF-α).14 Notably, resistin levels have been reported to be increased in those with acute coronary syndrome and rheumatoid arthritis.15,16 Our finding that ictal resistin levels increase with increasing migraine pain severity and decrease following successful acute abortive therapy is in line with the current understanding of resistin's proinflammatory roles, and suggests that resistin may also have a proinflammatory role in migraine.
Our second main finding from this study is that quartile increases in LEP, but not per-unit changes (i.e., per μg/mL), correlated with migraine pain severity. One possible explanation for this finding is that there may be a nonlinear or “U”-shaped relationship between LEP and pain severity, which we confirmed in a post hoc analysis using a quadratic model. In this model, we found that pain levels decrease with increasing LEP concentrations and mildly flatten out with LEP levels >50 μg/mL. In part, this finding, in conjunction with the well described, large, inter- and intraindividual differences in LEP levels17–19 and study design differences, may explain why previous results evaluating LEP levels in migraineurs have been conflicting.
While the mechanisms of how these adipokines may be linked to migraine pain is not yet known, it is known that these adipokines are capable of modulating several central and peripheral pathways that have been implicated in migraine pathophysiology.6,20 Centrally, hypothalamic activation and cerebral vasculature modulation occur in migraine. Receptors for each of the adipokines evaluated in the current study have been identified in the human and rodent hypothalamus as well as in the cerebral microvasculature.1,14,21–24 Furthermore, all 3 adipokines have been shown to be associated with downstream activation of several pathways implicated in migraine. These include pathways involving the AMP-activated protein kinase, modulation of endothelial nitric oxide synthase, as well as stimulation of the p38 mitogen-activated protein kinase.7,22–26 In addition, ADP and LEP stimulate the proinflammatory nuclear transcription factor, nuclear factor κB, and the release of proinflammatory cytokines including interleukin 6 (IL-6) and TNF-α.24–26 Similarly, resistin is both increased by proinflammatory mediators, such as TNF-α and IL-6, and associated with activation of TNF-α.21,22 Notably, activation of TNF-α and IL-6 upregulates CGRP (calcitonin gene-related peptide) expression, a protein that contributes to the neurogenic inflammation of migraine.27
The above data are consistent with our findings demonstrating that ADP and resistin levels increase with increasing migraine pain and decline with improvement of pain. However, in our data, as LEP levels increase, pain decreases in migraineurs. This finding may at first appear to be less consistent with the existing data supporting a proinflammatory role for LEP in some painful conditions.3,16,28,29 However, there is also a growing volume of data to suggest anti-inflammatory properties of LEP, especially in settings of neural injury. In animal models of spinal cord injury or stroke, LEP has been found to induce neuron growth and differentiation and to reduce microglial reactivity.30–32 In addition, intrathecal LEP administration after sciatic nerve injury (neuropathic pain model) actually decreased neuropathic pain and decreased the expression of proinflammatory markers such as IL-6 and TNF-α in animal models.33
There are several limitations of our current study. While this study encompassed the largest longitudinal ictal analysis of blood markers in migraine, the absolute number of subject in this study is small. A second limitation is the use of a combination migraine abortive agent (suma/nap) instead of a single acute abortive agent where each agent's influence on the adipokines can be more readily discerned. Finally, because of the study design requiring participants to present at onset of an acute migraine attack, serum samples were not able to be obtained fasting. While data support that ADP levels can be reliably sampled either fasting or nonfasting,34 it is possible that LEP and resistin levels could be altered by fluctuations of glucose levels.17,35 Of note, because the present study evaluated and controlled for serum glucose levels, it is not likely that nonfasting serum samples contributed substantially to our findings.
This study demonstrated that ADP and resistin levels increase with increasing migraine pain severity and that these levels decrease after successful acute abortive therapy. In addition, although LEP levels are not modulated by treatment response, LEP levels decrease with increasing pain severity in migraineurs. Taken together, our data support that adipokines, particularly ADP and resistin, are possible novel migraine biomarkers and therapeutic targets. Confirmatory studies evaluating ictal adipokine levels in migraineurs are warranted.
Supplementary Material
GLOSSARY
- ADP
adiponectin
- CI
confidence interval
- CV
coefficient of variation
- HMW
high molecular weight
- ICHD-2
International Classification of Headache Disorders, second edition
- IL-6
interleukin 6
- LEP
leptin
- LMW
low molecular weight
- MMW
middle molecular weight
- NRS
numeric rating scale
- suma/nap
sumatriptan/naproxen sodium
- T-ADP
total adiponectin
- TNF-α
tumor necrosis factor α
Footnotes
Supplemental data at Neurology.org
AUTHOR CONTRIBUTIONS
Nu Cindy Chai, MD: study design, data interpretation, primary authorship of manuscript, approval of final manuscript. Bizu Gelaye, PhD: primary statistical analyses, interpretation of the data, manuscript revision, approval of final manuscript. Gretchen E. Tietjen, MD: acquisition of data, data interpretation, manuscript revision, approval of final manuscript. Paul D. Dash, MD: acquisition of data, data interpretation, manuscript revision, approval of final manuscript. Barbara A. Gower, PhD: acquisition of data, data interpretation, manuscript revision, approval of final manuscript. Linda W. White, CRNP: acquisition of data, data interpretation, manuscript revision, approval of final manuscript. Thomas N. Ward, MD: acquisition of data, data interpretation, manuscript revision, approval of final manuscript. Ann I. Scher, PhD: statistical assistance, data interpretation, manuscript revision, approval of final manuscript. B. Lee Peterlin, DO: study conception and design, data acquisition, data interpretation, revision of manuscript, approval of final manuscript.
STUDY FUNDING
This research was funded through an investigator-initiated grant from GSK and the National Institute of Neurological Disorders and Stroke (K23-NS078345) to Dr. Peterlin.
DISCLOSURE
N. Chai and B. Gelaye report no disclosures relevant to the manuscript. G. Tietjen serves as an associate editor for the journal Headache. P. Dash, B. Gower, L. White, and T. Ward report no disclosures. A. Scher serves as an associate editor for the journals Cephalalgia and Pain Medicine and serves on the Allergan Advisory Board. B. Peterlin serves as an associate editor for the journals Headache and BMC Neurology and has investigator-initiated grant support from Luitpold Pharmaceuticals and the Landenberger Foundation unrelated to the current study. Go to Neurology.org for full disclosures.
REFERENCES
- 1.Thundyil J, Pavlovski D, Sobey CG, Arumugam TV. Adiponectin receptor signalling in the brain. Br J Pharmacol 2012;165:313–327. [DOI] [PMC free article] [PubMed] [Google Scholar]
- 2.Tilg H, Moschen AR. Adipocytokines: mediators linking adipose tissue, inflammation and immunity. Nat Rev Immunol 2006;6:772–783. [DOI] [PubMed] [Google Scholar]
- 3.Tian Y, Wang S, Ma Y, Lim G, Kim H, Mao J. Leptin enhances NMDA-induced spinal excitation in rats: a functional link between adipocytokine and neuropathic pain. Pain 2011;152:1263–1271. [DOI] [PMC free article] [PubMed] [Google Scholar]
- 4.Peterlin BL, Bigal ME, Tepper SJ, Urakaze M, Sheftell FD, Rapoport AM. Migraine and adiponectin: is there a connection? Cephalalgia 2007;27:435–446. [DOI] [PubMed] [Google Scholar]
- 5.Peterlin BL, Alexander G, Tabby D, Reichenberger E. Oligomerization state-dependent elevations of adiponectin in chronic daily headache. Neurology 2008;70:1905–1911. [DOI] [PubMed] [Google Scholar]
- 6.Duarte H, Teixeira AL, Rocha NP, Domingues RB. Increased serum levels of adiponectin in migraine. J Neurol Sci 2014;342:186–188. [DOI] [PubMed] [Google Scholar]
- 7.Peterlin BL, Tietjen GE, Gower BA, et al. Ictal adiponectin levels in episodic migraineurs: a randomized pilot trial. Headache 2013;53:474–490. [DOI] [PMC free article] [PubMed] [Google Scholar]
- 8.Chai NC, Bond DS, Moghekar A, Scher AI, Peterlin BL. Obesity and headache: part II: potential mechanism and treatment considerations. Headache 2014;54:459–471. [DOI] [PMC free article] [PubMed] [Google Scholar]
- 9.Bernecker C, Pailer S, Kieslinger P, et al. GLP-2 and leptin are associated with hyperinsulinemia in non-obese female migraineurs. Cephalalgia 2010;30:1366–1374. [DOI] [PubMed] [Google Scholar]
- 10.Guldiken B, Guldiken S, Demir M, Turgut N, Tugrul A. Low leptin levels in migraine: a case control study. Headache 2008;48:1103–1107. [DOI] [PubMed] [Google Scholar]
- 11.Schutt M, Brinkhoff J, Drenckhan M, Lehnert H, Sommer C. Weight reducing and metabolic effects of topiramate in patients with migraine: an observational study. Exp Clin Endocrinol Diabetes 2010;118:449–452. [DOI] [PubMed] [Google Scholar]
- 12.Berilgen MS, Bulut S, Gonen M, Tekatas A, Dag E, Mungen B. Comparison of the effects of amitriptyline and flunarizine on weight gain and serum leptin, C peptide and insulin levels when used as migraine preventive treatment. Cephalalgia 2005;25:1048–1053. [DOI] [PubMed] [Google Scholar]
- 13.Schwartz DR, Lazar MA. Human resistin: found in translation from mouse to man. Trends Endocrinol Metab 2011;22:259–265. [DOI] [PMC free article] [PubMed] [Google Scholar]
- 14.Park HK, Ahima RS. Resistin in rodents and humans. Diabetes Metab J 2013;37:404–414. [DOI] [PMC free article] [PubMed] [Google Scholar]
- 15.Lubos E, Messow CM, Schnabel R, et al. Resistin, acute coronary syndrome and prognosis results from the AtheroGene Study. Atherosclerosis 2007;193:121–128. [DOI] [PubMed] [Google Scholar]
- 16.Gomez R, Conde J, Scotece M, Gomez-Reino JJ, Lago F, Gualillo O. What's new in our understanding of the role of adipokines in rheumatic diseases? Nat Rev Rheumatol 2011;7:528–536. [DOI] [PubMed] [Google Scholar]
- 17.Mantzoros CS, Magkos F, Brinkoetter M, et al. Leptin in human physiology and pathophysiology. Am J Physiol Endocrinol Metab 2011;301:E567–E584. [DOI] [PMC free article] [PubMed] [Google Scholar]
- 18.Considine RV, Sinha MK, Heiman ML, et al. Serum immunoreactive-leptin concentrations in normal-weight and obese humans. N Engl J Med 1996;334:292–295. [DOI] [PubMed] [Google Scholar]
- 19.Maffei M, Halaas J, Ravussin E, et al. Leptin levels in human and rodent: measurement of plasma leptin and ob RNA in obese and weight-reduced subjects. Nat Med 1995;1:1155–1161. [DOI] [PubMed] [Google Scholar]
- 20.Lippi G, Meschi T, Matiuzzi C, Borghi L, Targher G. Adiponectin and migraine: systematic review of clinical evidence. Neurol Sci 2014;35:1167–1171. [DOI] [PubMed] [Google Scholar]
- 21.Brown RE, Wilkinson PM, Imran SA, Wilkinson M. Resistin differentially modulates neuropeptide gene expression and AMP-activated protein kinase activity in N-1 hypothalamic neurons. Brain Res 2009;1294:52–60. [DOI] [PubMed] [Google Scholar]
- 22.Nagaev I, Bokarewa M, Tarkowski A, Smith U. Human resistin is a systemic immune-derived proinflammatory cytokine targeting both leukocytes and adipocytes. PLoS One 2006;1:e31. [DOI] [PMC free article] [PubMed] [Google Scholar]
- 23.Elias CF, Aschkenasi C, Lee C, et al. Leptin differentially regulates NPY and POMC neurons projecting to the lateral hypothalamic area. Neuron 1999;23:775–786. [DOI] [PubMed] [Google Scholar]
- 24.Jamaluddin MS, Yan S, Lu J, Liang Z, Yao Q, Chen C. Resistin increases monolayer permeability of human coronary artery endothelial cells. PLoS One 2013;8:e84576. [DOI] [PMC free article] [PubMed] [Google Scholar]
- 25.Kadowaki T, Yamauchi T. Adiponectin and adiponectin receptors. Endocr Rev 2005;26:439–451. [DOI] [PubMed] [Google Scholar]
- 26.Banks AS, Davis SM, Bates SH, Myers MG., Jr Activation of downstream signals by the long form of the leptin receptor. J Biol Chem 2000;275:14563–14572. [DOI] [PubMed] [Google Scholar]
- 27.Lei L, Yuan X, Wang S, et al. Mitogen-activated protein kinase pathways are involved in the upregulation of calcitonin gene-related peptide of rat trigeminal ganglion after organ culture. J Mol Neurosci 2012;48:53–65. [DOI] [PubMed] [Google Scholar]
- 28.Bedaiwy MA, Falcone T, Goldberg JM, Sharma RK, Nelson DR, Agarwal A. Peritoneal fluid leptin is associated with chronic pelvic pain but not infertility in endometriosis patients. Hum Reprod 2006;21:788–791. [DOI] [PubMed] [Google Scholar]
- 29.Homann D, Carvalho HM, Stefanello JM, et al. Hyperleptinemia independent of body adiposity in women with fibromyalgia. Rheumatol Int 2014;34:1593–1598. [DOI] [PubMed] [Google Scholar]
- 30.Avraham Y, Davidi N, Lassri V, et al. Leptin induces neuroprotection neurogenesis and angiogenesis after stroke. Curr Neurovasc Res 2011;8:313–322. [DOI] [PubMed] [Google Scholar]
- 31.Doherty GH, Oldreive C, Harvey J. Neuroprotective actions of leptin on central and peripheral neurons in vitro. Neuroscience 2008;154:1297–1307. [DOI] [PubMed] [Google Scholar]
- 32.Fernandez-Martos CM, Gonzalez P, Rodriguez FJ. Acute leptin treatment enhances functional recovery after spinal cord injury. PLoS One 2012;7:e35594. [DOI] [PMC free article] [PubMed] [Google Scholar]
- 33.Li X, Kang L, Li G, et al. Intrathecal leptin inhibits expression of the P2X2/3 receptors and alleviates neuropathic pain induced by chronic constriction sciatic nerve injury. Mol Pain 2013;9:8069. [DOI] [PMC free article] [PubMed] [Google Scholar]
- 34.Shand B, Elder P, Scott R, Frampton C, Willis J. Biovariability of plasma adiponectin. Clin Chem Lab Med 2006;44:1264–1268. [DOI] [PubMed] [Google Scholar]
- 35.Rajala MW, Lin Y, Ranalletta M, et al. Cell type-specific expression and coregulation of murine resistin and resistin-like molecule-alpha in adipose tissue. Mol Endocrinol 2002;16:1920–1930. [DOI] [PubMed] [Google Scholar]
Associated Data
This section collects any data citations, data availability statements, or supplementary materials included in this article.


