

Abstract
Objective:
We sought to develop risk scores for the progression from cognitively normal (CN) to mild cognitive impairment (MCI).
Methods:
We recruited into a longitudinal cohort study a randomly selected, population-based sample of Olmsted County, MN, residents, aged 70 to 89 years on October 1, 2004. At baseline and subsequent visits, participants were evaluated for demographic, clinical, and neuropsychological measures, and were classified as CN, MCI, or dementia. Using baseline demographic and clinical variables in proportional hazards models, we derived scores that predicted the risk of progressing from CN to MCI. We evaluated the ability of these risk scores to classify participants for MCI risk.
Results:
Of 1,449 CN participants, 401 (27.7%) developed MCI. A basic model had a C statistic of 0.60 (0.58 for women, 0.62 for men); an augmented model resulted in a C statistic of 0.70 (0.69 for women, 0.71 for men). Both men and women in the highest vs lowest sex-specific quartiles of the augmented model's risk scores had an approximately 7-fold higher risk of developing MCI. Adding APOE ε4 carrier status improved the model (p = 0.002).
Conclusions:
We have developed MCI risk scores using variables easily assessable in the clinical setting and that may be useful in routine patient care. Because of variability among populations, validation in independent samples is required. These models may be useful in identifying patients who might benefit from more expensive or invasive diagnostic testing, and can inform clinical trial design. Inclusion of biomarkers or other risk factors may further enhance the models.
As clinicians and researchers strive to identify individuals at the highest risk of dementia in the earliest possible stages, understanding the predictors of mild cognitive impairment (MCI) is crucial because individuals with MCI have an increased risk of developing dementia. A method that predicts an individual's risk of developing MCI, particularly one that is brief, inexpensive, and noninvasive, is essential for risk stratification at the population level and would enhance the design and conduct of interventional trials.
Estimates of the prevalence and incidence of MCI have been published from the prospective population-based Mayo Clinic Study of Aging (MCSA), designed to examine cognitive changes among individuals initially without dementia.1–3 Analyses of MCSA data have identified several factors associated with the risk of MCI including age, education, sex, APOE genotype,4 parkinsonism,5 diabetes,6–8 depressive symptoms,9 cardiovascular disease,10,11 stroke,12 and slow gait.13 In the present study, we focused on developing an algorithm that uses these variables to predict the risk of transitioning from cognitively normal (CN) to MCI. We concentrated on information that could easily be obtained from a medical record (i.e., prior to the physician seeing the patient). Augmented models added information obtained at the clinic visit (e.g., mental status examination, depression, and anxiety symptoms), from an informant (e.g., Clinical Dementia Rating [CDR] scale), and from a blood draw (APOE genotype). Because risk factors for MCI have been found to vary by sex, we developed sex-specific models and risk scores.
METHODS
Participants.
The MCSA methods have previously been published.1–3 Briefly, we enumerated Olmsted County, MN, residents between 70 and 89 years of age on October 1, 2004 using the medical records–linkage system of the Rochester Epidemiology Project (total population in the age stratum = 9,953).14–17 We randomly sampled 5,233 participants, stratified by age and sex. Of these, 4,398 were invited to participate and 2,719 (61.8%) either participated in person (n = 2,050) or by telephone (n = 669). Compared with participants, nonparticipants had less education, were older, more frequently men, and had more medical comorbidities.2 The present study is based on individuals who participated in person at baseline. As previously reported, the characteristics of the individuals who participated in person, vs by telephone, were generally similar. However, telephone participants were more likely to be women (70.3% vs 48.9%; p < 0.0001) and less likely to have ≥12 years of education (40.2% vs 51.9%; p < 0.0001) than in-person participants.2
Standard protocol approvals, registrations, and patient consents.
The study protocols were approved by the Mayo Clinic and Olmsted Medical Center institutional review boards. All participants provided signed informed consent.
Clinical evaluation and attainment of risk factors.
Each visit included a study coordinator interview, physician visit, and an extensive neuropsychological battery. A study coordinator met with each participant and an informant and gathered demographic information, family history, body mass index, timed gait speed, depressive (Beck Depression Inventory) and anxiety (Beck Anxiety Inventory) symptoms, and the Short Blessed Test.18 Question 5 of the Short Blessed Test, “Do you feel as if you have any problems with any aspect of your thinking or memory lately?” was used to determine the presence of subjective memory complaints. The informant interview included the Neuropsychiatric Inventory,19 CDR,20 and Functional Activities Questionnaire.21 A physician performed a medical history review, administered the Short Test of Mental Status (STMS),22 and performed a neurologic examination including the Unified Parkinson's Disease Rating Scale (UPDRS).23 A psychometrist assessed impairment in 9 tests covering 4 cognitive domains: memory: Wechsler Memory Scale–Revised (WMS-R) Logical Memory II (delayed recall), WMS-R Visual Reproductions II (delayed recall), and Auditory Verbal Learning Test (delayed recall); attention-executive function: Trail Making Test Part B and Digit Symbol Substitution from the Wechsler Adult Intelligent Scale–Revised (WAIS-R); language: Boston Naming Test and category fluency scores; and visuospatial skills: Block Design and Picture Completion Tests from the WAIS-R.
In addition, trained nurses abstracted information on medical comorbidities (e.g., history of hypertension, diabetes, heart disease, heart failure, and stroke), at the time of the baseline visit and retrospectively during midlife (ages 50–69), from the medical records–linkage system. APOE ε4 genotype was assessed by standard laboratory procedures using DNA extracted from blood.24
Diagnosis of cognitive impairment at baseline and subsequent visits.
We did not use a cognitive score–based algorithm to derive the diagnosis of MCI. Rather, a panel including the study coordinator, neuropsychologist, and physician who had examined the participant discussed each component of the examination and assigned a diagnosis of MCI according to published criteria. Namely, the criteria for MCI included the following: (1) cognition concern by the participant, informant, coordinator, or physician; (2) impairment in at least one neuropsychological domain; (3) essentially normal functional activities as derived from the CDR and the Functional Activities Questionnaire; and (4) the absence of dementia.1,2,25 Dementia was diagnosed using DSM-IV criteria.26 Participants who did not meet these criteria for MCI or dementia were classified as CN.27
Longitudinal follow-up for outcomes.
Participants were followed at 15-month intervals using the baseline protocol. Diagnosis at follow-up was made without reference to data or clinical diagnosis from prior visits. Individuals who participated in the full assessment at the initial visit, but who declined further in-person evaluations, were invited to continue their participation via a telephone interview that included the Telephone Interview of Cognitive Status–modified28–30 and the CDR.20 These data were used to obtain a diagnosis of MCI.31 The Rochester Epidemiology Project database was used to identify participants who had died, and to obtain their date of death.
Statistical analyses.
CN participants were followed from their initial in-person evaluation until their first diagnosis of MCI, diagnosis of dementia without an intervening diagnosis of MCI (n = 20), they withdrew from the study, died, or their last study visit. The age at incident MCI was determined at the midpoint between the last visit when a participant was diagnosed as CN and the first diagnosis of MCI.
We first developed a basic clinical risk model using variables that could be easily ascertained in the clinic (table 1). These variables included demographics (e.g., age, education, marital status) and clinical features (e.g., body mass index, cardiovascular disease, diabetes, family history of dementia). We then developed an augmented clinical model that also included informant-based measures and information typically collected in clinical and neurologic examinations (table 1). These variables included gait speed, neuropsychiatric symptoms, CDR, UPDRS, STMS, and Hachinski Ischemic Scale. Finally, we added APOE genotype to the augmented clinical model. Variables endorsed by fewer than 10 people at baseline (see table 1) were not examined to avoid inclusion of coefficients with unreliable estimates.
Table 1.
Variables examined for association with incident MCI in the initial clinical model (A) and in the augmented clinical model (B)
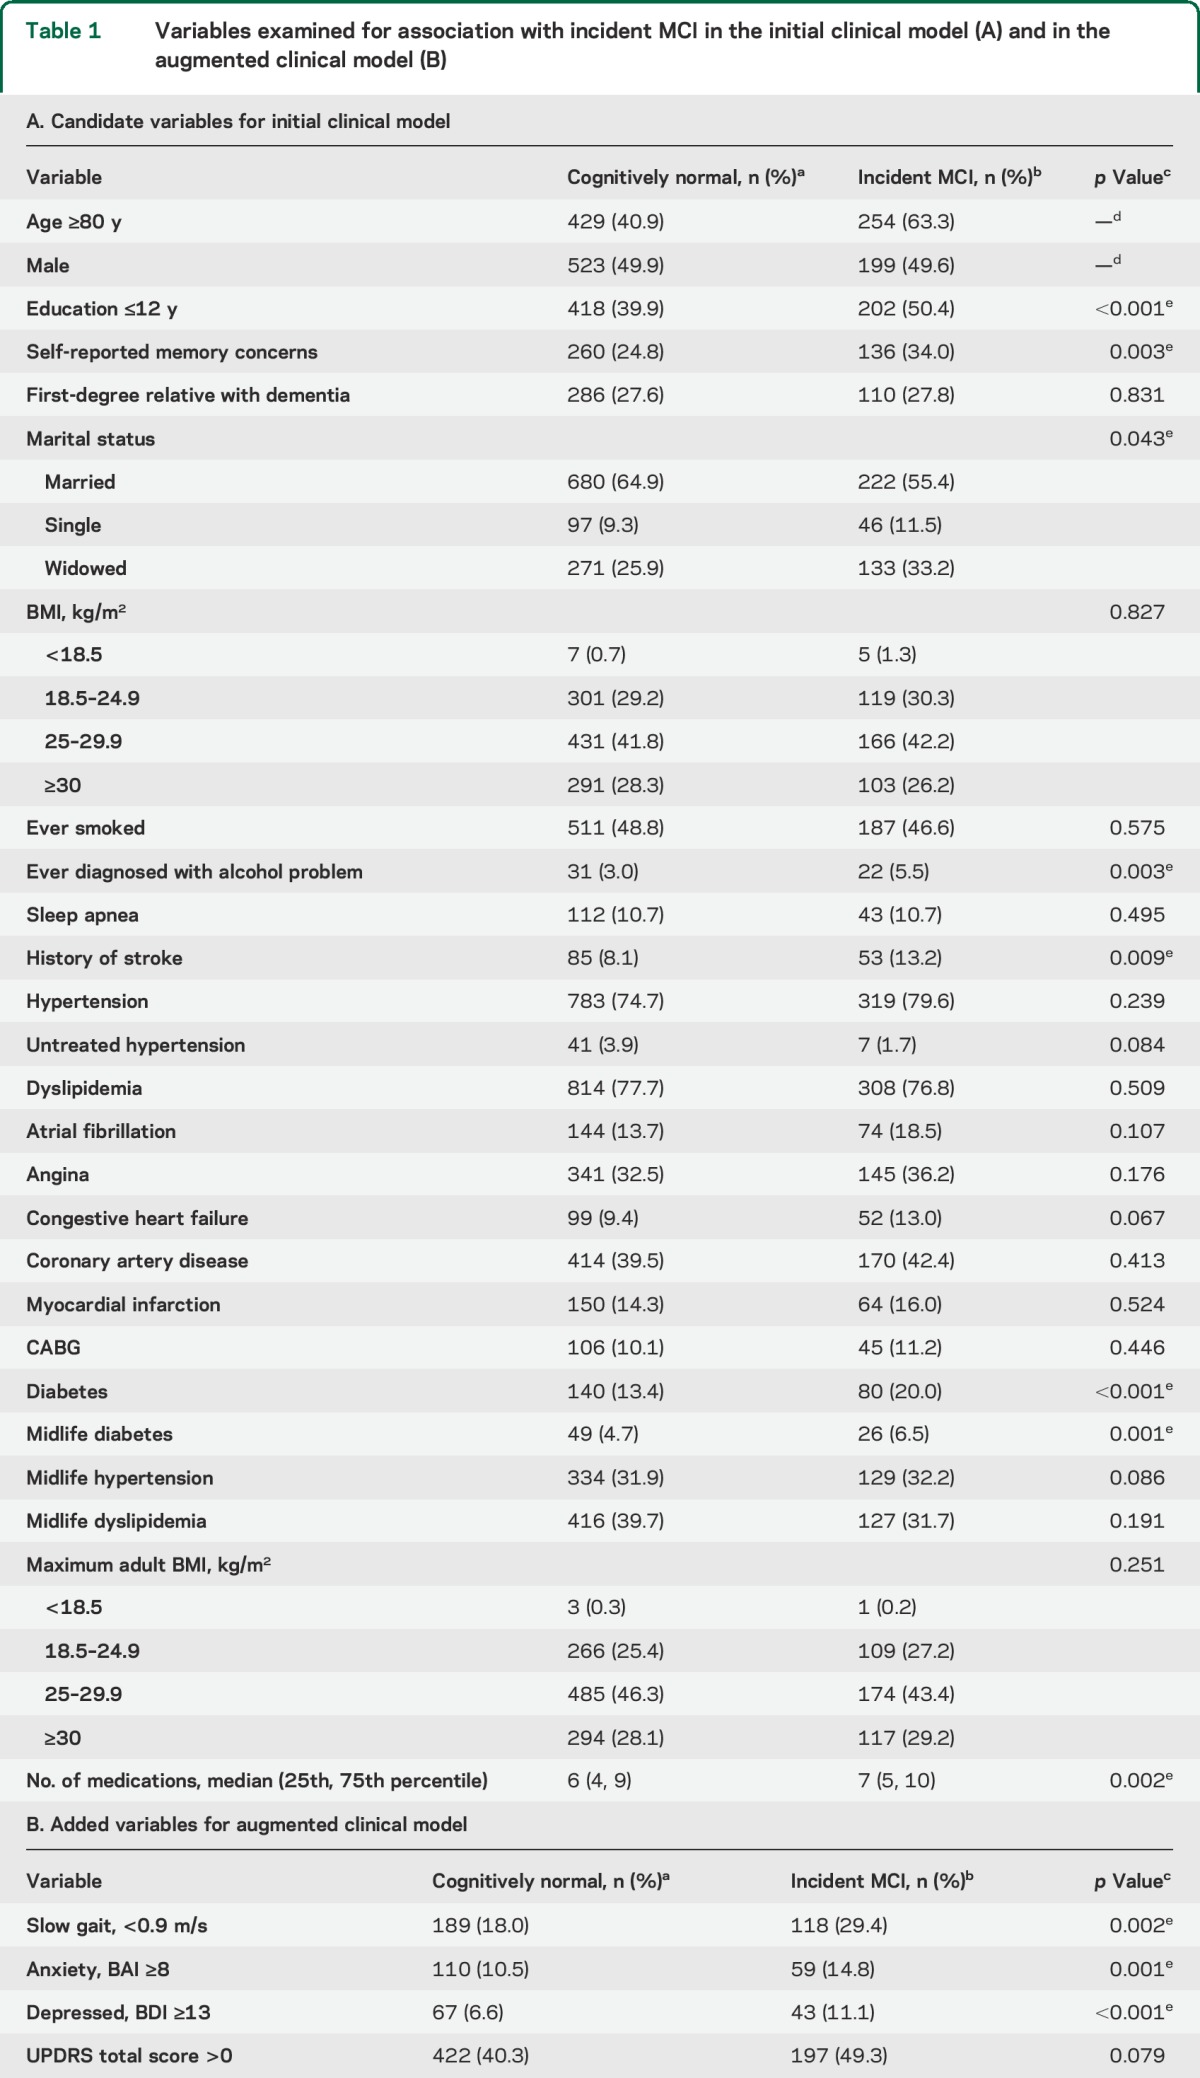
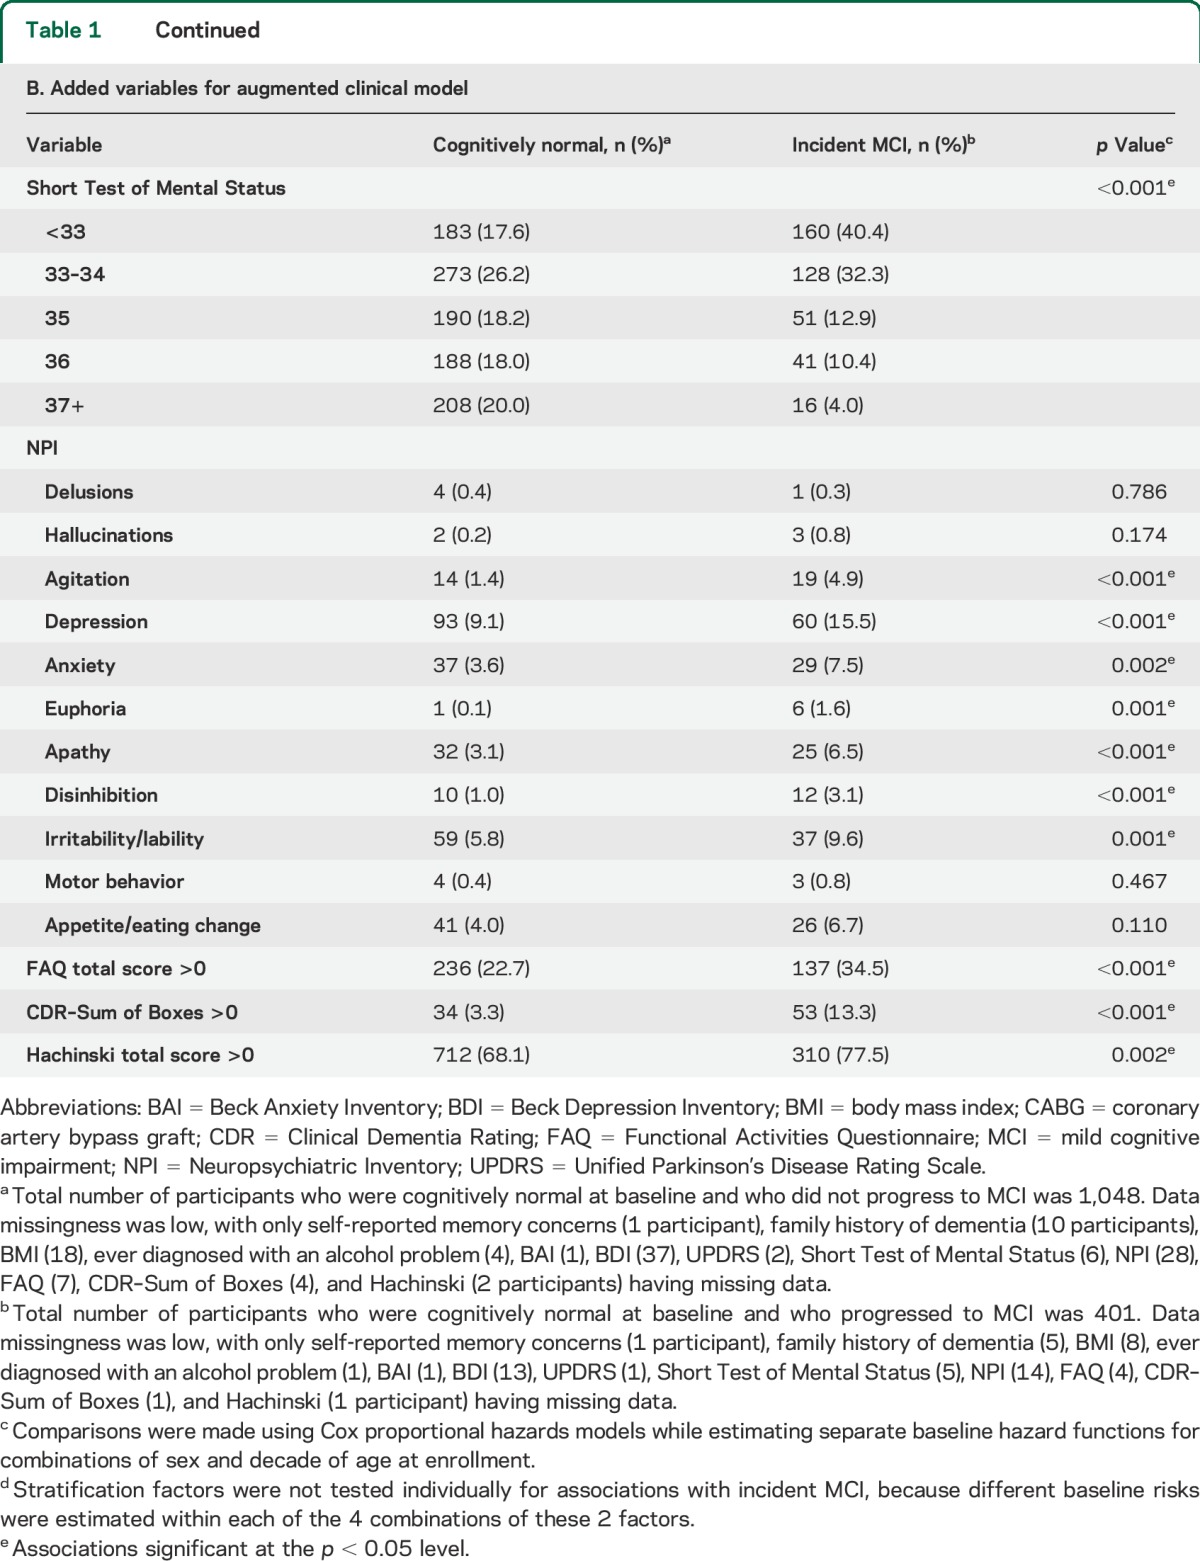
We used Cox proportional hazards models to examine the associations of the selected variables with incident MCI, with age as the time scale. We estimated separate baseline hazard functions within the sampling strata of sex by decade of age at enrollment (70–79 or 80–89). Because our analyses allowed for separate baseline hazard functions by sex, we evaluated whether variables might contribute to risk scores differentially by sex. We identified variables to be retained in the risk models using penalized regression approaches implemented in the glmnet R package. Penalized regression approaches overcome some of the limitations of stepwise model selection approaches by estimating model coefficients while constraining, or “shrinking,” estimates to not be too large. We used 10-fold cross-validation32 to estimate the shrinkage parameter. We used all variables whose covariates retained nonzero coefficients, regardless of their statistical significance, from these penalized models in separate Cox proportional hazards models to obtain estimates of the regression coefficients for the final risk models, combining estimates across men and women when this improved model fit. We divided these coefficients by the smallest coefficient in the corresponding model, and rounded the results to the nearest integer to obtain a risk score contribution for each variable in the model. An overall risk score from each model was obtained for each participant by summing the per-variable risk score contributions.
We evaluated whether the risk scores were concordant with observed MCI outcomes by computing C statistics,33 which estimate the probability that a risk score is higher for an affected individual than for an unaffected individual. We summarized the risk of MCI using Kaplan–Meier survival curves, and estimated the cumulative incidence of MCI while accounting for the competing risk of death for groups of individuals defined by quartiles of the risk scores.34
Because we currently lack an external validation dataset, we conducted a cross-validation exercise to preliminarily assess the stability of the risk scores. We used leave-one-out cross-validation, where the risk scores from each individual were estimated using datasets that did not include data from that individual.35 We assessed the accuracy with which the cross-validated risk scores classified participants according to MCI risk and report the C statistics and model performance.
RESULTS
At baseline, 1,640 participants were CN. Of these, 82 died and an additional 109 did not return for additional assessment before any follow-up, leaving 1,449 participants with at least one follow-up for these analyses. Over a median follow-up of 4.8 years (interquartile range [IQR]: 2.5, 6.4 years), 401 (27.7%) received a diagnosis of MCI and 319 (22.0%) died.
Table 1 presents baseline demographic and medical history characteristics of participants by cognitive status at last follow-up. To meet the proportional hazards assumption, we allowed for potential age-dependent (<75, 75–84, 85–89, and 90+) diabetes effects. Based on the cross-validated estimate of the degree of shrinkage in penalized regression models, 13 variables with nonzero regression coefficients were included in the initial model (table 2). The leave-one-out cross-validated C statistic (standard error [SE]) from this initial model was 0.60 (0.03). The estimated risk score contributions for each variable are shown in table 2. For instance, having completed ≤12 years of education adds 2 points to an individual's risk score. The median (IQR) of the cross-validated risk scores was 3 (2, 5) in men, and 3 (2, 4) in women. Panels A and D of the figure illustrate the MCI-free survival for women and men by quartiles of the cross-validated risk scores. Women in the highest quartile were at a 2.1-fold (95% CI: 1.5, 2.9) higher hazard of MCI vs the lowest quartile. Men in the highest quartile were at a 3.0-fold (95% CI: 2.2, 4.2) higher hazard of MCI vs the lowest quartile.
Table 2.
Predictors of MCI in the clinical risk model based on basic demographic and medical history featuresa
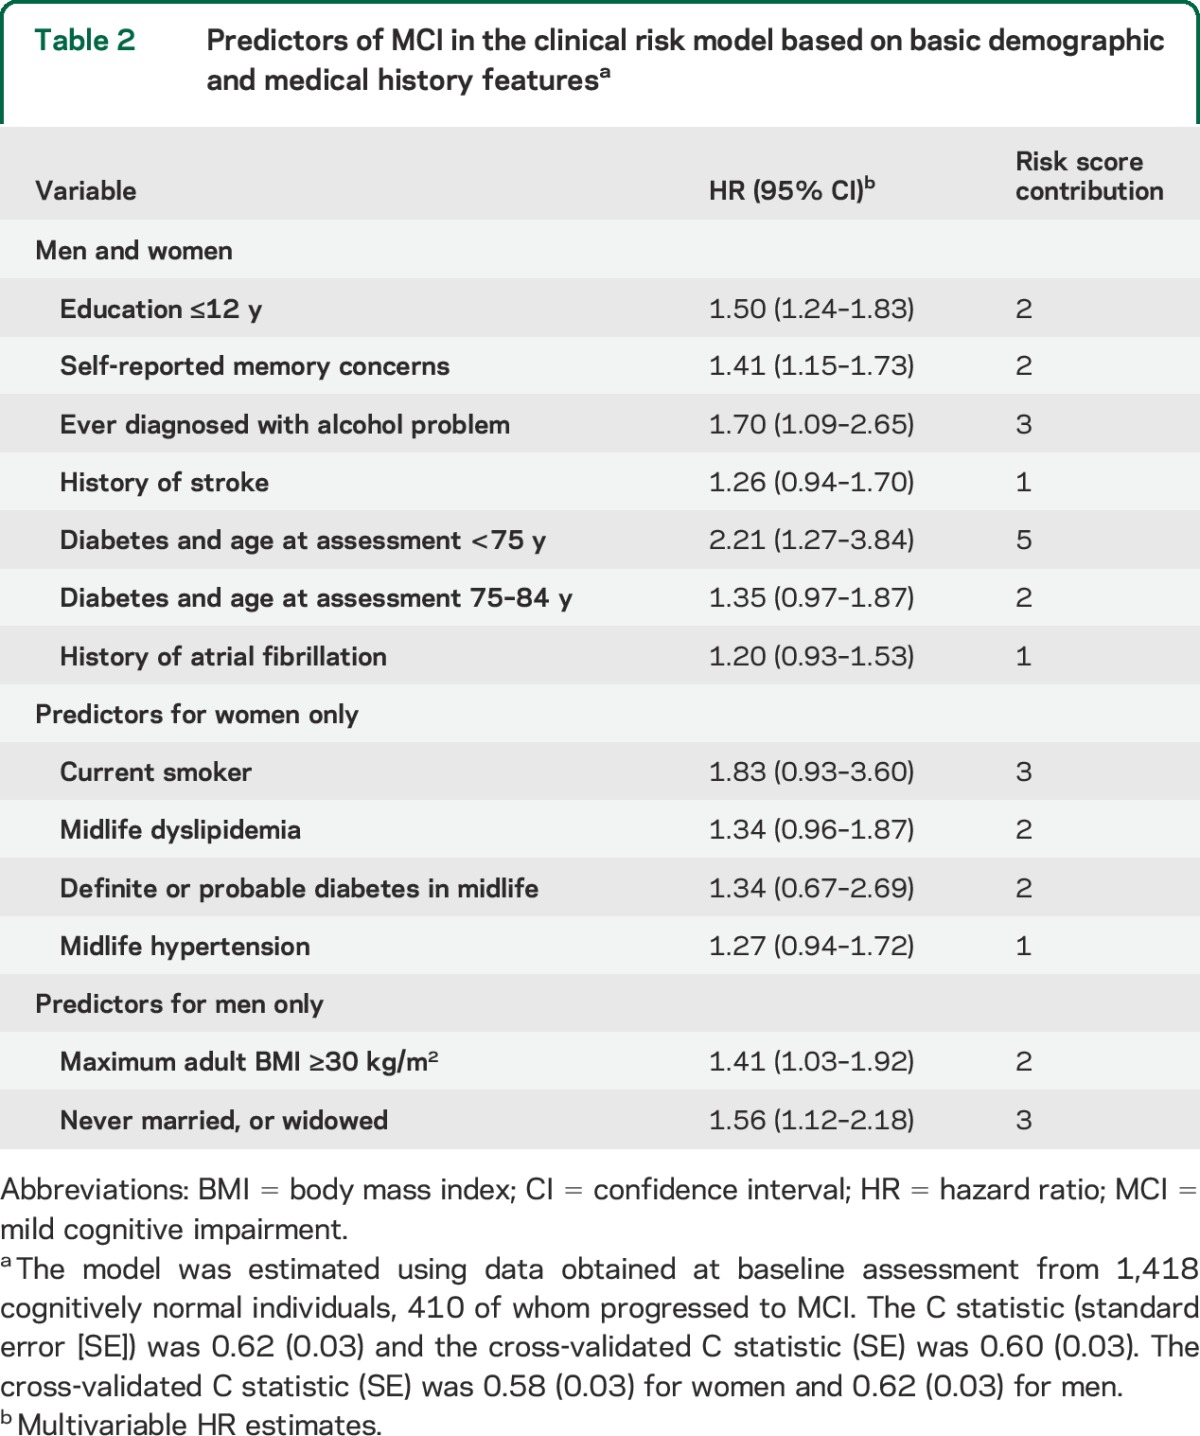
Table 1 also presents summaries of the additional patient characteristics that were examined for the augmented clinical model. To meet the proportional hazards assumption, we used 4 different diabetes coefficients within the 4 baseline age groups (<75, 75–84, 85–89, and 90+) and categorized the STMS into quintiles. Based on the cross-validated estimate of the degree of shrinkage in penalized regression models, 25 variables with nonzero regression coefficients were included in the augmented model (table 3). The leave-one-out cross-validated C statistic (SE) from this augmented clinical model was 0.70 (0.03). The estimated risk score contributions for each variable are shown in table 3. The median (IQR) of the cross-validated risk score was 36 (26, 45) in women and 27 (18, 37) in men. Panels B and E of the figure illustrate the MCI-free survival by quartiles of the cross-validated risk scores for women and men. Women in the highest quartile were at a 7.2-fold (95% CI: 4.3, 12.1) higher risk of MCI vs the lowest quartile. Men in the highest quartile were at a 7.1-fold (95% CI: 4.4, 11.4) higher risk of MCI vs the lowest quartile.
Table 3.
Predictors of MCI in the augmented clinical model, both withouta and withb the inclusion of APOE ε4 carrier status
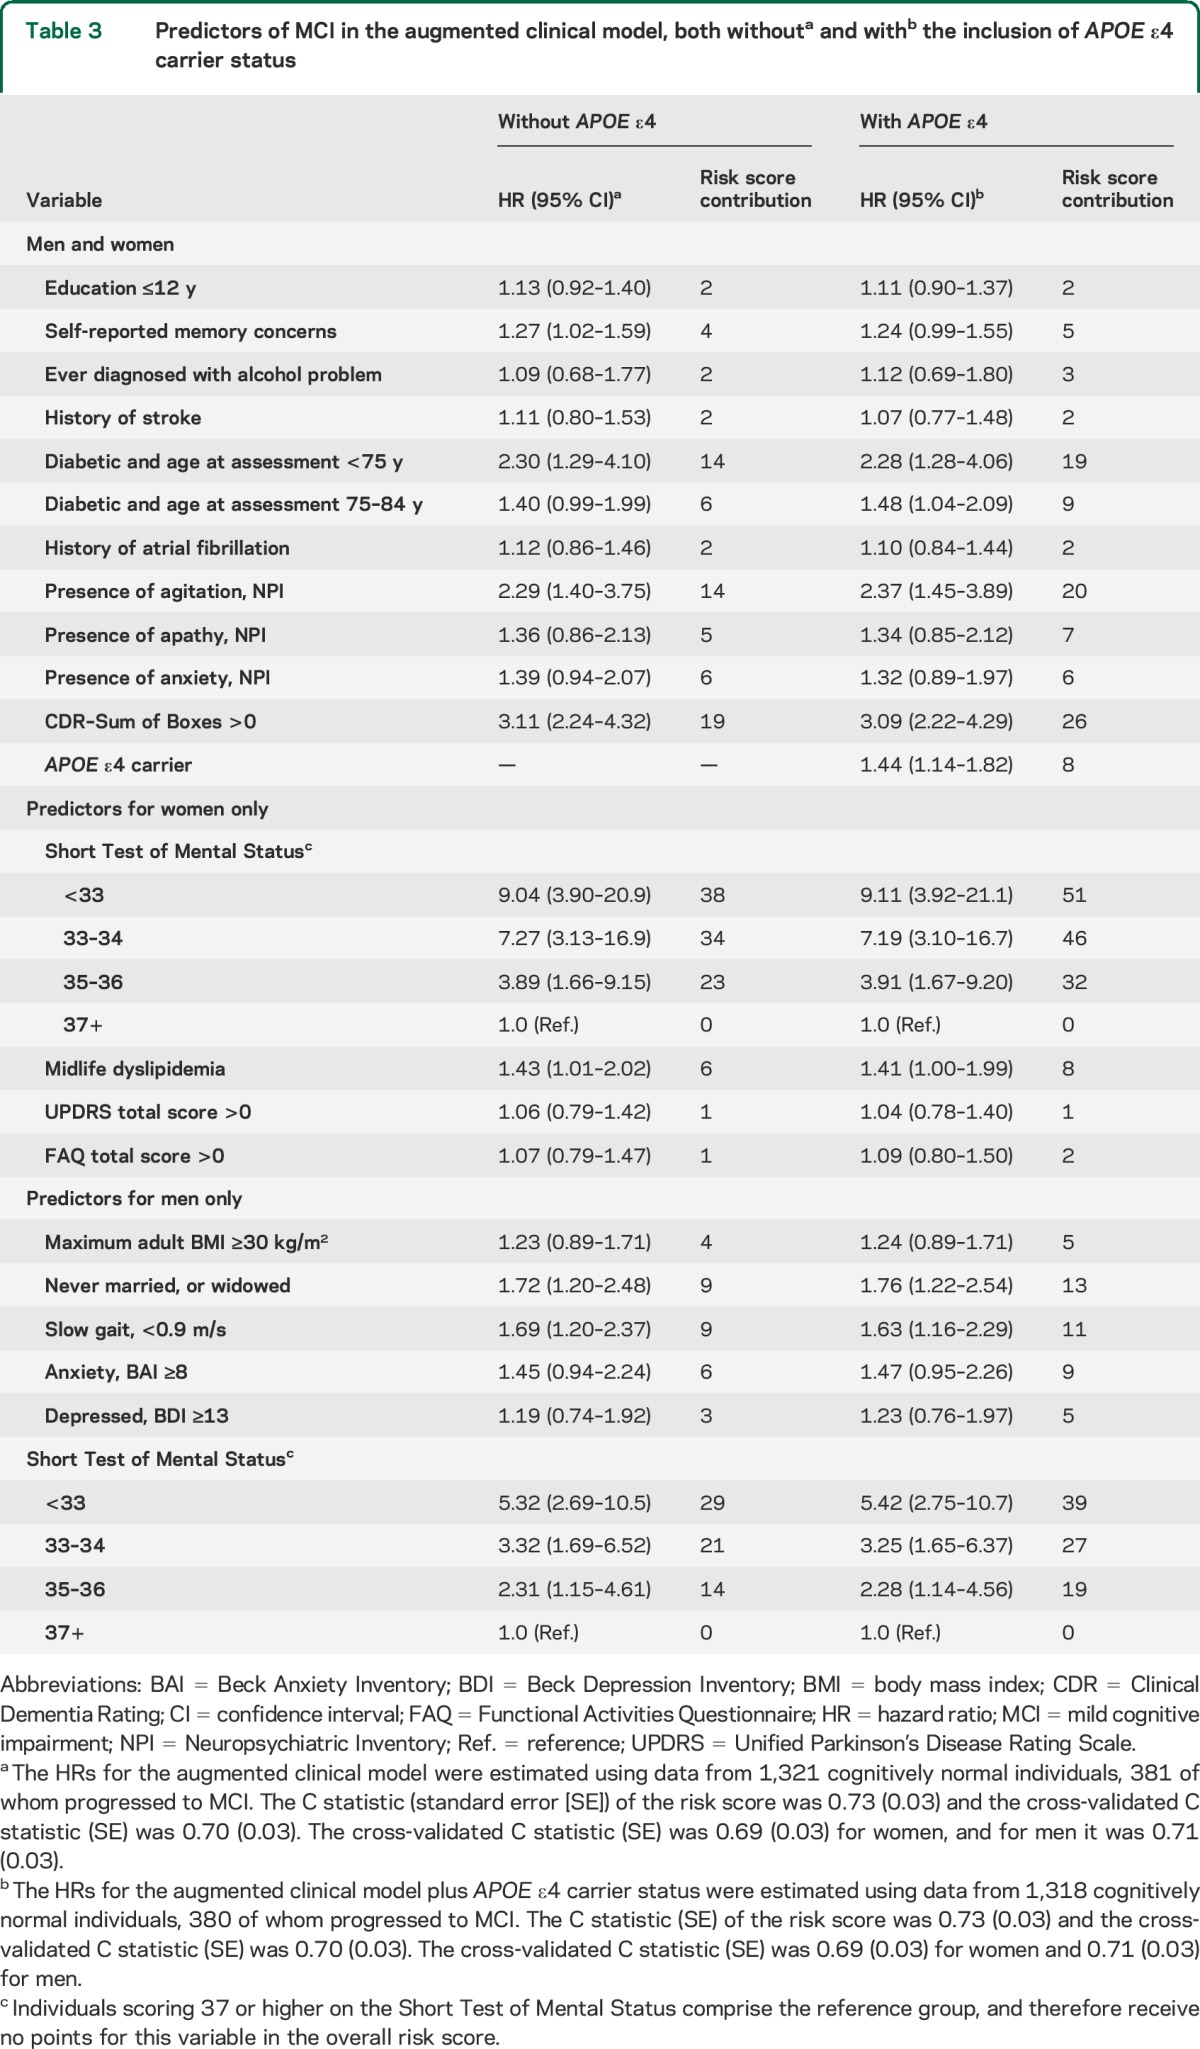
APOE ε4 carrier status significantly added to the augmented clinical model (hazard ratio = 1.44, 95% CI: 1.14, 1.82). The median (IQR) of the cross-validated risk score was 49 (37, 62) in women and 38.5 (26, 53) in men. The cross-validated C statistic (SE) was 0.70 (0.03). Women in the highest quartile were at a 6.0-fold (95% CI: 3.7, 9.6) higher risk vs the lowest quartile (figure, C). Men in the highest quartile were at a 7.5-fold (95% CI: 4.5, 12.4) higher risk vs the lowest quartile (figure, F).
Figure. Kaplan–Meier curves for MCI-free survival among participants in the MCSA, classified by quartiles of the cross-validated MCI risk scores measured at baseline.

Panels A and D correspond to the basic clinical model. Panels B and E correspond to the augmented clinical model. Panels C and F correspond to the augmented clinical model after the addition of APOE ε4 carrier status. Panels A, B, and C show data from women and panels D, E, and F show data from men. Women classified into the second, third, and fourth quartiles of the risk score by the basic model were 1.3 (95% CI: 0.8, 2.0), 1.4 (95% CI: 1.0, 2.0), and 2.1 (95% CI: 1.5, 3.0) times as likely to progress to MCI as women classified into the first quartile (A). Men classified into the second, third, and fourth quartiles of the risk score by the basic model were 0.9 (95% CI: 0.5, 1.6), 1.3 (95% CI: 0.9, 1.9), and 3.0 (95% CI: 2.2, 4.2) times as likely to progress to MCI as men classified into the first quartile (D). Women classified into the second, third, and fourth quartiles of the risk score by the augmented model were 2.7 (95% CI: 1.5, 4.6), 4.2 (95% CI: 2.5, 7.1), and 7.2 (95% CI: 4.3, 12.1) times as likely to progress to MCI as women classified into the first quartile (B). Men classified into the second, third, and fourth quartiles of the risk score by the augmented model were 1.8 (95% CI: 1.1, 3.2), 4.0 (95% CI: 2.4, 6.6), and 7.1 (95% CI: 4.4, 11.5) times as likely to progress to MCI as men classified into the first quartile (E). After adding APOE ε4 carrier status to the augmented model, women classified into the second, third, and fourth quartiles of the updated risk score were 2.2 (95% CI: 1.3, 3.7), 3.6 (95% CI: 2.2, 5.9), and 6.0 (95% CI: 3.7, 9.6) times as likely to progress to MCI as women classified into the first quartile (C). Likewise, men classified into the second, third, and fourth quartiles of the updated risk score were 2.0 (95% CI: 1.1, 3.6), 4.6 (95% CI: 2.8, 7.8), and 7.5 (95% CI: 4.5, 12.4) times as likely to progress to MCI as men classified into the first quartile (F). CI = confidence interval; MCI = mild cognitive impairment; MCSA = Mayo Clinic Study of Aging.
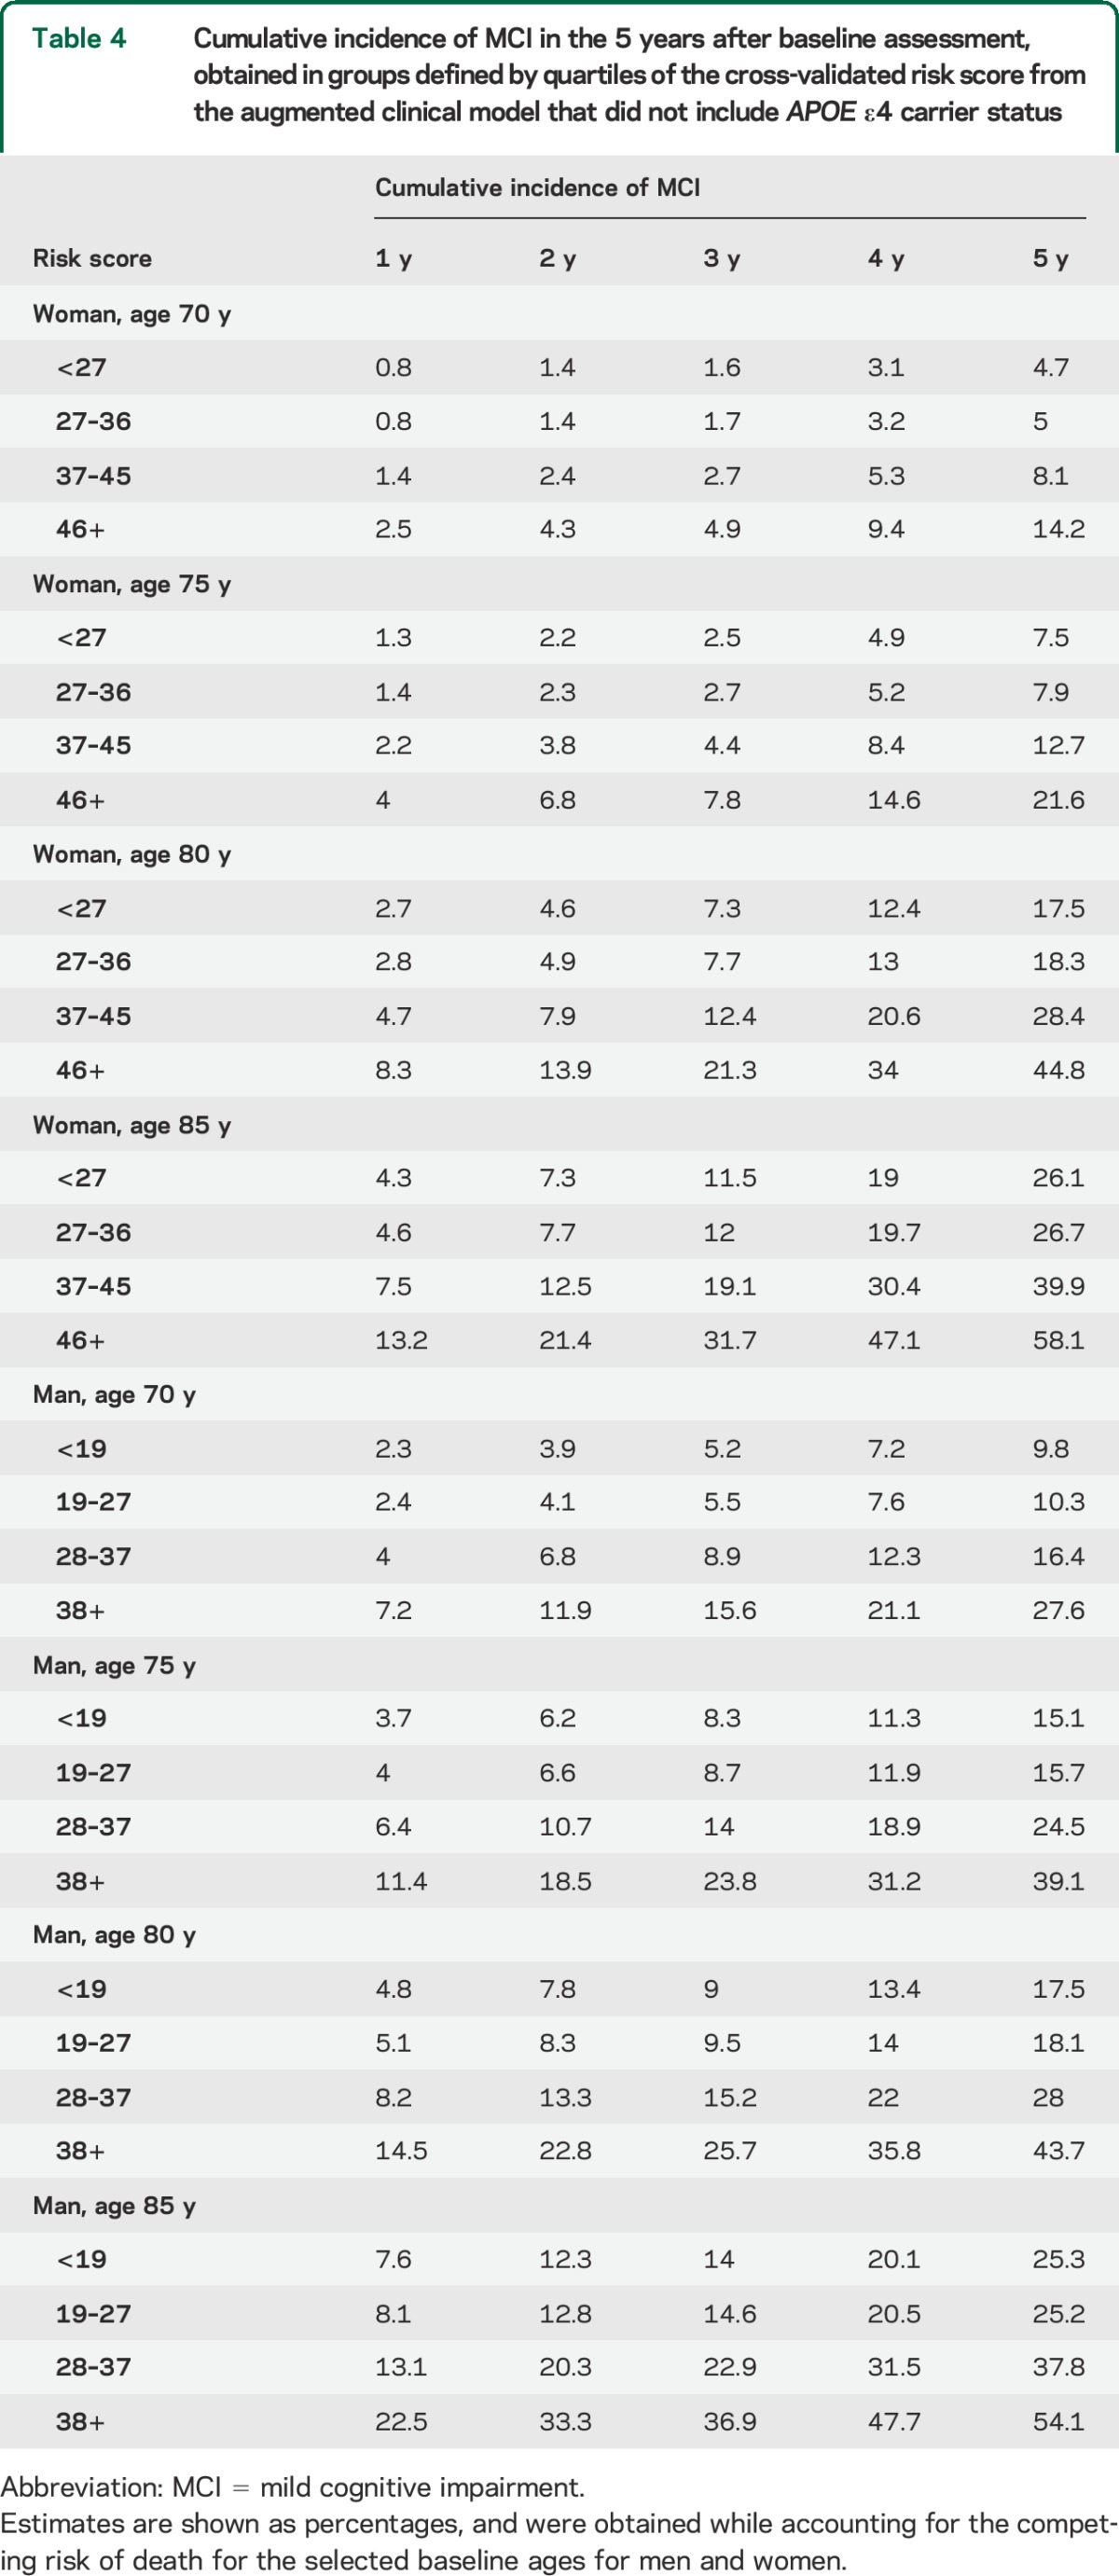
Table 4 illustrates the cumulative incidence of MCI at 1-year follow-up intervals for men and women at selected ages using the augmented clinical model without APOE ε4 genotypes and accounting for the competing risk of death (table e-1 on the Neurology® Web site at Neurology.org contains estimates from the model that includes APOE). The 5-year cumulative incidence rates suggest greater risk in men than women for participants 80 years and younger, and a greater risk in women than men for participants older than 80 years.
Table 4.
Cumulative incidence of MCI in the 5 years after baseline assessment, obtained in groups defined by quartiles of the cross-validated risk score from the augmented clinical model that did not include APOE ε4 carrier status
DISCUSSION
We developed risk scores for predicting incident MCI using variables that can easily be obtained in a clinical setting. Although not all persons with MCI progress to dementia, they are at greater risk than CN individuals.36 Early detection of individuals at high risk of developing MCI provides a wider window of opportunity to initiate preventive measures. Risk scores for MCI could likewise be used to identify those patients most likely to benefit from additional biomarker information, which must be obtained via more invasive and expensive procedures, e.g., MRI, PET scanning, or CSF analyses. These scores could also be used in the design of primary or secondary prevention clinical trials.
We previously identified risk factors associated with an increased risk of MCI.1–13 The present analyses demonstrate the predictive importance of these risk factors when incorporated into multivariable models and suggest that there are variables that quantify MCI risk differently for men and women. The risk scores obtained from these multivariable models can be used to stratify CN individuals according to their risk of MCI. Of note, all variables in these risk models, except APOE ε4 genotype, can be inexpensively assessed in the clinician's office.
When evaluated individually, several variables stand out as being associated with incident MCI. Individuals with self-reported memory complaints and those with diabetes were at higher risk of MCI. Markers of general health, including number of medications and slow gait, were also associated with risk of MCI. In addition, informant-reported neuropsychiatric features, and clinical and neurologic assessment summary scores (e.g., STMS and UPDRS) were associated with MCI risk. Although it remains unclear whether these features are precursors to, or effects of, cognitive change, all measurements were made when the study participants were CN. Although it is difficult to interpret these results from an etiologic standpoint, it is possible to use this baseline information to predict a later diagnosis of MCI.
The cross-validated C statistic from the basic model was 0.60, suggesting it has a relatively low ability to classify individuals by MCI risk. The performance of the augmented model was significantly better. In this model, STMS22 was the strongest predictor of MCI risk. A nonzero score on the CDR–Sum of Boxes20 and measures from the Neuropsychiatric Inventory19 were also associated with an increased risk of MCI. Notably, many predictive factors were different for men and women. The cross-validated C statistic was 0.70, and the separation of the survival curves for quartiles of the risk score was much greater than for the basic risk model.
APOE ε4 carrier status was associated with an increased risk of incident MCI. However, while APOE information did improve the estimation of risk scores at the individual level, the C statistic for the model that incorporated this genetic feature was unchanged from the augmented clinical model. This finding highlights a need to conduct further population-based studies to determine whether additional biomarkers improve risk stratification for MCI, and ultimately dementia.
The cumulative incidence estimates shown in table 4, adjusted for the competing risk of death, may be used to estimate the risk of MCI for individuals with a given score and a given age. Overall, the risk of MCI increases with age. Younger men have higher risk than younger women, whereas older women have somewhat higher risk than older men, consistent with our prior observations in the MCSA.3 It should be noted that these estimates were obtained using sex-specific groupings, from risk scores that incorporated different risk factors for men and women. These apparent age-sex differences in cumulative incidence raise critical questions about the potential impact of sex differences in the etiology or survival on MCI. It is our intention to identify additional features that further explain these differences in cumulative incidence by age and sex as we accrue additional follow-up and obtain greater statistical power.
Limitations of the work must be acknowledged. First, although we have utilized a cross-validation approach to model development and assessment, the results need to be validated in an independent cohort. It is possible that the identified risk scores may have different behavior outside of the MCSA. Second, our analyses focused on MCI incidence without regard for MCI subtype. It is likely that risk factors are different for nonamnestic vs amnestic MCI. We plan to assess these differences as we accrue more follow-up, and more incident cases of both amnestic and nonamnestic MCI. Lastly, the population of Olmsted County, MN, aged 70 and older is predominantly white and of European ancestry. Assessment of this risk score in more heterogeneous populations is needed to ascertain generalizability.
Important strengths of our study are that the models are based on longitudinally gathered data, obtained from a population-based sampling, and that the model estimates are applicable to CN individuals between the ages of 70 and 89 years, ages when symptoms of cognitive impairment typically emerge at increasing frequency. We have initiated studies of younger participants (less than 70 years), and the findings from a younger group will help develop risk scores for early-onset cognitive impairment, and will also provide critical information regarding the etiology of MCI and dementia.
We have developed models and scores that predict the risk of MCI among CN persons between the ages of 70 and 89 years. This may be useful to clinicians as they evaluate and counsel their patients, and to researchers as they design trials to study treatments to reduce the risk of cognitive impairment and dementia. Although additional validation in independent cohorts is essential, this is an important first step in classifying individuals into different categories of MCI risk.
Supplementary Material
GLOSSARY
- CI
confidence interval
- CN
cognitively normal
- CDR
Clinical Dementia Rating
- DSM-IV
Diagnostic and Statistical Manual of Mental Disorders (Fourth Edition)
- IQR
interquartile range
- MCI
mild cognitive impairment
- MCSA
Mayo Clinic Study of Aging
- SE
standard error
- STMS
Short Test of Mental Status
- UPDRS
Unified Parkinson's Disease Rating Scale
- WAIS-R
Wechsler Adult Intelligence Scale–Revised
- WMS-R
Wechsler Memory Scale–Revised
Footnotes
Editorial, page 1392
Supplemental data at Neurology.org
AUTHOR CONTRIBUTIONS
Dr. Pankratz: conception and design of the work, analysis and interpretation of data, initial drafting of the work and revisions for important intellectual content, final approval of the version to be published. Dr. Roberts: interpretation of data, critical revisions of the work for important intellectual content, final approval of the version to be published. Dr. Mielke: interpretation of data, critical revisions of the work for important intellectual content, final approval of the version to be published. Dr. Knopman: acquisition and interpretation of data, critical revisions of the work for important intellectual content, final approval of the version to be published. Dr. Jack: interpretation of data, critical revisions of the work for important intellectual content, final approval of the version to be published. Dr. Geda: acquisition and interpretation of data, critical revisions of the work for important intellectual content, final approval of the version to be published. Dr. Rocca: interpretation of data, critical revisions of the work for important intellectual content, final approval of the version to be published. Dr. Petersen: acquisition and interpretation of data, critical revisions of the work for important intellectual content, study supervision, final approval of the version to be published.
STUDY FUNDING
This study was supported by the NIH grants P50 AG016574, U01 AG006786, K01 MH068351, and K01 AG028573. This study was also supported by the Robert Wood Johnson Foundation, and by the Robert H. and Clarice Smith and Abigail Van Buren Alzheimer's Disease Research Program, and was made possible by the Rochester Epidemiology Project (R01 AG034676).
DISCLOSURE
V. Pankratz receives research support from the NIH. R. Roberts receives research support from the NIH, the Driskill Foundation, and previously received research support from AbbVie Health Economics and Outcomes Research. M. Mielke served as a consultant to Eli Lilly and receives research support from the NIH/NIA, the Alzheimer Drug Discovery Foundation, and the Michael J. Fox Foundation. D. Knopman serves as Deputy Editor for Neurology®; serves on a Data Safety Monitoring Board for Lundbeck Pharmaceuticals and for the Dominantly Inherited Alzheimer's Disease Treatment Unit. He has served on a Data Safety Monitoring Board for Lilly Pharmaceuticals; served as a consultant to TauRX, was an investigator in clinical trials sponsored by Baxter and Elan Pharmaceuticals in the past 2 years; and receives research support from the NIH. C. Jack has provided consulting services for Janssen Research & Development, LLC. He receives research funding from the NIH (R01-AG011378, U01-HL096917, U01-AG024904, R01-AG041851, R01-AG37551, R01-AG043392, U01-AG06786), and the Alexander Family Alzheimer's Disease Research Professorship of the Mayo Foundation. Y. Geda reports no disclosures. W. Rocca receives research funding from the NIH. R. Petersen is the Chair of Data Monitoring Committees for Pfizer and Janssen Alzheimer Immunotherapy, and has served as a consultant for Roche, Merck, and Genentech. He receives royalties from the publication of Mild Cognitive Impairment by Oxford University Press. Go to Neurology.org for full disclosures.
REFERENCES
- 1.Petersen RC, Roberts RO, Knopman DS, et al. Prevalence of mild cognitive impairment is higher in men: the Mayo Clinic Study of Aging. Neurology 2010;75:889–897. [DOI] [PMC free article] [PubMed] [Google Scholar]
- 2.Roberts RO, Geda YE, Knopman DS, et al. The Mayo Clinic Study of Aging: design and sampling, participation, baseline measures and sample characteristics. Neuroepidemiology 2008;30:58–69. [DOI] [PMC free article] [PubMed] [Google Scholar]
- 3.Roberts RO, Geda YE, Knopman DS, et al. The incidence of MCI differs by subtype and is higher in men: the Mayo Clinic Study of Aging. Neurology 2012;78:342–351. [DOI] [PMC free article] [PubMed] [Google Scholar]
- 4.Mielke MM, Wiste HJ, Weigand SD, et al. Indicators of amyloid burden in a population-based study of cognitively normal elderly. Neurology 2012;79:1570–1577. [DOI] [PMC free article] [PubMed] [Google Scholar]
- 5.Boot BP, Boeve BF, Roberts RO, et al. Probable rapid eye movement sleep behavior disorder increases risk for mild cognitive impairment and Parkinson disease: a population‐based study. Ann Neurol 2012;71:49–56. [DOI] [PMC free article] [PubMed] [Google Scholar]
- 6.Roberts RO, Geda YE, Knopman DS, et al. Metabolic syndrome, inflammation, and non-amnestic mild cognitive impairment in older persons: a population based study. Alzheimer Dis Assoc Disord 2010;24:11. [DOI] [PMC free article] [PubMed] [Google Scholar]
- 7.Roberts RO, Geda YE, Knopman DS, et al. Association of duration and severity of diabetes mellitus with mild cognitive impairment. Arch Neurol 2008;65:1066–1073. [DOI] [PMC free article] [PubMed] [Google Scholar]
- 8.Roberts RO, Knopman DS, Geda YE, et al. Association of diabetes with amnestic and nonamnestic mild cognitive impairment. Alzheimers Dement 2014;10:18–26. [DOI] [PMC free article] [PubMed] [Google Scholar]
- 9.Geda YE, Roberts RO, Knopman DS, et al. Prevalence of neuropsychiatric symptoms in mild cognitive impairment and normal cognitive aging: population-based study. Arch Gen Psychiatry 2008;65:1193. [DOI] [PMC free article] [PubMed] [Google Scholar]
- 10.Roberts RO, Knopman DS, Geda YE, Cha RH, Roger VL, Petersen RC. Coronary heart disease is associated with non-amnestic mild cognitive impairment. Neurobiol Aging 2010;31:1894–1902. [DOI] [PMC free article] [PubMed] [Google Scholar]
- 11.Roberts RO, Geda YE, Knopman DS, et al. Cardiac disease associated with increased risk of nonamnestic cognitive impairment: stronger effect on women. JAMA Neurol 2013;70:374–382. [DOI] [PMC free article] [PubMed] [Google Scholar]
- 12.Knopman DS, Roberts RO, Geda YE, et al. Association of prior stroke with cognitive function and cognitive impairment: a population-based study. Arch Neurol 2009;66:614–619. [DOI] [PMC free article] [PubMed] [Google Scholar]
- 13.Mielke MM, Roberts RO, Savica R, et al. Assessing the temporal relationship between cognition and gait: slow gait predicts cognitive decline in the Mayo Clinic Study of Aging. J Gerontol A Biol Sci Med Sci 2013;68:929–937. [DOI] [PMC free article] [PubMed] [Google Scholar]
- 14.Rocca WA, Yawn BP, St Sauver JL, Grossardt BR, Melton LJ., III History of the Rochester Epidemiology Project: half a century of medical records linkage in a US population. Mayo Clin Proc 2012;87:1202–1213. [DOI] [PMC free article] [PubMed] [Google Scholar]
- 15.St Sauver JL, Grossardt BR, Yawn BP, Melton LJ, III, Rocca WA. Use of a medical records linkage system to enumerate a dynamic population over time: the Rochester Epidemiology Project. Am J Epidemiol 2011;173:1059–1068. [DOI] [PMC free article] [PubMed] [Google Scholar]
- 16.St Sauver JL, Grossardt BR, Yawn BP, et al. Data resource profile: the Rochester Epidemiology Project (REP) medical records-linkage system. Int J Epidemiol 2012;41:1614–1624. [DOI] [PMC free article] [PubMed] [Google Scholar]
- 17.St Sauver JL, Grossardt BR, Leibson CL, Yawn BP, Melton LJ, III, Rocca WA. Generalizability of epidemiological findings and public health decisions: an illustration from the Rochester Epidemiology Project. Mayo Clin Proc 2012;87:151–160. [DOI] [PMC free article] [PubMed] [Google Scholar]
- 18.Katzman R, Brown T, Fuld P, Peck A, Schechter R, Schimmel H. Validation of a short Orientation-Memory-Concentration Test of cognitive impairment. Am J Psychiatry 1983;140:734–739. [DOI] [PubMed] [Google Scholar]
- 19.Cummings JL, Mega M, Gray K, Rosenberg-Thompson S, Carusi DA, Gornbein J. The Neuropsychiatric Inventory: comprehensive assessment of psychopathology in dementia. Neurology 1994;44:2308. [DOI] [PubMed] [Google Scholar]
- 20.Morris JC. The Clinical Dementia Rating (CDR): current version and scoring rules. Neurology 1993;43:2412–2414. [DOI] [PubMed] [Google Scholar]
- 21.Pfeffer R, Kurosaki T, Harrah C, Chance J, Filos S. Measurement of functional activities in older adults in the community. J Gerontol 1982;37:323–329. [DOI] [PubMed] [Google Scholar]
- 22.Kokmen E, Smith GE, Petersen RC, Tangalos E, Ivnik RC. The Short Test of Mental Status: correlations with standardized psychometric testing. Arch Neurol 1991;48:725–728. [DOI] [PubMed] [Google Scholar]
- 23.Fahn S, Elton R; UPDRS Development Committee. Unified Parkinson's Disease Rating Scale. In: Fahn S, Marsden CD, Calne DB, Goldstein M, editors. Recent Developments in Parkinson's Disease, Vol 2. Florham Park, NJ: Macmillan Health Care Information; 1987:153–163. [Google Scholar]
- 24.Hixson JE, Vernier DT. Restriction isotyping of human apolipoprotein E by gene amplification and cleavage with HhaI. J Lipid Res 1990;31:545–548. [PubMed] [Google Scholar]
- 25.Petersen RC. Mild cognitive impairment as a diagnostic entity. J Intern Med 2004;256:183–194. [DOI] [PubMed] [Google Scholar]
- 26.American Psychiatric Association. Diagnostic and Statistical Manual of Mental Disorders: DSM-IV. Washington, DC: American Psychiatric Association; 1994. [Google Scholar]
- 27.Ivnik RJ, Malec JF, Smith GE, et al. Mayo's Older Americans Normative Studies: WAIS-R norms for ages 56 to 97. Clin Neuropsychol 1992;6:1–30. [Google Scholar]
- 28.Brandt J, Spencer M, Folstein M. The telephone interview for cognitive status. Cogn Behav Neurol 1988;1:111–118. [Google Scholar]
- 29.Plassman BL, Newman TT, Welsh KA, Helms M, Breitner JC. Application in epidemiological and longitudinal studies. Cogn Behav Neurol 1994;7:235–241. [Google Scholar]
- 30.Welsh KA, Breitner JC, Magruder-Habib KM. Detection of dementia in the elderly using telephone screening of cognitive status. Cogn Behav Neurol 1993;6:103–110. [Google Scholar]
- 31.Knopman DS, Roberts RO, Geda YE, et al. Validation of the telephone interview for cognitive status-modified in subjects with normal cognition, mild cognitive impairment, or dementia. Neuroepidemiology 2010;34:34–42. [DOI] [PMC free article] [PubMed] [Google Scholar]
- 32.Arlot S, Celise A. A survey of cross-validation procedures for model selection. Stat Surv 2010;4:40–79. [Google Scholar]
- 33.Harrell FE, Lee KL, Mark DB. Multivariable prognostic models: issues in developing models, evaluating assumptions and adequacy, and measuring and reducing errors. Stat Med 1996;15:361–387. [DOI] [PubMed] [Google Scholar]
- 34.Gooley TA, Leisenring W, Crowley J, Storer BE. Estimation of failure probabilities in the presence of competing risks: new representations of old estimators. Stat Med 1999;18:695–706. [DOI] [PubMed] [Google Scholar]
- 35.Molinaro AM, Simon R, Pfeiffer RM. Prediction error estimation: a comparison of resampling methods. Bioinformatics 2005;21:3301–3307. [DOI] [PubMed] [Google Scholar]
- 36.Roberts RO, Knopman DS, Mielke MM, et al. Higher risk of progression to dementia in mild cognitive impairment cases who revert to normal. Neurology 2014;82:317–325. [DOI] [PMC free article] [PubMed] [Google Scholar]
Associated Data
This section collects any data citations, data availability statements, or supplementary materials included in this article.